Galmpton Airbnb Market Analysis 2025: Short Term Rental Data & Vacation Rental Statistics in England, United Kingdom
Is Airbnb profitable in Galmpton in 2025? Explore comprehensive Airbnb analytics for Galmpton, England, United Kingdom to uncover income potential. This 2025 STR market report for Galmpton, based on AirROI data from July 2024 to June 2025, reveals key trends in the niche market of 18 active listings.
Whether you're considering an Airbnb investment in Galmpton, optimizing your existing vacation rental, or exploring rental arbitrage opportunities, understanding the Galmpton Airbnb data is crucial. Leveraging the low regulation environment is key to maximizing your short term rental income potential. Let's dive into the specifics.
Key Galmpton Airbnb Performance Metrics Overview
Monthly Airbnb Revenue Variations & Income Potential in Galmpton (2025)
Understanding the monthly revenue variations for Airbnb listings in Galmpton is key to maximizing your short term rental income potential. Seasonality significantly impacts earnings. Our analysis, based on data from the past 12 months, shows that the peak revenue month for STRs in Galmpton is typically August, while November often presents the lowest earnings, highlighting opportunities for strategic pricing adjustments during shoulder and low seasons. Explore the typical Airbnb income in Galmpton across different performance tiers:
- Best-in-class properties (Top 10%) achieve $6,789+ monthly, often utilizing dynamic pricing and superior guest experiences.
- Strong performing properties (Top 25%) earn $3,360 or more, indicating effective management and desirable locations/amenities.
- Typical properties (Median) generate around $1,890 per month, representing the average market performance.
- Entry-level properties (Bottom 25%) see earnings around $932, often with potential for optimization.
Average Monthly Airbnb Earnings Trend in Galmpton
Galmpton Airbnb Occupancy Rate Trends (2025)
Maximize your bookings by understanding the Galmpton STR occupancy trends. Seasonal demand shifts significantly influence how often properties are booked. Typically, Augustsees the highest demand (peak season occupancy), while November experiences the lowest (low season). Effective strategies, like adjusting minimum stays or offering promotions, can boost occupancy during slower periods. Here's how different property tiers perform in Galmpton:
- Best-in-class properties (Top 10%) achieve 65%+ occupancy, indicating high desirability and potentially optimized availability.
- Strong performing properties (Top 25%) maintain 53% or higher occupancy, suggesting good market fit and guest satisfaction.
- Typical properties (Median) have an occupancy rate around 35%.
- Entry-level properties (Bottom 25%) average 20% occupancy, potentially facing higher vacancy.
Average Monthly Occupancy Rate Trend in Galmpton
Average Daily Rate (ADR) Airbnb Trends in Galmpton (2025)
Effective short term rental pricing strategy in Galmpton involves understanding monthly ADR fluctuations. The Average Daily Rate (ADR) for Airbnb in Galmpton typically peaks in June and dips lowest during February. Leveraging Airbnb dynamic pricing tools or strategies based on this seasonality can significantly boost revenue. Here's a look at the typical nightly rates achieved:
- Best-in-class properties (Top 10%) command rates of $464+ per night, often due to premium features or locations.
- Strong performing properties (Top 25%) achieve nightly rates of $271 or more.
- Typical properties (Median) charge around $166 per night.
- Entry-level properties (Bottom 25%) earn around $102 per night.
Average Daily Rate (ADR) Trend by Month in Galmpton
Get Live Galmpton Market Intelligence 👇
Explore Real-time Analytics
Airbnb Seasonality Analysis & Trends in Galmpton (2025)
Peak Season (August, May, April)
- Revenue averages $4,521 per month
- Occupancy rates average 52.1%
- Daily rates average $249
Shoulder Season
- Revenue averages $2,658 per month
- Occupancy maintains around 38.0%
- Daily rates hold near $242
Low Season (January, February, November)
- Revenue drops to average $954 per month
- Occupancy decreases to average 17.6%
- Daily rates adjust to average $228
Seasonality Insights for Galmpton
- The Airbnb seasonality in Galmpton shows highly seasonal trends requiring careful strategy. While the sections above show seasonal averages, it's also insightful to look at the extremes:
- During the high season, the absolute peak month showcases Galmpton's highest earning potential, with monthly revenues capable of climbing to $4,727, occupancy reaching a high of 65.1%, and ADRs peaking at $264.
- Conversely, the slowest single month of the year, typically falling within the low season, marks the market's lowest point. In this month, revenue might dip to $929, occupancy could drop to 13.9%, and ADRs may adjust down to $212.
- Understanding both the seasonal averages and these monthly peaks and troughs in revenue, occupancy, and ADR is crucial for maximizing your Airbnb profit potential in Galmpton.
Seasonal Strategies for Maximizing Profit
- Peak Season: Maximize revenue through premium pricing and potentially longer minimum stays. Ensure high availability.
- Low Season: Offer competitive pricing, special promotions (e.g., extended stay discounts), and flexible cancellation policies. Target off-season travelers like remote workers or budget-conscious guests.
- Shoulder Seasons: Implement dynamic pricing that balances peak and low rates. Target weekend travelers or specific events. Offer slightly more flexible terms than peak season.
- Regularly analyze your own performance against these Galmpton seasonality benchmarks and adjust your pricing and availability strategy accordingly.
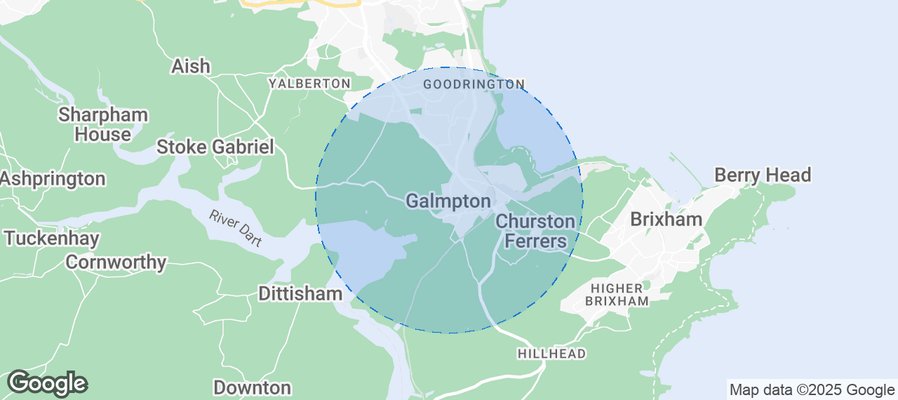
Best Areas for Airbnb Investment in Galmpton (2025)
Exploring the top neighborhoods for short-term rentals in Galmpton? This section highlights key areas, outlining why they are attractive for hosts and guests, along with notable local attractions. Consider these locations based on your target guest profile and investment strategy.
| Neighborhood / Area | Why Host Here? (Target Guests & Appeal) | Key Attractions & Landmarks |
|---|---|---|
| Galpton Village | A quaint and quiet village atmosphere, perfect for guests seeking relaxation and a typical English countryside experience. | Galton Water, Coombe Cellars, Coombe Woods, local pubs and restaurants |
| Brixham | A charming fishing port with stunning marine views, ideal for families and beach lovers. The vibrant harbor area draws many visitors year-round. | Brixham Harbour, Berry Head National Nature Reserve, Brixham Fish Market, Golden Hind, Breakwater Beach |
| Paignton | A popular seaside resort town with a long sandy beach and an array of attractions. It's perfect for holidaymakers looking for traditional British seaside experiences. | Paignton Beach, Paignton Pier, Paignton Zoo, Roundham Head, Geoplay Park |
| Torquay | Known as the English Riviera, Torquay is a well-known tourist destination with beautiful beaches and a lively nightlife scene, catering to various types of travelers. | Torquay Harbour, Kents Cavern, Living Coasts, Babbacombe Model Village, Beacon Cove |
| Dartmouth | A historic town with Georgian architecture and a picturesque setting by the River Dart. It attracts visitors interested in history, sailing, and fine dining. | Dartmouth Castle, Royal Avenue Gardens, Agatha Christie’s Greenway, Dartmouth Steam Railway, River Dart Cruises |
| Kingswear | Situated across the river from Dartmouth, Kingswear offers stunning views and easy access to scenic walking routes and boat trips. | Kingswear Castle, Dartmouth to Kingswear Ferry, Coast Path Walks, Local pubs and cafes |
| Churston Ferrers | A peaceful area with lush greenery and proximity to beautiful beaches, ideal for nature lovers and those wanting a rural retreat. | Churston Cove, local walking trails, Churston Manor, Dartmouth Golf Club |
| Brixham Marina | An ideal spot for yachting enthusiasts and fishing, Brixham Marina attracts visitors looking for water sports and scenic boat trips. | Brixham Marina, Yacht club, Scenic boat tours, Restaurants along the marina |
Understanding Airbnb License Requirements & STR Laws in Galmpton (2025)
While Galmpton, England, United Kingdom currently shows low STR regulations, specific Airbnb license requirements might still exist or change. Always verify the latest short term rental regulations and Airbnb license requirements directly with local government authorities for Galmpton to ensure full compliance before hosting.
(Source: AirROI data, 2025, finding no licensed listings among those analyzed)
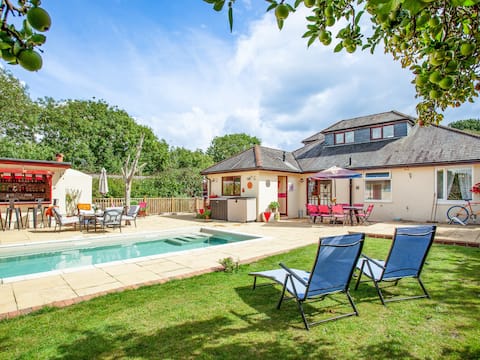
Top Performing Airbnb Properties in Galmpton (2025)
Benchmark your potential! Explore examples of top-performing Airbnb properties in Galmptonbased on Trailing Twelve Month (TTM) revenue. Analyze their characteristics, revenue, occupancy rate, and ADR to understand what drives success in this market.

The Spinney - Large home, gym, amazing sea views
Entire Place • 5 bedrooms
Pheasants Haunt
Entire Place • 4 bedrooms
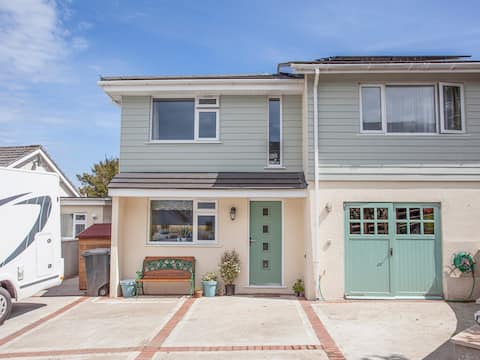
Driftwood Cottage
Entire Place • 2 bedrooms
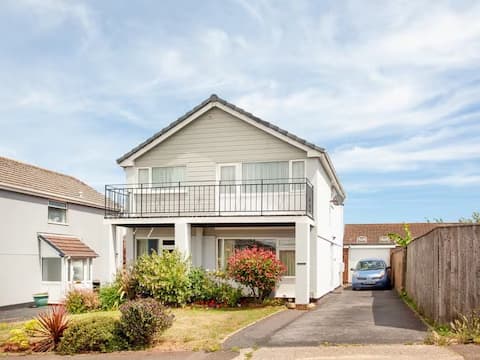
Torbay Holiday Home
Entire Place • 4 bedrooms

Pheasants Haunt
Entire Place • 4 bedrooms
Charming, one bedroom Orchard Lodge
Entire Place • 1 bedroom
Note: Performance varies based on location, size, amenities, seasonality, and management quality. Data reflects the past 12 months.
Top Performing Airbnb Hosts in Galmpton (2025)
Learn from the best! This table showcases top-performing Airbnb hosts in Galmpton based on the number of properties managed and estimated total revenue over the past year. Analyze their scale and performance metrics.
| Host Name | Properties | Grossing Revenue | Stay Reviews | Avg Rating |
|---|---|---|---|---|
| Fresh Escapes | 1 | $87,878 | 15 | 4.47/5.0 |
| Cottages | 2 | $53,121 | 5 | 5.00/5.0 |
| Anthony | 1 | $24,943 | 6 | 4.83/5.0 |
| Mandy | 1 | $21,687 | 21 | 5.00/5.0 |
| Lucy | 1 | $19,860 | 65 | 4.92/5.0 |
| Steve | 1 | $16,124 | 41 | 4.85/5.0 |
| Jeremy | 2 | $11,565 | 164 | 4.67/5.0 |
| Nigel | 1 | $11,179 | 82 | 4.99/5.0 |
| Host #391103818 | 1 | $9,034 | 118 | 5.00/5.0 |
| Jodie | 1 | $7,663 | 8 | 5.00/5.0 |
Analyzing the strategies of top hosts, such as their property selection, pricing, and guest communication, can offer valuable lessons for optimizing your own Airbnb operations in Galmpton.
Dive Deeper: Advanced Galmpton STR Market Data (2025)
Ready to unlock more insights? AirROI provides access to advanced metrics and comprehensive Airbnb data for Galmpton. Explore detailed analytics beyond this report to refine your investment strategy, optimize pricing, and maximize your vacation rental profits.
Explore Advanced MetricsGalmpton Short-Term Rental Market Composition (2025): Property & Room Types
Room Type Distribution
Property Type Distribution
Market Composition Insights for Galmpton
- The Galmpton Airbnb market composition is heavily skewed towards Entire Home/Apt listings, which make up 83.3% of the 18 active rentals. This indicates strong guest preference for privacy and space.
- Looking at the property type distribution in Galmpton, House properties are the most common (61.1%), reflecting the local real estate landscape.
- Houses represent a significant 61.1% portion, catering likely to families or larger groups.
- The presence of 11.1% Hotel/Boutique listings indicates integration with traditional hospitality.
Galmpton Airbnb Room Capacity Analysis (2025): Bedroom Distribution
Distribution of Listings by Number of Bedrooms
Room Capacity Insights for Galmpton
- The dominant room capacity in Galmpton is 4 bedrooms listings, making up 27.8% of the market. This suggests a strong demand for properties suitable for families or small groups.
- Together, 4 bedrooms and 3 bedrooms properties represent 50.0% of the active Airbnb listings in Galmpton, indicating a high concentration in these sizes.
- A significant 55.6% of listings offer 3+ bedrooms, catering to larger groups and families seeking more space in Galmpton.
Galmpton Vacation Rental Guest Capacity Trends (2025)
Distribution of Listings by Guest Capacity
Guest Capacity Insights for Galmpton
- The most common guest capacity trend in Galmpton vacation rentals is listings accommodating 2 guests (33.3%). This suggests the primary traveler segment is likely couples or solo travelers.
- Properties designed for 2 guests and 8+ guests dominate the Galmpton STR market, accounting for 61.1% of listings.
- 55.6% of properties accommodate 6+ guests, serving the market segment for larger families or group travel in Galmpton.
- On average, properties in Galmpton are equipped to host 4.6 guests.
Galmpton Airbnb Booking Patterns (2025): Available vs. Booked Days
Available Days Distribution
Booked Days Distribution
Booking Pattern Insights for Galmpton
- The most common availability pattern in Galmpton falls within the 271-366 days range, representing 72.2% of listings. This suggests many properties have significant open periods on their calendars.
- Approximately 94.4% of listings show high availability (181+ days open annually), indicating potential for increased bookings or specific owner usage patterns.
- For booked days, the 31-90 days range is most frequent in Galmpton (38.9%), reflecting common guest stay durations or potential owner blocking patterns.
- A notable 5.6% of properties secure long booking periods (181+ days booked per year), highlighting successful long-term rental strategies or significant owner usage.
Galmpton Airbnb Minimum Stay Requirements Analysis
Distribution of Listings by Minimum Night Requirement
1 Night
3 listings
18.8% of total
2 Nights
4 listings
25% of total
3 Nights
3 listings
18.8% of total
4-6 Nights
3 listings
18.8% of total
7-29 Nights
1 listings
6.3% of total
30+ Nights
2 listings
12.5% of total
Key Insights
- The most prevalent minimum stay requirement in Galmpton is 2 Nights, adopted by 25% of listings. This highlights the market's preference for shorter, flexible bookings.
- A significant segment (12.5%) caters to monthly stays (30+ nights) in Galmpton, pointing to opportunities in the extended-stay market.
Recommendations
- Align with the market by considering a 2 Nights minimum stay, as 25% of Galmpton hosts use this setting.
- If feasible, allowing 1-night stays, especially midweek or during low season, could capture last-minute bookings, as only 18.8% currently do.
- Explore offering discounts for stays of 30+ nights to attract the 12.5% of the market seeking extended stays.
- Adjust minimum nights based on seasonality – potentially shorter during low season and longer during peak demand periods in Galmpton.
Galmpton Airbnb Cancellation Policy Trends Analysis (2025)
Super Strict 30 Days
1 listings
6.3% of total
Super Strict 60 Days
1 listings
6.3% of total
Flexible
4 listings
25% of total
Moderate
1 listings
6.3% of total
Firm
5 listings
31.3% of total
Strict
4 listings
25% of total
Cancellation Policy Insights for Galmpton
- The prevailing Airbnb cancellation policy trend in Galmpton is Firm, used by 31.3% of listings.
- A majority (56.3%) of hosts in Galmpton utilize Firm or Strict policies, indicating a market where hosts prioritize booking security.
Recommendations for Hosts
- Consider adopting a Firm policy to align with the 31.3% market standard in Galmpton.
- Regularly review your cancellation policy against competitors and market demand shifts in Galmpton.
Galmpton STR Booking Lead Time Analysis (2025)
Average Booking Lead Time by Month
Booking Lead Time Insights for Galmpton
- The overall average booking lead time for vacation rentals in Galmpton is 57 days.
- Guests book furthest in advance for stays during May (average 83 days), likely coinciding with peak travel demand or local events.
- The shortest booking windows occur for stays in February (average 29 days), indicating more last-minute travel plans during this time.
- Seasonally, Fall (71 days avg.) sees the longest lead times, while Winter (44 days avg.) has the shortest, reflecting typical travel planning cycles.
Recommendations for Hosts
- Use the overall average lead time (57 days) as a baseline for your pricing and availability strategy in Galmpton.
- For May stays, consider implementing length-of-stay discounts or slightly higher rates for bookings made less than 83 days out to capitalize on advance planning.
- Target marketing efforts for the Fall season well in advance (at least 71 days) to capture early planners.
- Monitor your own booking lead times against these Galmpton averages to identify opportunities for dynamic pricing adjustments.
Popular & Essential Airbnb Amenities in Galmpton (2025)
Amenity data is currently unavailable for Galmpton.
Galmpton Airbnb Guest Demographics & Profile Analysis (2025)
Guest Profile Summary for Galmpton
- The typical guest profile for Airbnb in Galmpton consists of primarily domestic travelers (87%), often arriving from nearby England, typically belonging to the Post-2000s (Gen Z/Alpha) group (50%), primarily speaking English or French.
- Domestic travelers account for 87.3% of guests.
- Key international markets include United Kingdom (87.3%) and France (5.5%).
- Top languages spoken are English (51.2%) followed by French (12.2%).
- A significant demographic segment is the Post-2000s (Gen Z/Alpha) group, representing 50% of guests.
Recommendations for Hosts
- Target domestic marketing efforts towards travelers from England and London.
- Tailor amenities and listing descriptions to appeal to the dominant Post-2000s (Gen Z/Alpha) demographic (e.g., highlight fast WiFi, smart home features, local guides).
- Highlight unique local experiences or amenities relevant to the primary guest profile.
- Consider seasonal promotions aligned with peak travel times for key origin markets.
Nearby Short-Term Rental Market Comparison
How does the Galmpton Airbnb market stack up against its neighbors? Compare key performance metrics like average monthly revenue, ADR, and occupancy rates in surrounding areas to understand the broader regional STR landscape.
| Market | Active Properties | Monthly Revenue | Daily Rate | Avg. Occupancy |
|---|---|---|---|---|
| Chew Magna | 14 | $7,116 | $417.27 | 46% |
| Englishcombe | 15 | $6,386 | $526.47 | 49% |
| Long Sutton | 16 | $6,243 | $407.18 | 45% |
| Ashley | 12 | $5,408 | $388.63 | 51% |
| Llanrhidian | 14 | $5,389 | $353.04 | 58% |
| Oldland Common | 14 | $4,523 | $414.55 | 40% |
| Pensford | 10 | $4,504 | $849.80 | 37% |
| Crai | 32 | $4,387 | $501.90 | 39% |
| Freshford | 13 | $4,369 | $282.41 | 51% |
| Crossways | 40 | $4,184 | $514.92 | 35% |