Haddenham Airbnb Market Analysis 2026: Short Term Rental Data & Vacation Rental Statistics in England, United Kingdom
Is Airbnb profitable in Haddenham in 2026? Explore comprehensive Airbnb analytics for Haddenham, England, United Kingdom to uncover income potential. This 2026 STR market report for Haddenham, based on AirROI data from February 2025 to January 2026, reveals key trends in the niche market of 18 active listings.
Whether you're considering an Airbnb investment in Haddenham, optimizing your existing vacation rental, or exploring rental arbitrage opportunities, understanding the Haddenham Airbnb data is crucial. Leveraging the low regulation environment is key to maximizing your short term rental income potential. Let's dive into the specifics.
Key Haddenham Airbnb Performance Metrics Overview
Monthly Airbnb Revenue Variations & Income Potential in Haddenham (2026)
Understanding the monthly revenue variations for Airbnb listings in Haddenham is key to maximizing your short term rental income potential. Seasonality significantly impacts earnings. Our analysis, based on data from the past 12 months, shows that the peak revenue month for STRs in Haddenham is typically August, while January often presents the lowest earnings, highlighting opportunities for strategic pricing adjustments during shoulder and low seasons. Explore the typical Airbnb income in Haddenham across different performance tiers:
- Best-in-class properties (Top 10%) achieve $4,111+ monthly, often utilizing dynamic pricing and superior guest experiences.
- Strong performing properties (Top 25%) earn $3,157 or more, indicating effective management and desirable locations/amenities.
- Typical properties (Median) generate around $1,754 per month, representing the average market performance.
- Entry-level properties (Bottom 25%) see earnings around $1,165, often with potential for optimization.
Average Monthly Airbnb Earnings Trend in Haddenham
Haddenham Airbnb Occupancy Rate Trends (2026)
Maximize your bookings by understanding the Haddenham STR occupancy trends. Seasonal demand shifts significantly influence how often properties are booked. Typically, Julysees the highest demand (peak season occupancy), while January experiences the lowest (low season). Effective strategies, like adjusting minimum stays or offering promotions, can boost occupancy during slower periods. Here's how different property tiers perform in Haddenham:
- Best-in-class properties (Top 10%) achieve 91%+ occupancy, indicating high desirability and potentially optimized availability.
- Strong performing properties (Top 25%) maintain 76% or higher occupancy, suggesting good market fit and guest satisfaction.
- Typical properties (Median) have an occupancy rate around 59%.
- Entry-level properties (Bottom 25%) average 40% occupancy, potentially facing higher vacancy.
Average Monthly Occupancy Rate Trend in Haddenham
Average Daily Rate (ADR) Airbnb Trends in Haddenham (2026)
Effective short term rental pricing strategy in Haddenham involves understanding monthly ADR fluctuations. The Average Daily Rate (ADR) for Airbnb in Haddenham typically peaks in December and dips lowest during April. Leveraging Airbnb dynamic pricing tools or strategies based on this seasonality can significantly boost revenue. Here's a look at the typical nightly rates achieved:
- Best-in-class properties (Top 10%) command rates of $251+ per night, often due to premium features or locations.
- Strong performing properties (Top 25%) achieve nightly rates of $167 or more.
- Typical properties (Median) charge around $127 per night.
- Entry-level properties (Bottom 25%) earn around $101 per night.
Average Daily Rate (ADR) Trend by Month in Haddenham
Get Live Haddenham Market Intelligence 👇
Explore Real-time Analytics
Airbnb Seasonality Analysis & Trends in Haddenham (2026)
Peak Season (August, October, July)
- Revenue averages $2,901 per month
- Occupancy rates average 64.3%
- Daily rates average $154
Shoulder Season
- Revenue averages $2,363 per month
- Occupancy maintains around 60.1%
- Daily rates hold near $150
Low Season (January, February, April)
- Revenue drops to average $1,693 per month
- Occupancy decreases to average 49.8%
- Daily rates adjust to average $144
Seasonality Insights for Haddenham
- The Airbnb seasonality in Haddenham shows moderate seasonality with distinct peak and low periods. While the sections above show seasonal averages, it's also insightful to look at the extremes:
- During the high season, the absolute peak month showcases Haddenham's highest earning potential, with monthly revenues capable of climbing to $2,939, occupancy reaching a high of 66.3%, and ADRs peaking at $157.
- Conversely, the slowest single month of the year, typically falling within the low season, marks the market's lowest point. In this month, revenue might dip to $1,542, occupancy could drop to 41.3%, and ADRs may adjust down to $138.
- Understanding both the seasonal averages and these monthly peaks and troughs in revenue, occupancy, and ADR is crucial for maximizing your Airbnb profit potential in Haddenham.
Seasonal Strategies for Maximizing Profit
- Peak Season: Maximize revenue through premium pricing and potentially longer minimum stays. Ensure high availability.
- Low Season: Offer competitive pricing, special promotions (e.g., extended stay discounts), and flexible cancellation policies. Target off-season travelers like remote workers or budget-conscious guests.
- Shoulder Seasons: Implement dynamic pricing that balances peak and low rates. Target weekend travelers or specific events. Offer slightly more flexible terms than peak season.
- Regularly analyze your own performance against these Haddenham seasonality benchmarks and adjust your pricing and availability strategy accordingly.
Best Areas for Airbnb Investment in Haddenham (2026)
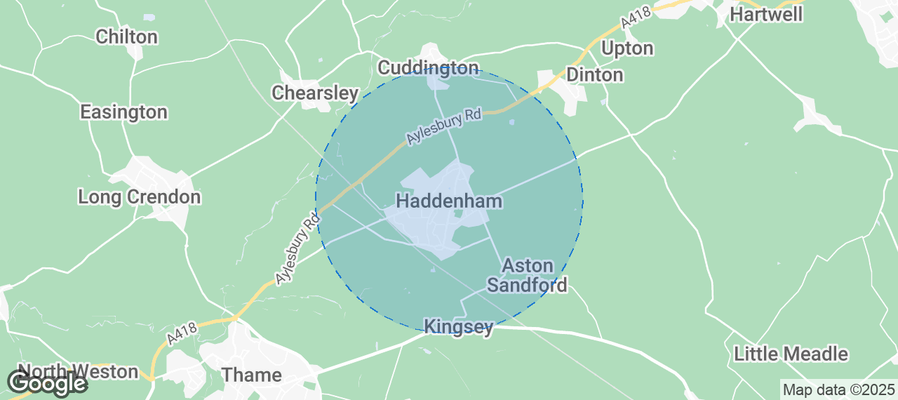
Exploring the top neighborhoods for short-term rentals in Haddenham? This section highlights key areas, outlining why they are attractive for hosts and guests, along with notable local attractions. Consider these locations based on your target guest profile and investment strategy.
| Neighborhood / Area | Why Host Here? (Target Guests & Appeal) | Key Attractions & Landmarks |
|---|---|---|
| Haddenham Village | Charming English village with scenic countryside, appealing to visitors looking for a quiet retreat while being close to larger towns. | Haddenham Nature Reserve, St. Mary's Church, Haddenham Museum, The Green, Local pubs and eateries |
| Thame | Nearby market town with historic charm, great dining options, and a lively market atmosphere, attractive to visitors interested in local culture. | Thame Museum, Thame Market, St. Mary's Church, The Crooked Billet, Local shops and cafes |
| Aylesbury | Larger town offering a variety of amenities, attractions and events, attracting both business and leisure travelers. | Aylesbury Waterside Theatre, The Roald Dahl Museum, Waddesdon Manor, The Gateway, Shopping centers |
| Oxford | Famous university city with rich history and culture, ideal for tourists and academics seeking short-term stays. | University of Oxford, Bodleian Library, Ashmolean Museum, Christ Church, Punting on the River Cherwell |
| Bicester | Home to Bicester Village, a popular shopping destination, it attracts both shoppers and tourists looking for boutique experiences. | Bicester Village, Garth Park, St Edburgha's Church, Local dining options, History of Bicester |
| Amersham | Historic market town with beautiful architecture and excellent connections to London, appealing to both local and overseas visitors. | Amersham Old Town, Chesham Bois Common, The Amersham Museum, Local restaurants, The Elgiva Theatre |
| Chinnor | Attractive village with access to the Chiltern Hills, appealing to nature lovers and those seeking a countryside experience. | Chinnor and Princes Risborough Railway, Chinnor Village Centre, Walking trails, Local pubs, Historic buildings |
| Marlow | Picturesque riverside town with a vibrant dining scene, popular with tourists looking for scenic walks and good restaurants. | Marlow Bridge, The Compleat Angler, Handy Cross Park, The Marlow Museum, Riverside dining options |
Understanding Airbnb License Requirements & STR Laws in Haddenham (2026)
While Haddenham, England, United Kingdom currently shows low STR regulations, specific Airbnb license requirements might still exist or change. Always verify the latest short term rental regulations and Airbnb license requirements directly with local government authorities for Haddenham to ensure full compliance before hosting.
(Source: AirROI data, 2026, finding no licensed listings among those analyzed)
Top Performing Airbnb Properties in Haddenham (2026)
Benchmark your potential! Explore examples of top-performing Airbnb properties in Haddenhambased on Trailing Twelve Month (TTM) revenue. Analyze their characteristics, revenue, occupancy rate, and ADR to understand what drives success in this market.

Modern two-bedroom home in idyllic Bucks village
Entire Place • 2 bedrooms

Stunning home with hot tub in picturesque village
Entire Place • 1 bedroom

A spacious & stylish retreat, ideal for long stays
Entire Place • 1 bedroom
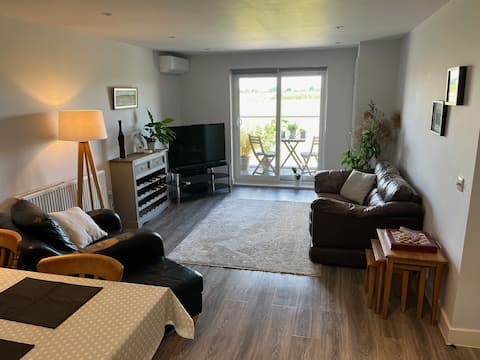
Modern Apartment in Haddenham
Entire Place • 2 bedrooms
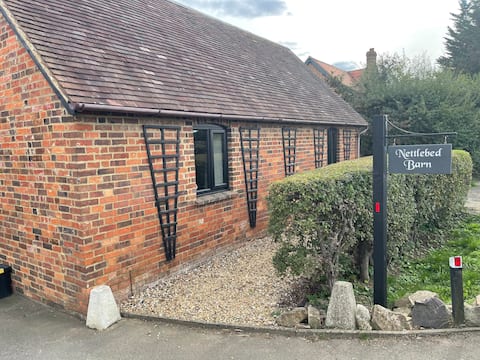
Self-contained barn conversion
Entire Place • 1 bedroom

The Coach House
Entire Place • 1 bedroom
Note: Performance varies based on location, size, amenities, seasonality, and management quality. Data reflects the past 12 months.
Top Performing Airbnb Hosts in Haddenham (2026)
Learn from the best! This table showcases top-performing Airbnb hosts in Haddenham based on the number of properties managed and estimated total revenue over the past year. Analyze their scale and performance metrics.
| Host Name | Properties | Grossing Revenue | Stay Reviews | Avg Rating |
|---|---|---|---|---|
| Jack | 1 | $72,620 | 36 | 4.83/5.0 |
| Steve | 1 | $45,930 | 165 | 4.96/5.0 |
| Julia | 1 | $44,032 | 69 | 4.96/5.0 |
| David | 1 | $42,500 | 85 | 5.00/5.0 |
| Claire | 1 | $28,748 | 501 | 4.93/5.0 |
| Deborah | 1 | $23,978 | 25 | 4.96/5.0 |
| Sophie | 1 | $22,137 | 163 | 4.94/5.0 |
| Caroline | 1 | $20,956 | 38 | 4.82/5.0 |
| Rex | 1 | $17,318 | 240 | 4.56/5.0 |
| Georgina | 1 | $16,622 | 90 | 4.92/5.0 |
Analyzing the strategies of top hosts, such as their property selection, pricing, and guest communication, can offer valuable lessons for optimizing your own Airbnb operations in Haddenham.
Dive Deeper: Advanced Haddenham STR Market Data (2026)
Ready to unlock more insights? AirROI provides access to advanced metrics and comprehensive Airbnb data for Haddenham. Explore detailed analytics beyond this report to refine your investment strategy, optimize pricing, and maximize your vacation rental profits.
Explore Advanced MetricsHaddenham Short-Term Rental Market Composition (2026): Property & Room Types
Room Type Distribution
Property Type Distribution
Market Composition Insights for Haddenham
- The Haddenham Airbnb market composition is heavily skewed towards Entire Home/Apt listings, which make up 83.3% of the 18 active rentals. This indicates strong guest preference for privacy and space.
- Looking at the property type distribution in Haddenham, House properties are the most common (50%), reflecting the local real estate landscape.
- Houses represent a significant 50% portion, catering likely to families or larger groups.
- The presence of 16.7% Hotel/Boutique listings indicates integration with traditional hospitality.
Haddenham Airbnb Room Capacity Analysis (2026): Bedroom Distribution
Distribution of Listings by Number of Bedrooms
Room Capacity Insights for Haddenham
- The dominant room capacity in Haddenham is 1 bedroom listings, making up 55.6% of the market. This suggests a strong demand for properties suitable for couples or solo travelers.
- Together, 1 bedroom and 2 bedrooms properties represent 77.8% of the active Airbnb listings in Haddenham, indicating a high concentration in these sizes.
- With over half the market (55.6%) consisting of studios or 1-bedroom units, Haddenham is particularly well-suited for individuals or couples.
- Listings with 3+ bedrooms (5.6%) represent a smaller niche, potentially indicating an underserved market for larger group accommodations in Haddenham.
Haddenham Vacation Rental Guest Capacity Trends (2026)
Distribution of Listings by Guest Capacity
Guest Capacity Insights for Haddenham
- The most common guest capacity trend in Haddenham vacation rentals is listings accommodating 2 guests (44.4%). This suggests the primary traveler segment is likely couples or solo travelers.
- Properties designed for 2 guests and 4 guests dominate the Haddenham STR market, accounting for 72.2% of listings.
- A significant 44.4% of listings cater specifically to 1-2 guests, highlighting strong demand from couples and solo travelers in Haddenham.
- 11.2% of properties accommodate 6+ guests, serving the market segment for larger families or group travel in Haddenham.
- On average, properties in Haddenham are equipped to host 2.8 guests.
Haddenham Airbnb Booking Patterns (2026): Available vs. Booked Days
Available Days Distribution
Booked Days Distribution
Booking Pattern Insights for Haddenham
- The most common availability pattern in Haddenham falls within the 91-180 days range, representing 44.4% of listings. This suggests many properties have significant open periods on their calendars.
- Approximately 44.5% of listings show high availability (181+ days open annually), indicating potential for increased bookings or specific owner usage patterns.
- For booked days, the 181-270 days range is most frequent in Haddenham (38.9%), reflecting common guest stay durations or potential owner blocking patterns.
- A notable 55.6% of properties secure long booking periods (181+ days booked per year), highlighting successful long-term rental strategies or significant owner usage.
Haddenham Airbnb Minimum Stay Requirements Analysis
Distribution of Listings by Minimum Night Requirement
1 Night
7 listings
38.9% of total
2 Nights
7 listings
38.9% of total
4-6 Nights
1 listings
5.6% of total
30+ Nights
3 listings
16.7% of total
Key Insights
- The most prevalent minimum stay requirement in Haddenham is 1 Night, adopted by 38.9% of listings. This highlights the market's preference for shorter, flexible bookings.
- A strong majority (77.8%) of the Haddenham Airbnb data shows acceptance of very short stays (1-2 nights), indicating a dynamic, high-turnover market.
- A significant segment (16.7%) caters to monthly stays (30+ nights) in Haddenham, pointing to opportunities in the extended-stay market.
Recommendations
- Align with the market by considering a 1 Night minimum stay, as 38.9% of Haddenham hosts use this setting.
- Explore offering discounts for stays of 30+ nights to attract the 16.7% of the market seeking extended stays.
- Adjust minimum nights based on seasonality – potentially shorter during low season and longer during peak demand periods in Haddenham.
Haddenham Airbnb Cancellation Policy Trends Analysis (2026)
Flexible
5 listings
27.8% of total
Moderate
8 listings
44.4% of total
Firm
5 listings
27.8% of total
Cancellation Policy Insights for Haddenham
- The prevailing Airbnb cancellation policy trend in Haddenham is Moderate, used by 44.4% of listings.
- The market strongly favors guest-friendly terms, with 72.2% of listings offering Flexible or Moderate policies. This suggests guests in Haddenham may expect booking flexibility.
Recommendations for Hosts
- Consider adopting a Moderate policy to align with the 44.4% market standard in Haddenham.
- Regularly review your cancellation policy against competitors and market demand shifts in Haddenham.
Haddenham STR Booking Lead Time Analysis (2026)
Average Booking Lead Time by Month
Booking Lead Time Insights for Haddenham
- The overall average booking lead time for vacation rentals in Haddenham is 43 days.
- Guests book furthest in advance for stays during August (average 71 days), likely coinciding with peak travel demand or local events.
- The shortest booking windows occur for stays in March (average 21 days), indicating more last-minute travel plans during this time.
- Seasonally, Summer (59 days avg.) sees the longest lead times, while Spring (33 days avg.) has the shortest, reflecting typical travel planning cycles.
Recommendations for Hosts
- Use the overall average lead time (43 days) as a baseline for your pricing and availability strategy in Haddenham.
- For August stays, consider implementing length-of-stay discounts or slightly higher rates for bookings made less than 71 days out to capitalize on advance planning.
- Target marketing efforts for the Summer season well in advance (at least 59 days) to capture early planners.
- Monitor your own booking lead times against these Haddenham averages to identify opportunities for dynamic pricing adjustments.
Popular & Essential Airbnb Amenities in Haddenham (2026)
Amenity Prevalence
Amenity Insights for Haddenham
- Essential amenities in Haddenham that guests expect include: Heating. Lacking these (this) could significantly impact bookings.
- Popular amenities like Free parking on premises, Smoke alarm, Wifi are common but not universal. Offering these can provide a competitive edge.
- Warning: Wifi is not universally provided but is considered essential globally. Ensure reliable Wifi is offered.
Recommendations for Hosts
- Ensure your listing includes all essential amenities for Haddenham: Heating.
- Consider adding popular differentiators like Free parking on premises or Smoke alarm to increase appeal.
- Highlight unique or less common amenities you offer (e.g., hot tub, dedicated workspace, EV charger) in your listing description and photos.
- Regularly check competitor amenities in Haddenham to stay competitive.
Haddenham Airbnb Guest Demographics & Profile Analysis (2026)
Guest Profile Summary for Haddenham
- The typical guest profile for Airbnb in Haddenham consists of primarily domestic travelers (88%), often arriving from nearby England, typically belonging to the Post-2000s (Gen Z/Alpha) group (50%), primarily speaking English or French.
- Domestic travelers account for 88.4% of guests.
- Key international markets include United Kingdom (88.4%) and United States (3.3%).
- Top languages spoken are English (65.9%) followed by French (10.1%).
- A significant demographic segment is the Post-2000s (Gen Z/Alpha) group, representing 50% of guests.
Recommendations for Hosts
- Target domestic marketing efforts towards travelers from England and London.
- Tailor amenities and listing descriptions to appeal to the dominant Post-2000s (Gen Z/Alpha) demographic (e.g., highlight fast WiFi, smart home features, local guides).
- Highlight unique local experiences or amenities relevant to the primary guest profile.
- Consider seasonal promotions aligned with peak travel times for key origin markets.
Nearby Short-Term Rental Market Comparison
How does the Haddenham Airbnb market stack up against its neighbors? Compare key performance metrics like average monthly revenue, ADR, and occupancy rates in surrounding areas to understand the broader regional STR landscape.
| Market | Active Properties | Monthly Revenue | Daily Rate | Avg. Occupancy |
|---|---|---|---|---|
| Dorney | 11 | $7,510 | $743.63 | 39% |
| Lambourn | 11 | $6,499 | $723.41 | 31% |
| Wraysbury | 16 | $6,199 | $530.56 | 49% |
| City of Westminster | 1,424 | $6,053 | $515.72 | 50% |
| Dinton | 11 | $4,871 | $292.60 | 52% |
| Furzehill | 10 | $4,680 | $287.32 | 49% |
| Shrewton | 15 | $4,402 | $465.24 | 44% |
| Alderbury | 21 | $4,337 | $357.78 | 47% |
| Old Windsor | 20 | $4,177 | $286.69 | 49% |
| Cookham | 20 | $4,138 | $347.79 | 47% |