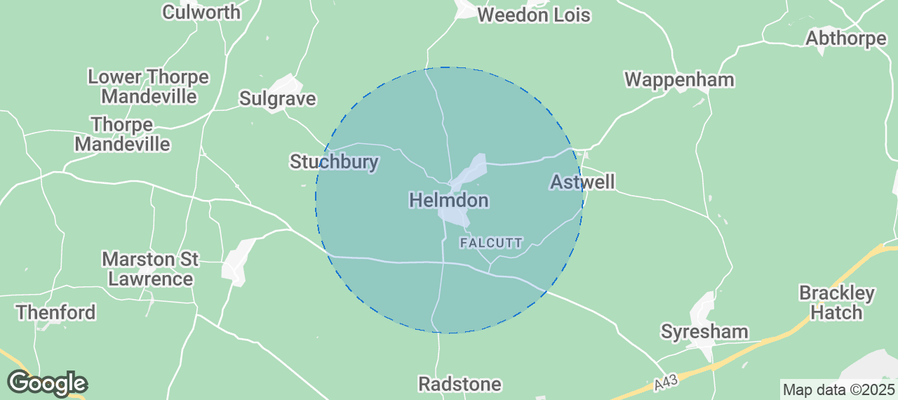
Helmdon Airbnb Market Analysis 2026: Short Term Rental Data & Vacation Rental Statistics in England, United Kingdom
Is Airbnb profitable in Helmdon in 2026? Explore comprehensive Airbnb analytics for Helmdon, England, United Kingdom to uncover income potential. This 2026 STR market report for Helmdon, based on AirROI data from February 2025 to January 2026, reveals key trends in the niche market of 19 active listings.
Whether you're considering an Airbnb investment in Helmdon, optimizing your existing vacation rental, or exploring rental arbitrage opportunities, understanding the Helmdon Airbnb data is crucial. Leveraging the low regulation environment is key to maximizing your short term rental income potential. Let's dive into the specifics.
Key Helmdon Airbnb Performance Metrics Overview
Monthly Airbnb Revenue Variations & Income Potential in Helmdon (2026)
Understanding the monthly revenue variations for Airbnb listings in Helmdon is key to maximizing your short term rental income potential. Seasonality significantly impacts earnings. Our analysis, based on data from the past 12 months, shows that the peak revenue month for STRs in Helmdon is typically June, while February often presents the lowest earnings, highlighting opportunities for strategic pricing adjustments during shoulder and low seasons. Explore the typical Airbnb income in Helmdon across different performance tiers:
- Best-in-class properties (Top 10%) achieve $7,545+ monthly, often utilizing dynamic pricing and superior guest experiences.
- Strong performing properties (Top 25%) earn $2,934 or more, indicating effective management and desirable locations/amenities.
- Typical properties (Median) generate around $1,472 per month, representing the average market performance.
- Entry-level properties (Bottom 25%) see earnings around $585, often with potential for optimization.
Average Monthly Airbnb Earnings Trend in Helmdon
Helmdon Airbnb Occupancy Rate Trends (2026)
Maximize your bookings by understanding the Helmdon STR occupancy trends. Seasonal demand shifts significantly influence how often properties are booked. Typically, Junesees the highest demand (peak season occupancy), while January experiences the lowest (low season). Effective strategies, like adjusting minimum stays or offering promotions, can boost occupancy during slower periods. Here's how different property tiers perform in Helmdon:
- Best-in-class properties (Top 10%) achieve 64%+ occupancy, indicating high desirability and potentially optimized availability.
- Strong performing properties (Top 25%) maintain 50% or higher occupancy, suggesting good market fit and guest satisfaction.
- Typical properties (Median) have an occupancy rate around 33%.
- Entry-level properties (Bottom 25%) average 17% occupancy, potentially facing higher vacancy.
Average Monthly Occupancy Rate Trend in Helmdon
Average Daily Rate (ADR) Airbnb Trends in Helmdon (2026)
Effective short term rental pricing strategy in Helmdon involves understanding monthly ADR fluctuations. The Average Daily Rate (ADR) for Airbnb in Helmdon typically peaks in July and dips lowest during November. Leveraging Airbnb dynamic pricing tools or strategies based on this seasonality can significantly boost revenue. Here's a look at the typical nightly rates achieved:
- Best-in-class properties (Top 10%) command rates of $381+ per night, often due to premium features or locations.
- Strong performing properties (Top 25%) achieve nightly rates of $221 or more.
- Typical properties (Median) charge around $127 per night.
- Entry-level properties (Bottom 25%) earn around $87 per night.
Average Daily Rate (ADR) Trend by Month in Helmdon
Get Live Helmdon Market Intelligence 👇
Explore Real-time Analytics
Airbnb Seasonality Analysis & Trends in Helmdon (2026)
Peak Season (June, September, August)
- Revenue averages $4,140 per month
- Occupancy rates average 43.4%
- Daily rates average $256
Shoulder Season
- Revenue averages $2,873 per month
- Occupancy maintains around 35.2%
- Daily rates hold near $249
Low Season (January, February, March)
- Revenue drops to average $1,207 per month
- Occupancy decreases to average 27.7%
- Daily rates adjust to average $248
Seasonality Insights for Helmdon
- The Airbnb seasonality in Helmdon shows highly seasonal trends requiring careful strategy. While the sections above show seasonal averages, it's also insightful to look at the extremes:
- During the high season, the absolute peak month showcases Helmdon's highest earning potential, with monthly revenues capable of climbing to $4,467, occupancy reaching a high of 48.0%, and ADRs peaking at $267.
- Conversely, the slowest single month of the year, typically falling within the low season, marks the market's lowest point. In this month, revenue might dip to $1,053, occupancy could drop to 21.7%, and ADRs may adjust down to $238.
- Understanding both the seasonal averages and these monthly peaks and troughs in revenue, occupancy, and ADR is crucial for maximizing your Airbnb profit potential in Helmdon.
Seasonal Strategies for Maximizing Profit
- Peak Season: Maximize revenue through premium pricing and potentially longer minimum stays. Ensure high availability.
- Low Season: Offer competitive pricing, special promotions (e.g., extended stay discounts), and flexible cancellation policies. Target off-season travelers like remote workers or budget-conscious guests.
- Shoulder Seasons: Implement dynamic pricing that balances peak and low rates. Target weekend travelers or specific events. Offer slightly more flexible terms than peak season.
- Regularly analyze your own performance against these Helmdon seasonality benchmarks and adjust your pricing and availability strategy accordingly.
Best Areas for Airbnb Investment in Helmdon (2026)
Exploring the top neighborhoods for short-term rentals in Helmdon? This section highlights key areas, outlining why they are attractive for hosts and guests, along with notable local attractions. Consider these locations based on your target guest profile and investment strategy.
| Neighborhood / Area | Why Host Here? (Target Guests & Appeal) | Key Attractions & Landmarks |
|---|---|---|
| South Beach | Iconic Miami Beach neighborhood known for its Art Deco architecture and vibrant nightlife. Prime location for tourists seeking the quintessential Miami experience with direct beach access and endless entertainment options. | Art Deco Historic District, Ocean Drive, Lummus Park Beach, Lincoln Road Mall, Española Way, Miami Beach Boardwalk |
| Brickell | Miami's modern financial district with luxury high-rises and upscale amenities. Popular with business travelers and those seeking an urban luxury experience with easy access to downtown. | Brickell City Centre, Mary Brickell Village, Miami River restaurants, Brickell Key, Simpson Park |
| Wynwood | Trendy arts district known for its colorful murals and hipster culture. Attracts young professionals and creative types looking for a unique, cultural experience. | Wynwood Walls, art galleries, craft breweries, Wynwood Art Walk, trendy restaurants and bars |
Understanding Airbnb License Requirements & STR Laws in Helmdon (2026)
While Helmdon, England, United Kingdom currently shows low STR regulations, specific Airbnb license requirements might still exist or change. Always verify the latest short term rental regulations and Airbnb license requirements directly with local government authorities for Helmdon to ensure full compliance before hosting.
(Source: AirROI data, 2026, finding no licensed listings among those analyzed)
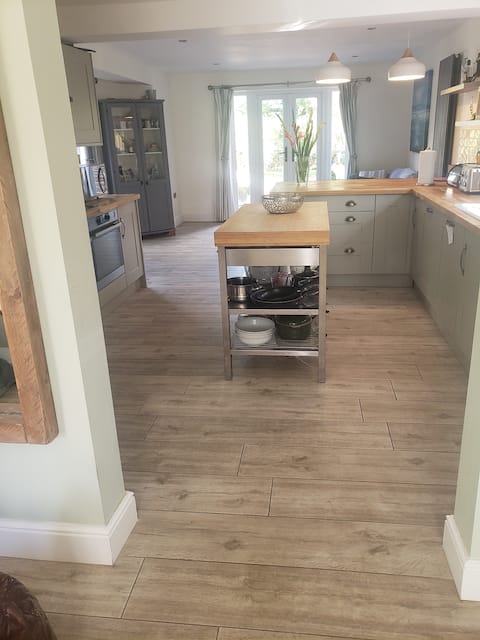
Top Performing Airbnb Properties in Helmdon (2026)
Benchmark your potential! Explore examples of top-performing Airbnb properties in Helmdonbased on Trailing Twelve Month (TTM) revenue. Analyze their characteristics, revenue, occupancy rate, and ADR to understand what drives success in this market.
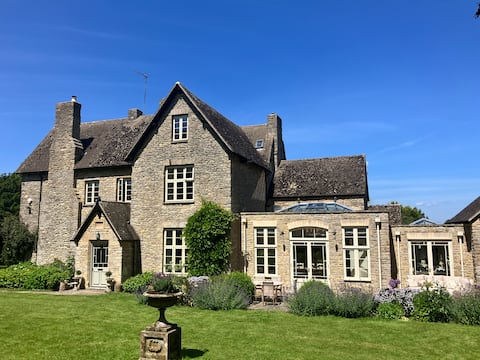
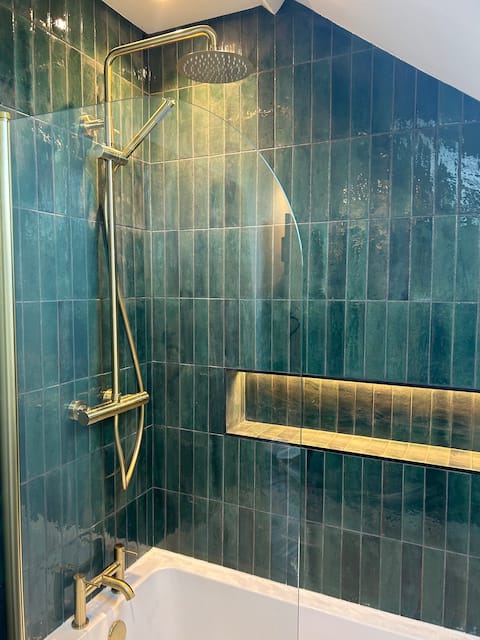
Helmdon House - pool & tennis court, 7 bedrooms
Entire Place • 7 bedrooms
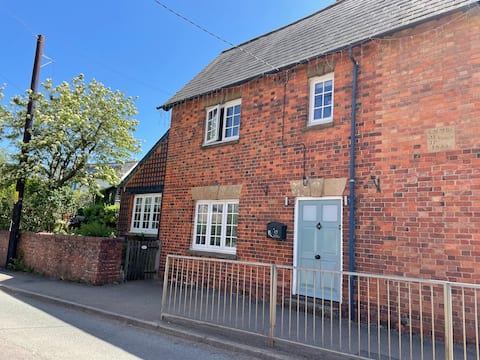
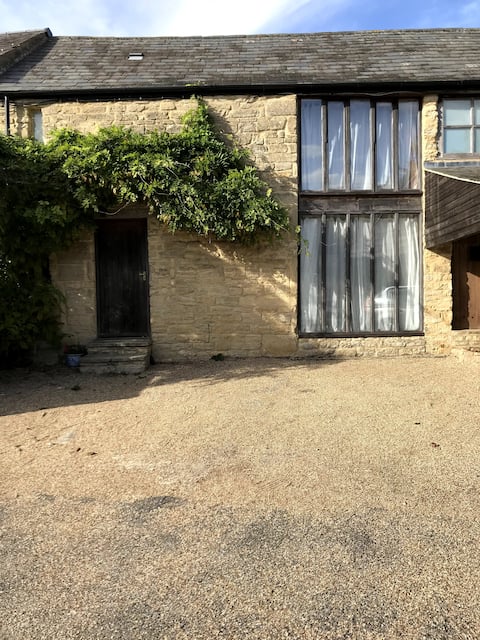
Family 3-bedroom home in lovely village
Entire Place • 3 bedrooms
Spacious 4 bed house. 10 min from Silverstone
Entire Place • 4 bedrooms
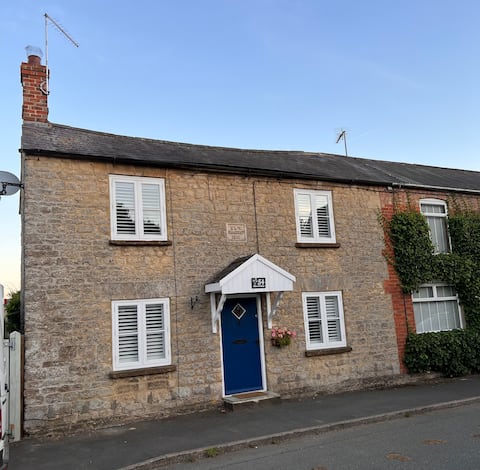
Close to Silverstone - Newly Refurbished Cottage
Entire Place • 3 bedrooms
Charming 3 Bedroom Village House near Silverstone
Entire Place • 3 bedrooms
Hillcrest Cottage
Entire Place • 2 bedrooms
Note: Performance varies based on location, size, amenities, seasonality, and management quality. Data reflects the past 12 months.
Top Performing Airbnb Hosts in Helmdon (2026)
Learn from the best! This table showcases top-performing Airbnb hosts in Helmdon based on the number of properties managed and estimated total revenue over the past year. Analyze their scale and performance metrics.
| Host Name | Properties | Grossing Revenue | Stay Reviews | Avg Rating |
|---|---|---|---|---|
| Emma | 1 | $138,975 | 9 | 5.00/5.0 |
| Helen | 4 | $75,938 | 74 | 5.00/5.0 |
| Anna | 1 | $66,289 | 9 | 4.78/5.0 |
| Sophie | 2 | $51,986 | 14 | 5.00/5.0 |
| Mark | 3 | $35,289 | 62 | 4.92/5.0 |
| Joanna | 1 | $27,853 | 114 | 4.85/5.0 |
| Stefano | 1 | $24,094 | 47 | 5.00/5.0 |
| Chris | 1 | $20,606 | 76 | 4.92/5.0 |
| Graham | 3 | $2,558 | 36 | 4.88/5.0 |
| James | 1 | $1,032 | 2 | Not Rated |
Analyzing the strategies of top hosts, such as their property selection, pricing, and guest communication, can offer valuable lessons for optimizing your own Airbnb operations in Helmdon.
Dive Deeper: Advanced Helmdon STR Market Data (2026)
Ready to unlock more insights? AirROI provides access to advanced metrics and comprehensive Airbnb data for Helmdon. Explore detailed analytics beyond this report to refine your investment strategy, optimize pricing, and maximize your vacation rental profits.
Explore Advanced MetricsHelmdon Short-Term Rental Market Composition (2026): Property & Room Types
Room Type Distribution
Property Type Distribution
Market Composition Insights for Helmdon
- The Helmdon Airbnb market composition is heavily skewed towards Entire Home/Apt listings, which make up 57.9% of the 19 active rentals. This indicates strong guest preference for privacy and space.
- However, a notable 42.1% share for Private Rooms suggests opportunities for budget-conscious travelers or hosts renting out spare rooms.
- Looking at the property type distribution in Helmdon, House properties are the most common (57.9%), reflecting the local real estate landscape.
- Houses represent a significant 57.9% portion, catering likely to families or larger groups.
- The presence of 21.1% Hotel/Boutique listings indicates integration with traditional hospitality.
Helmdon Airbnb Room Capacity Analysis (2026): Bedroom Distribution
Distribution of Listings by Number of Bedrooms
Room Capacity Insights for Helmdon
- The dominant room capacity in Helmdon is 1 bedroom listings, making up 36.8% of the market. This suggests a strong demand for properties suitable for couples or solo travelers.
- Together, 1 bedroom and 3 bedrooms properties represent 52.6% of the active Airbnb listings in Helmdon, indicating a high concentration in these sizes.
- A significant 26.4% of listings offer 3+ bedrooms, catering to larger groups and families seeking more space in Helmdon.
Helmdon Vacation Rental Guest Capacity Trends (2026)
Distribution of Listings by Guest Capacity
Guest Capacity Insights for Helmdon
- The most common guest capacity trend in Helmdon vacation rentals is listings accommodating 2 guests (21.1%). This suggests the primary traveler segment is likely couples or solo travelers.
- Properties designed for 2 guests and 5 guests dominate the Helmdon STR market, accounting for 36.9% of listings.
- 15.8% of properties accommodate 6+ guests, serving the market segment for larger families or group travel in Helmdon.
- On average, properties in Helmdon are equipped to host 2.9 guests.
Helmdon Airbnb Booking Patterns (2026): Available vs. Booked Days
Available Days Distribution
Booked Days Distribution
Booking Pattern Insights for Helmdon
- The most common availability pattern in Helmdon falls within the 271-366 days range, representing 52.6% of listings. This suggests many properties have significant open periods on their calendars.
- Approximately 94.7% of listings show high availability (181+ days open annually), indicating potential for increased bookings or specific owner usage patterns.
- For booked days, the 91-180 days range is most frequent in Helmdon (42.1%), reflecting common guest stay durations or potential owner blocking patterns.
- A notable 5.3% of properties secure long booking periods (181+ days booked per year), highlighting successful long-term rental strategies or significant owner usage.
Helmdon Airbnb Minimum Stay Requirements Analysis
Distribution of Listings by Minimum Night Requirement
1 Night
12 listings
63.2% of total
2 Nights
4 listings
21.1% of total
30+ Nights
3 listings
15.8% of total
Key Insights
- The most prevalent minimum stay requirement in Helmdon is 1 Night, adopted by 63.2% of listings. This highlights the market's preference for shorter, flexible bookings.
- A strong majority (84.3%) of the Helmdon Airbnb data shows acceptance of very short stays (1-2 nights), indicating a dynamic, high-turnover market.
- A significant segment (15.8%) caters to monthly stays (30+ nights) in Helmdon, pointing to opportunities in the extended-stay market.
Recommendations
- Align with the market by considering a 1 Night minimum stay, as 63.2% of Helmdon hosts use this setting.
- Explore offering discounts for stays of 30+ nights to attract the 15.8% of the market seeking extended stays.
- Adjust minimum nights based on seasonality – potentially shorter during low season and longer during peak demand periods in Helmdon.
Helmdon Airbnb Cancellation Policy Trends Analysis (2026)
Flexible
4 listings
23.5% of total
Moderate
3 listings
17.6% of total
Firm
6 listings
35.3% of total
Strict
4 listings
23.5% of total
Cancellation Policy Insights for Helmdon
- The prevailing Airbnb cancellation policy trend in Helmdon is Firm, used by 35.3% of listings.
- A majority (58.8%) of hosts in Helmdon utilize Firm or Strict policies, indicating a market where hosts prioritize booking security.
Recommendations for Hosts
- Consider adopting a Firm policy to align with the 35.3% market standard in Helmdon.
- Regularly review your cancellation policy against competitors and market demand shifts in Helmdon.
Helmdon STR Booking Lead Time Analysis (2026)
Average Booking Lead Time by Month
Booking Lead Time Insights for Helmdon
- The overall average booking lead time for vacation rentals in Helmdon is 78 days.
- Guests book furthest in advance for stays during July (average 115 days), likely coinciding with peak travel demand or local events.
- The shortest booking windows occur for stays in February (average 14 days), indicating more last-minute travel plans during this time.
- Seasonally, Summer (91 days avg.) sees the longest lead times, while Winter (28 days avg.) has the shortest, reflecting typical travel planning cycles.
Recommendations for Hosts
- Use the overall average lead time (78 days) as a baseline for your pricing and availability strategy in Helmdon.
- For July stays, consider implementing length-of-stay discounts or slightly higher rates for bookings made less than 115 days out to capitalize on advance planning.
- During February, focus on last-minute booking availability and promotions, as guests book with very short notice (14 days avg.).
- Target marketing efforts for the Summer season well in advance (at least 91 days) to capture early planners.
- Monitor your own booking lead times against these Helmdon averages to identify opportunities for dynamic pricing adjustments.
Popular & Essential Airbnb Amenities in Helmdon (2026)
Amenity Prevalence
Amenity Insights for Helmdon
- Essential amenities in Helmdon that guests expect include: Wifi. Lacking these (this) could significantly impact bookings.
- Popular amenities like Free parking on premises, Smoke alarm, Kitchen are common but not universal. Offering these can provide a competitive edge.
Recommendations for Hosts
- Ensure your listing includes all essential amenities for Helmdon: Wifi.
- Consider adding popular differentiators like Free parking on premises or Smoke alarm to increase appeal.
- Highlight unique or less common amenities you offer (e.g., hot tub, dedicated workspace, EV charger) in your listing description and photos.
- Regularly check competitor amenities in Helmdon to stay competitive.
Helmdon Airbnb Guest Demographics & Profile Analysis (2026)
Guest Profile Summary for Helmdon
- The typical guest profile for Airbnb in Helmdon consists of primarily domestic travelers (96%), often arriving from nearby England, typically belonging to the Post-2000s (Gen Z/Alpha) group (50%), primarily speaking English or French.
- Domestic travelers account for 95.7% of guests.
- Key international markets include United Kingdom (95.7%) and Italy (1.1%).
- Top languages spoken are English (75%) followed by French (9.4%).
- A significant demographic segment is the Post-2000s (Gen Z/Alpha) group, representing 50% of guests.
Recommendations for Hosts
- Target domestic marketing efforts towards travelers from England and London.
- Tailor amenities and listing descriptions to appeal to the dominant Post-2000s (Gen Z/Alpha) demographic (e.g., highlight fast WiFi, smart home features, local guides).
- Highlight unique local experiences or amenities relevant to the primary guest profile.
- Consider seasonal promotions aligned with peak travel times for key origin markets.
Nearby Short-Term Rental Market Comparison
How does the Helmdon Airbnb market stack up against its neighbors? Compare key performance metrics like average monthly revenue, ADR, and occupancy rates in surrounding areas to understand the broader regional STR landscape.
| Market | Active Properties | Monthly Revenue | Daily Rate | Avg. Occupancy |
|---|---|---|---|---|
| Dorney | 11 | $7,510 | $743.63 | 39% |
| Chew Magna | 13 | $7,041 | $430.65 | 44% |
| Englishcombe | 15 | $6,734 | $511.35 | 53% |
| Lambourn | 11 | $6,499 | $723.41 | 31% |
| East Knoyle | 10 | $6,300 | $407.06 | 44% |
| Wraysbury | 16 | $6,199 | $530.56 | 49% |
| City of Westminster | 1,424 | $6,053 | $515.72 | 50% |
| Long Sutton | 18 | $6,029 | $383.58 | 46% |
| Withington | 10 | $5,690 | $499.79 | 44% |
| Ashley | 13 | $5,497 | $364.68 | 54% |