Hutton-le-Hole Airbnb Market Analysis 2025: Short Term Rental Data & Vacation Rental Statistics in England, United Kingdom
Is Airbnb profitable in Hutton-le-Hole in 2025? Explore comprehensive Airbnb analytics for Hutton-le-Hole, England, United Kingdom to uncover income potential. This 2025 STR market report for Hutton-le-Hole, based on AirROI data from July 2024 to June 2025, reveals key trends in the niche market of 19 active listings.
Whether you're considering an Airbnb investment in Hutton-le-Hole, optimizing your existing vacation rental, or exploring rental arbitrage opportunities, understanding the Hutton-le-Hole Airbnb data is crucial. Leveraging the low regulation environment is key to maximizing your short term rental income potential. Let's dive into the specifics.
Key Hutton-le-Hole Airbnb Performance Metrics Overview
Monthly Airbnb Revenue Variations & Income Potential in Hutton-le-Hole (2025)
Understanding the monthly revenue variations for Airbnb listings in Hutton-le-Hole is key to maximizing your short term rental income potential. Seasonality significantly impacts earnings. Our analysis, based on data from the past 12 months, shows that the peak revenue month for STRs in Hutton-le-Hole is typically December, while January often presents the lowest earnings, highlighting opportunities for strategic pricing adjustments during shoulder and low seasons. Explore the typical Airbnb income in Hutton-le-Hole across different performance tiers:
- Best-in-class properties (Top 10%) achieve $5,258+ monthly, often utilizing dynamic pricing and superior guest experiences.
- Strong performing properties (Top 25%) earn $2,729 or more, indicating effective management and desirable locations/amenities.
- Typical properties (Median) generate around $2,029 per month, representing the average market performance.
- Entry-level properties (Bottom 25%) see earnings around $1,163, often with potential for optimization.
Average Monthly Airbnb Earnings Trend in Hutton-le-Hole
Hutton-le-Hole Airbnb Occupancy Rate Trends (2025)
Maximize your bookings by understanding the Hutton-le-Hole STR occupancy trends. Seasonal demand shifts significantly influence how often properties are booked. Typically, Augustsees the highest demand (peak season occupancy), while January experiences the lowest (low season). Effective strategies, like adjusting minimum stays or offering promotions, can boost occupancy during slower periods. Here's how different property tiers perform in Hutton-le-Hole:
- Best-in-class properties (Top 10%) achieve 62%+ occupancy, indicating high desirability and potentially optimized availability.
- Strong performing properties (Top 25%) maintain 50% or higher occupancy, suggesting good market fit and guest satisfaction.
- Typical properties (Median) have an occupancy rate around 31%.
- Entry-level properties (Bottom 25%) average 19% occupancy, potentially facing higher vacancy.
Average Monthly Occupancy Rate Trend in Hutton-le-Hole
Average Daily Rate (ADR) Airbnb Trends in Hutton-le-Hole (2025)
Effective short term rental pricing strategy in Hutton-le-Hole involves understanding monthly ADR fluctuations. The Average Daily Rate (ADR) for Airbnb in Hutton-le-Hole typically peaks in June and dips lowest during March. Leveraging Airbnb dynamic pricing tools or strategies based on this seasonality can significantly boost revenue. Here's a look at the typical nightly rates achieved:
- Best-in-class properties (Top 10%) command rates of $750+ per night, often due to premium features or locations.
- Strong performing properties (Top 25%) achieve nightly rates of $278 or more.
- Typical properties (Median) charge around $169 per night.
- Entry-level properties (Bottom 25%) earn around $138 per night.
Average Daily Rate (ADR) Trend by Month in Hutton-le-Hole
Get Live Hutton-le-Hole Market Intelligence 👇

Explore Real-time Analytics
Airbnb Seasonality Analysis & Trends in Hutton-le-Hole (2025)
Peak Season (December, June, August)
- Revenue averages $3,136 per month
- Occupancy rates average 39.0%
- Daily rates average $280
Shoulder Season
- Revenue averages $2,494 per month
- Occupancy maintains around 40.9%
- Daily rates hold near $277
Low Season (January, February, November)
- Revenue drops to average $1,264 per month
- Occupancy decreases to average 22.7%
- Daily rates adjust to average $278
Seasonality Insights for Hutton-le-Hole
- The Airbnb seasonality in Hutton-le-Hole shows highly seasonal trends requiring careful strategy. While the sections above show seasonal averages, it's also insightful to look at the extremes:
- During the high season, the absolute peak month showcases Hutton-le-Hole's highest earning potential, with monthly revenues capable of climbing to $3,215, occupancy reaching a high of 48.4%, and ADRs peaking at $286.
- Conversely, the slowest single month of the year, typically falling within the low season, marks the market's lowest point. In this month, revenue might dip to $819, occupancy could drop to 14.3%, and ADRs may adjust down to $271.
- Understanding both the seasonal averages and these monthly peaks and troughs in revenue, occupancy, and ADR is crucial for maximizing your Airbnb profit potential in Hutton-le-Hole.
Seasonal Strategies for Maximizing Profit
- Peak Season: Maximize revenue through premium pricing and potentially longer minimum stays. Ensure high availability.
- Low Season: Offer competitive pricing, special promotions (e.g., extended stay discounts), and flexible cancellation policies. Target off-season travelers like remote workers or budget-conscious guests.
- Shoulder Seasons: Implement dynamic pricing that balances peak and low rates. Target weekend travelers or specific events. Offer slightly more flexible terms than peak season.
- Regularly analyze your own performance against these Hutton-le-Hole seasonality benchmarks and adjust your pricing and availability strategy accordingly.
Best Areas for Airbnb Investment in Hutton-le-Hole (2025)
Exploring the top neighborhoods for short-term rentals in Hutton-le-Hole? This section highlights key areas, outlining why they are attractive for hosts and guests, along with notable local attractions. Consider these locations based on your target guest profile and investment strategy.
| Neighborhood / Area | Why Host Here? (Target Guests & Appeal) | Key Attractions & Landmarks |
|---|---|---|
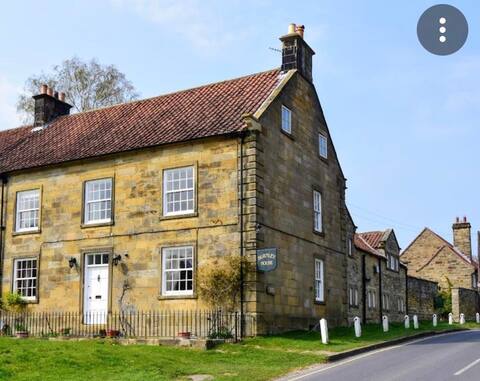
| Hutton-le-Hole Village | Charming village known for its picturesque scenery and traditional Yorkshire charm. Ideal for visitors looking for a peaceful getaway while being close to nature and hiking trails. | Hutton-le-Hole Village Museum, The Ryedale Folk Museum, Hiking trails in the North York Moors, Nearby historic market towns, Scenic views and countryside walks |
| North York Moors National Park | Stunning national park famous for its natural beauty, hiking, and wildlife. Perfect for outdoor enthusiasts and families seeking adventure and exploration. | Moors Center, The Hole of Horcum, Roseberry Topping, Whitby Abbey, Scenic drives and trails |
| Helmsley | A market town with historic charm and a vibrant community feel. Attracts visitors for its shops, cafes, and proximity to local attractions. | Helmsley Castle, Duncombe Park, Helmsley Walled Garden, Rievaulx Abbey, Local pubs and restaurants |
| Pickering | Market town known as the gateway to the North York Moors and the start of the North Yorkshire Moors Railway. Great for families and rail enthusiasts. | Pickering Castle, North Yorkshire Moors Railway, Beck Isle Museum, Nearby forests and trails, Shopping and dining options |
| Malton | Regarded as the food capital of Yorkshire, known for its excellent dining options and culinary events. A great stop for food lovers visiting the area. | Malton Food Market, Eden Camp Museum, Local eateries and food festivals, Shopping in the historic market, Scenic countryside |
| York | Historic city with famous attractions and rich history. Ideal for tourists looking to explore medieval architecture and cultural heritage. | York Minster, The Shambles, York Castle Museum, National Railway Museum, York city walls |
| Scarborough | Coastal town known for its beaches, amusement parks, and seafront entertainment. Popular destination for families and beachgoers. | Scarborough Beach, Scarborough Castle, Peasholm Park, The Sea Life Sanctuary, Amusement arcades and piers |
| Whitby | Coastal town famous for its connections to Dracula and its scenic coastline. Great for tourists interested in history and the sea. | Whitby Abbey, Robin Hood's Bay, Whitby Beach, Whitby Harbour, Local seafood restaurants |
Understanding Airbnb License Requirements & STR Laws in Hutton-le-Hole (2025)
While Hutton-le-Hole, England, United Kingdom currently shows low STR regulations, specific Airbnb license requirements might still exist or change. Always verify the latest short term rental regulations and Airbnb license requirements directly with local government authorities for Hutton-le-Hole to ensure full compliance before hosting.
(Source: AirROI data, 2025, finding no licensed listings among those analyzed)
Top Performing Airbnb Properties in Hutton-le-Hole (2025)
Benchmark your potential! Explore examples of top-performing Airbnb properties in Hutton-le-Holebased on Trailing Twelve Month (TTM) revenue. Analyze their characteristics, revenue, occupancy rate, and ADR to understand what drives success in this market.
Grade II listed - Sleeps up to14
Entire Place • 7 bedrooms

Host & Stay | Greengate Cottage
Entire Place • 4 bedrooms
Grade II Listed-North York Moors
Entire Place • 7 bedrooms
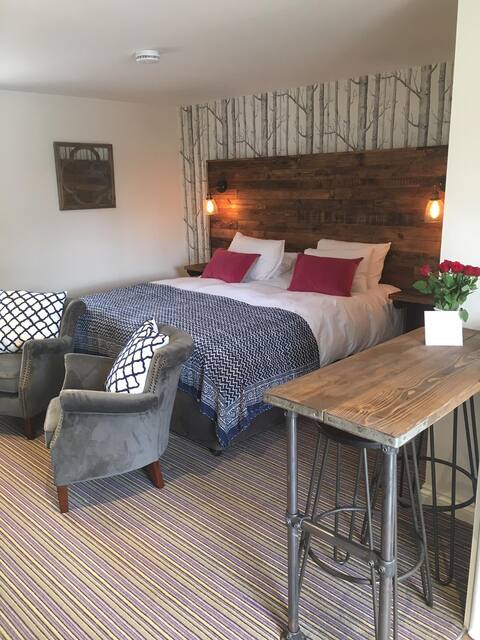
Double bed ensuite, kitchen, terrace (dog friendly)
Entire Place • 1 bedroom
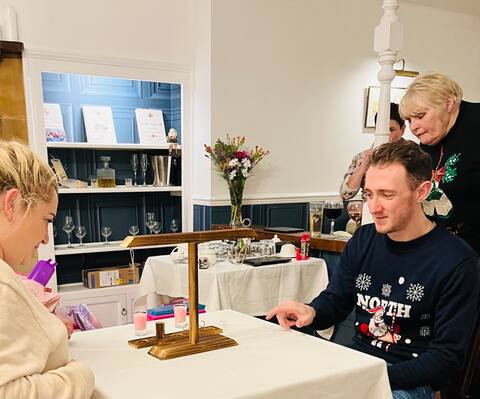
Burnley Country House - Breakfast Included
Private Room • 1 bedroom

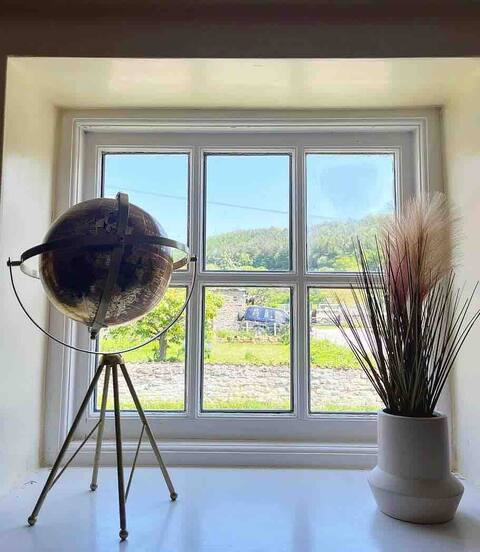
Flat A, The Green, Hutton-le-Hole - N York Moors.
Entire Place • 2 bedrooms
Note: Performance varies based on location, size, amenities, seasonality, and management quality. Data reflects the past 12 months.
Top Performing Airbnb Hosts in Hutton-le-Hole (2025)
Learn from the best! This table showcases top-performing Airbnb hosts in Hutton-le-Hole based on the number of properties managed and estimated total revenue over the past year. Analyze their scale and performance metrics.
| Host Name | Properties | Grossing Revenue | Stay Reviews | Avg Rating |
|---|---|---|---|---|
| Rachael Louise | 6 | $181,023 | 37 | 4.91/5.0 |
| Richard | 3 | $48,749 | 130 | 4.80/5.0 |
| Dale | 1 | $47,147 | 63 | 4.46/5.0 |
| Keith | 3 | $45,216 | 139 | 4.82/5.0 |
| Ingrid Flute'S Yorks Hol Cotta | 2 | $34,175 | 4 | 5.00/5.0 |
| Host & Stay | 2 | $29,341 | 32 | 4.53/5.0 |
| Holly | 1 | $11,241 | 65 | 4.83/5.0 |
| Glyn | 1 | $4,483 | 63 | 4.79/5.0 |
Analyzing the strategies of top hosts, such as their property selection, pricing, and guest communication, can offer valuable lessons for optimizing your own Airbnb operations in Hutton-le-Hole.
Dive Deeper: Advanced Hutton-le-Hole STR Market Data (2025)
Ready to unlock more insights? AirROI provides access to advanced metrics and comprehensive Airbnb data for Hutton-le-Hole. Explore detailed analytics beyond this report to refine your investment strategy, optimize pricing, and maximize your vacation rental profits.
Explore Advanced MetricsHutton-le-Hole Short-Term Rental Market Composition (2025): Property & Room Types
Room Type Distribution
Property Type Distribution
Market Composition Insights for Hutton-le-Hole
- The Hutton-le-Hole Airbnb market composition is heavily skewed towards Entire Home/Apt listings, which make up 78.9% of the 19 active rentals. This indicates strong guest preference for privacy and space.
- Looking at the property type distribution in Hutton-le-Hole, House properties are the most common (42.1%), reflecting the local real estate landscape.
- Houses represent a significant 42.1% portion, catering likely to families or larger groups.
- The presence of 21.1% Hotel/Boutique listings indicates integration with traditional hospitality.
Hutton-le-Hole Airbnb Room Capacity Analysis (2025): Bedroom Distribution
Distribution of Listings by Number of Bedrooms
Room Capacity Insights for Hutton-le-Hole
- The dominant room capacity in Hutton-le-Hole is 1 bedroom listings, making up 31.6% of the market. This suggests a strong demand for properties suitable for couples or solo travelers.
- Together, 1 bedroom and 2 bedrooms properties represent 57.9% of the active Airbnb listings in Hutton-le-Hole, indicating a high concentration in these sizes.
- A significant 26.3% of listings offer 3+ bedrooms, catering to larger groups and families seeking more space in Hutton-le-Hole.
Hutton-le-Hole Vacation Rental Guest Capacity Trends (2025)
Distribution of Listings by Guest Capacity
Guest Capacity Insights for Hutton-le-Hole
- The most common guest capacity trend in Hutton-le-Hole vacation rentals is listings accommodating 4 guests (31.6%). This suggests the primary traveler segment is likely small families or groups.
- Properties designed for 4 guests and 2 guests dominate the Hutton-le-Hole STR market, accounting for 63.2% of listings.
- 21.1% of properties accommodate 6+ guests, serving the market segment for larger families or group travel in Hutton-le-Hole.
- On average, properties in Hutton-le-Hole are equipped to host 3.5 guests.
Hutton-le-Hole Airbnb Booking Patterns (2025): Available vs. Booked Days
Available Days Distribution
Booked Days Distribution
Booking Pattern Insights for Hutton-le-Hole
- The most common availability pattern in Hutton-le-Hole falls within the 271-366 days range, representing 57.9% of listings. This suggests many properties have significant open periods on their calendars.
- Approximately 89.5% of listings show high availability (181+ days open annually), indicating potential for increased bookings or specific owner usage patterns.
- For booked days, the 31-90 days range is most frequent in Hutton-le-Hole (47.4%), reflecting common guest stay durations or potential owner blocking patterns.
- A notable 15.8% of properties secure long booking periods (181+ days booked per year), highlighting successful long-term rental strategies or significant owner usage.
Hutton-le-Hole Airbnb Minimum Stay Requirements Analysis
Distribution of Listings by Minimum Night Requirement
1 Night
7 listings
41.2% of total
2 Nights
3 listings
17.6% of total
3 Nights
3 listings
17.6% of total
4-6 Nights
1 listings
5.9% of total
30+ Nights
3 listings
17.6% of total
Key Insights
- The most prevalent minimum stay requirement in Hutton-le-Hole is 1 Night, adopted by 41.2% of listings. This highlights the market's preference for shorter, flexible bookings.
- A significant segment (17.6%) caters to monthly stays (30+ nights) in Hutton-le-Hole, pointing to opportunities in the extended-stay market.
Recommendations
- Align with the market by considering a 1 Night minimum stay, as 41.2% of Hutton-le-Hole hosts use this setting.
- Explore offering discounts for stays of 30+ nights to attract the 17.6% of the market seeking extended stays.
- Adjust minimum nights based on seasonality – potentially shorter during low season and longer during peak demand periods in Hutton-le-Hole.
Hutton-le-Hole Airbnb Cancellation Policy Trends Analysis (2025)
Refundable
3 listings
16.7% of total
Super Strict 60 Days
2 listings
11.1% of total
Flexible
6 listings
33.3% of total
Firm
3 listings
16.7% of total
Strict
4 listings
22.2% of total
Cancellation Policy Insights for Hutton-le-Hole
- The prevailing Airbnb cancellation policy trend in Hutton-le-Hole is Flexible, used by 33.3% of listings.
- There's a relatively balanced mix between guest-friendly (33.3%) and stricter (38.9%) policies, offering choices for different guest needs.
Recommendations for Hosts
- Consider adopting a Flexible policy to align with the 33.3% market standard in Hutton-le-Hole.
- Regularly review your cancellation policy against competitors and market demand shifts in Hutton-le-Hole.
Hutton-le-Hole STR Booking Lead Time Analysis (2025)
Average Booking Lead Time by Month
Booking Lead Time Insights for Hutton-le-Hole
- The overall average booking lead time for vacation rentals in Hutton-le-Hole is 70 days.
- Guests book furthest in advance for stays during August (average 98 days), likely coinciding with peak travel demand or local events.
- The shortest booking windows occur for stays in February (average 32 days), indicating more last-minute travel plans during this time.
- Seasonally, Spring (81 days avg.) sees the longest lead times, while Winter (56 days avg.) has the shortest, reflecting typical travel planning cycles.
Recommendations for Hosts
- Use the overall average lead time (70 days) as a baseline for your pricing and availability strategy in Hutton-le-Hole.
- For August stays, consider implementing length-of-stay discounts or slightly higher rates for bookings made less than 98 days out to capitalize on advance planning.
- Target marketing efforts for the Spring season well in advance (at least 81 days) to capture early planners.
- Monitor your own booking lead times against these Hutton-le-Hole averages to identify opportunities for dynamic pricing adjustments.
Popular & Essential Airbnb Amenities in Hutton-le-Hole (2025)
Amenity data is currently unavailable for Hutton-le-Hole.
Hutton-le-Hole Airbnb Guest Demographics & Profile Analysis (2025)
Guest Profile Summary for Hutton-le-Hole
- The typical guest profile for Airbnb in Hutton-le-Hole consists of primarily domestic travelers (89%), often arriving from nearby England, typically belonging to the Post-2000s (Gen Z/Alpha) group (50%), primarily speaking English or Dutch.
- Domestic travelers account for 88.7% of guests.
- Key international markets include United Kingdom (88.7%) and Australia (4.2%).
- Top languages spoken are English (87%) followed by Dutch (4.3%).
- A significant demographic segment is the Post-2000s (Gen Z/Alpha) group, representing 50% of guests.
Recommendations for Hosts
- Target domestic marketing efforts towards travelers from England and York.
- Tailor amenities and listing descriptions to appeal to the dominant Post-2000s (Gen Z/Alpha) demographic (e.g., highlight fast WiFi, smart home features, local guides).
- Highlight unique local experiences or amenities relevant to the primary guest profile.
- Consider seasonal promotions aligned with peak travel times for key origin markets.
Nearby Short-Term Rental Market Comparison
How does the Hutton-le-Hole Airbnb market stack up against its neighbors? Compare key performance metrics like average monthly revenue, ADR, and occupancy rates in surrounding areas to understand the broader regional STR landscape.
| Market | Active Properties | Monthly Revenue | Daily Rate | Avg. Occupancy |
|---|---|---|---|---|
| Grinton | 14 | $4,879 | $341.89 | 48% |
| Appleby | 10 | $4,764 | $357.50 | 44% |
| Bishop Monkton | 11 | $4,759 | $304.91 | 51% |
| Ellingham | 11 | $4,329 | $276.63 | 63% |
| Escrick | 12 | $3,827 | $332.04 | 43% |
| Holy Island | 13 | $3,698 | $275.79 | 57% |
| Stamford Bridge | 15 | $3,676 | $364.63 | 35% |
| High Newton by the Sea | 20 | $3,455 | $449.02 | 36% |
| Blubberhouses | 11 | $3,419 | $377.02 | 39% |
| Brandesburton | 14 | $3,353 | $318.84 | 38% |