Kirkby Malzeard Airbnb Market Analysis 2026: Short Term Rental Data & Vacation Rental Statistics in England, United Kingdom
Is Airbnb profitable in Kirkby Malzeard in 2026? Explore comprehensive Airbnb analytics for Kirkby Malzeard, England, United Kingdom to uncover income potential. This 2026 STR market report for Kirkby Malzeard, based on AirROI data from February 2025 to January 2026, reveals key trends in the niche market of 18 active listings.
Whether you're considering an Airbnb investment in Kirkby Malzeard, optimizing your existing vacation rental, or exploring rental arbitrage opportunities, understanding the Kirkby Malzeard Airbnb data is crucial. Leveraging the low regulation environment is key to maximizing your short term rental income potential. Let's dive into the specifics.
Key Kirkby Malzeard Airbnb Performance Metrics Overview
Monthly Airbnb Revenue Variations & Income Potential in Kirkby Malzeard (2026)
Understanding the monthly revenue variations for Airbnb listings in Kirkby Malzeard is key to maximizing your short term rental income potential. Seasonality significantly impacts earnings. Our analysis, based on data from the past 12 months, shows that the peak revenue month for STRs in Kirkby Malzeard is typically August, while November often presents the lowest earnings, highlighting opportunities for strategic pricing adjustments during shoulder and low seasons. Explore the typical Airbnb income in Kirkby Malzeard across different performance tiers:
- Best-in-class properties (Top 10%) achieve $7,346+ monthly, often utilizing dynamic pricing and superior guest experiences.
- Strong performing properties (Top 25%) earn $4,725 or more, indicating effective management and desirable locations/amenities.
- Typical properties (Median) generate around $3,048 per month, representing the average market performance.
- Entry-level properties (Bottom 25%) see earnings around $1,875, often with potential for optimization.
Average Monthly Airbnb Earnings Trend in Kirkby Malzeard
Kirkby Malzeard Airbnb Occupancy Rate Trends (2026)
Maximize your bookings by understanding the Kirkby Malzeard STR occupancy trends. Seasonal demand shifts significantly influence how often properties are booked. Typically, Octobersees the highest demand (peak season occupancy), while November experiences the lowest (low season). Effective strategies, like adjusting minimum stays or offering promotions, can boost occupancy during slower periods. Here's how different property tiers perform in Kirkby Malzeard:
- Best-in-class properties (Top 10%) achieve 83%+ occupancy, indicating high desirability and potentially optimized availability.
- Strong performing properties (Top 25%) maintain 72% or higher occupancy, suggesting good market fit and guest satisfaction.
- Typical properties (Median) have an occupancy rate around 51%.
- Entry-level properties (Bottom 25%) average 31% occupancy, potentially facing higher vacancy.
Average Monthly Occupancy Rate Trend in Kirkby Malzeard
Average Daily Rate (ADR) Airbnb Trends in Kirkby Malzeard (2026)
Effective short term rental pricing strategy in Kirkby Malzeard involves understanding monthly ADR fluctuations. The Average Daily Rate (ADR) for Airbnb in Kirkby Malzeard typically peaks in August and dips lowest during March. Leveraging Airbnb dynamic pricing tools or strategies based on this seasonality can significantly boost revenue. Here's a look at the typical nightly rates achieved:
- Best-in-class properties (Top 10%) command rates of $659+ per night, often due to premium features or locations.
- Strong performing properties (Top 25%) achieve nightly rates of $302 or more.
- Typical properties (Median) charge around $182 per night.
- Entry-level properties (Bottom 25%) earn around $128 per night.
Average Daily Rate (ADR) Trend by Month in Kirkby Malzeard
Get Live Kirkby Malzeard Market Intelligence 👇

Explore Real-time Analytics
Airbnb Seasonality Analysis & Trends in Kirkby Malzeard (2026)
Peak Season (August, October, March)
- Revenue averages $4,881 per month
- Occupancy rates average 60.2%
- Daily rates average $275
Shoulder Season
- Revenue averages $3,673 per month
- Occupancy maintains around 49.8%
- Daily rates hold near $275
Low Season (January, May, November)
- Revenue drops to average $2,958 per month
- Occupancy decreases to average 47.3%
- Daily rates adjust to average $266
Seasonality Insights for Kirkby Malzeard
- The Airbnb seasonality in Kirkby Malzeard shows moderate seasonality with distinct peak and low periods. While the sections above show seasonal averages, it's also insightful to look at the extremes:
- During the high season, the absolute peak month showcases Kirkby Malzeard's highest earning potential, with monthly revenues capable of climbing to $5,334, occupancy reaching a high of 63.4%, and ADRs peaking at $317.
- Conversely, the slowest single month of the year, typically falling within the low season, marks the market's lowest point. In this month, revenue might dip to $2,723, occupancy could drop to 38.9%, and ADRs may adjust down to $236.
- Understanding both the seasonal averages and these monthly peaks and troughs in revenue, occupancy, and ADR is crucial for maximizing your Airbnb profit potential in Kirkby Malzeard.
Seasonal Strategies for Maximizing Profit
- Peak Season: Maximize revenue through premium pricing and potentially longer minimum stays. Ensure high availability.
- Low Season: Offer competitive pricing, special promotions (e.g., extended stay discounts), and flexible cancellation policies. Target off-season travelers like remote workers or budget-conscious guests.
- Shoulder Seasons: Implement dynamic pricing that balances peak and low rates. Target weekend travelers or specific events. Offer slightly more flexible terms than peak season.
- Regularly analyze your own performance against these Kirkby Malzeard seasonality benchmarks and adjust your pricing and availability strategy accordingly.
Best Areas for Airbnb Investment in Kirkby Malzeard (2026)
Exploring the top neighborhoods for short-term rentals in Kirkby Malzeard? This section highlights key areas, outlining why they are attractive for hosts and guests, along with notable local attractions. Consider these locations based on your target guest profile and investment strategy.
| Neighborhood / Area | Why Host Here? (Target Guests & Appeal) | Key Attractions & Landmarks |
|---|---|---|
| Kirkby Malzeard Village Center | The village center offers convenient amenities, local shops, and a picturesque environment, attracting tourists interested in local culture and community life. | St. Andrew's Church, local pubs, Kirkby Malzeard Market, community events |
| Nearby Nidderdale Area of Outstanding Natural Beauty | This designated area is perfect for nature lovers and hikers, known for its stunning landscapes, making it a prime location for visitors looking to explore the outdoors. | Nidderdale Way, Brimham Rocks, Fountains Abbey, Studley Royal Water Garden |
| Ripon | Just a short drive away, Ripon is a historical city with a vibrant market and attractions that draw visitors, making it an ideal base for exploring the region. | Ripon Cathedral, Ripon Market Square, The Prison and Police Museum, Newby Hall and Gardens |
| Yorkshire Dales National Park | Famous for its beautiful scenery, the Yorkshire Dales attract many visitors for hiking, cycling, and enjoying the rural landscape, ideal for long-term stays in an Airbnb. | Malham Cove, Ingleton Waterfalls Trail, Grassington, Hawes |
| Masham | A charming market town known for its breweries and vibrant arts scene, attracting visitors who enjoy local drinks and rural charm. | Black Sheep Brewery, Theakston Brewery, Masham Market, surrounding countryside |
| Thirsk | A picturesque market town with rich history and strong connection to James Herriot, appealing to visitors interested in literature and local stories, as well as amenities. | World of James Herriot, Thirsk Market Square, Thirsk Museum |
| Please Hall | A tranquil area ideal for a peaceful retreat, offering stunning views and a connection to nature, perfect for those looking for a relaxing getaway. | Scenic walking trails, local farms, nature observation |
| Leeds City Centre | Although a bit further, Leeds offers a vibrant urban experience with shopping, dining, and culture, making it a draw for visitors seeking an urban escape. | Royal Armouries Museum, Leeds Art Gallery, Corn Exchange, Victoria Quarter |
Understanding Airbnb License Requirements & STR Laws in Kirkby Malzeard (2026)
While Kirkby Malzeard, England, United Kingdom currently shows low STR regulations, specific Airbnb license requirements might still exist or change. Always verify the latest short term rental regulations and Airbnb license requirements directly with local government authorities for Kirkby Malzeard to ensure full compliance before hosting.
(Source: AirROI data, 2026, finding no licensed listings among those analyzed)
Top Performing Airbnb Properties in Kirkby Malzeard (2026)
Benchmark your potential! Explore examples of top-performing Airbnb properties in Kirkby Malzeardbased on Trailing Twelve Month (TTM) revenue. Analyze their characteristics, revenue, occupancy rate, and ADR to understand what drives success in this market.
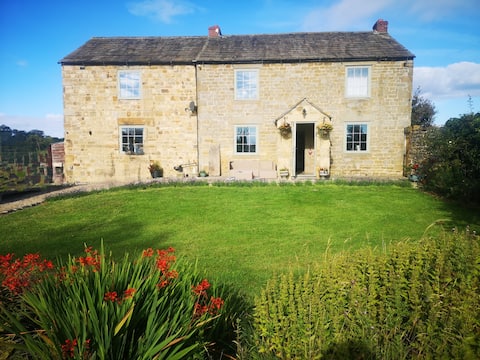
5 bedroom Farm House
Entire Place • 5 bedrooms
Intake, Kirkby Malzeard, Ripon, Yorkshire
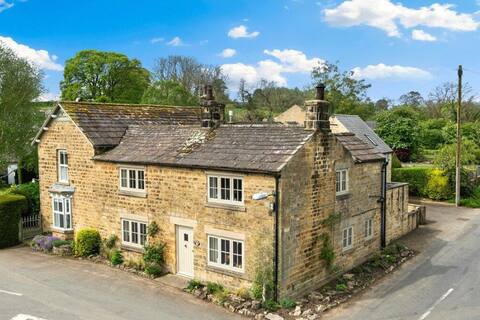
Entire Place • 4 bedrooms
4 Bed in Grewelthorpe (64329)
Entire Place • 4 bedrooms
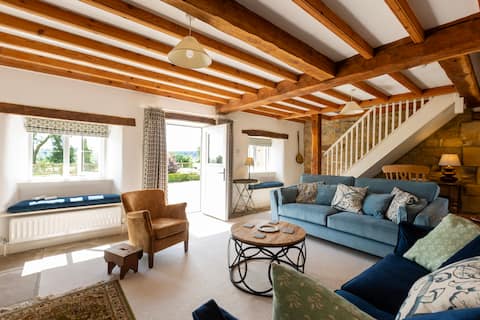
Luxury Period Cottage w/Garden in Kirkby Malzeard
Entire Place • 4 bedrooms
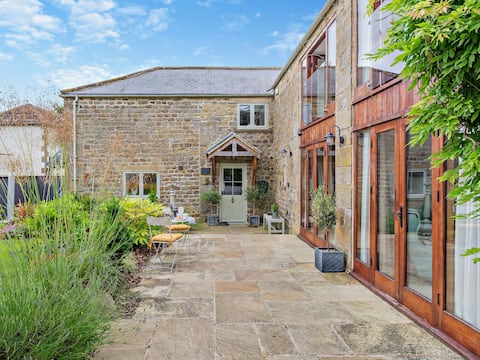
The Old Cowbyre - village location
Entire Place • 2 bedrooms
Thump Cottage - Gateway to the Dales!
Entire Place • 1 bedroom
Note: Performance varies based on location, size, amenities, seasonality, and management quality. Data reflects the past 12 months.
Top Performing Airbnb Hosts in Kirkby Malzeard (2026)
Learn from the best! This table showcases top-performing Airbnb hosts in Kirkby Malzeard based on the number of properties managed and estimated total revenue over the past year. Analyze their scale and performance metrics.
| Host Name | Properties | Grossing Revenue | Stay Reviews | Avg Rating |
|---|---|---|---|---|
| Clayton | 1 | $96,095 | 74 | 4.76/5.0 |
| Yorkshire Escapes | 1 | $63,023 | 31 | 5.00/5.0 |
| Holidaycottages.Co.Uk | 1 | $57,817 | 2 | Not Rated |
| Sally | 1 | $51,540 | 25 | 5.00/5.0 |
| Ilona | 1 | $36,339 | 55 | 5.00/5.0 |
| David | 1 | $33,782 | 356 | 4.99/5.0 |
| Cottages | 1 | $29,361 | 31 | 4.74/5.0 |
| Kelly | 1 | $28,577 | 37 | 4.92/5.0 |
| Fiona | 1 | $25,386 | 271 | 4.99/5.0 |
| Ingrid Flute'S Yorks Hol Cotta | 1 | $24,556 | 0 | Not Rated |
Analyzing the strategies of top hosts, such as their property selection, pricing, and guest communication, can offer valuable lessons for optimizing your own Airbnb operations in Kirkby Malzeard.
Dive Deeper: Advanced Kirkby Malzeard STR Market Data (2026)
Ready to unlock more insights? AirROI provides access to advanced metrics and comprehensive Airbnb data for Kirkby Malzeard. Explore detailed analytics beyond this report to refine your investment strategy, optimize pricing, and maximize your vacation rental profits.
Explore Advanced MetricsKirkby Malzeard Short-Term Rental Market Composition (2026): Property & Room Types
Room Type Distribution
Property Type Distribution
Market Composition Insights for Kirkby Malzeard
- The Kirkby Malzeard Airbnb market composition is heavily skewed towards Entire Home/Apt listings, which make up 100% of the 18 active rentals. This indicates strong guest preference for privacy and space.
- Looking at the property type distribution in Kirkby Malzeard, House properties are the most common (72.2%), reflecting the local real estate landscape.
- Houses represent a significant 72.2% portion, catering likely to families or larger groups.
Kirkby Malzeard Airbnb Room Capacity Analysis (2026): Bedroom Distribution
Distribution of Listings by Number of Bedrooms
Room Capacity Insights for Kirkby Malzeard
- The dominant room capacity in Kirkby Malzeard is 1 bedroom listings, making up 44.4% of the market. This suggests a strong demand for properties suitable for couples or solo travelers.
- Together, 1 bedroom and 2 bedrooms properties represent 77.7% of the active Airbnb listings in Kirkby Malzeard, indicating a high concentration in these sizes.
- A significant 22.3% of listings offer 3+ bedrooms, catering to larger groups and families seeking more space in Kirkby Malzeard.
Kirkby Malzeard Vacation Rental Guest Capacity Trends (2026)
Distribution of Listings by Guest Capacity
Guest Capacity Insights for Kirkby Malzeard
- The most common guest capacity trend in Kirkby Malzeard vacation rentals is listings accommodating 2 guests (38.9%). This suggests the primary traveler segment is likely couples or solo travelers.
- Properties designed for 2 guests and 4 guests dominate the Kirkby Malzeard STR market, accounting for 66.7% of listings.
- 22.3% of properties accommodate 6+ guests, serving the market segment for larger families or group travel in Kirkby Malzeard.
- On average, properties in Kirkby Malzeard are equipped to host 3.9 guests.
Kirkby Malzeard Airbnb Booking Patterns (2026): Available vs. Booked Days
Available Days Distribution
Booked Days Distribution
Booking Pattern Insights for Kirkby Malzeard
- The most common availability pattern in Kirkby Malzeard falls within the 271-366 days range, representing 55.6% of listings. This suggests many properties have significant open periods on their calendars.
- Approximately 66.7% of listings show high availability (181+ days open annually), indicating potential for increased bookings or specific owner usage patterns.
- For booked days, the 181-270 days range is most frequent in Kirkby Malzeard (33.3%), reflecting common guest stay durations or potential owner blocking patterns.
- A notable 33.3% of properties secure long booking periods (181+ days booked per year), highlighting successful long-term rental strategies or significant owner usage.
Kirkby Malzeard Airbnb Minimum Stay Requirements Analysis
Distribution of Listings by Minimum Night Requirement
1 Night
3 listings
16.7% of total
2 Nights
4 listings
22.2% of total
3 Nights
1 listings
5.6% of total
4-6 Nights
3 listings
16.7% of total
30+ Nights
7 listings
38.9% of total
Key Insights
- The most prevalent minimum stay requirement in Kirkby Malzeard is 30+ Nights, adopted by 38.9% of listings. This highlights the market's preference for longer commitments.
- A significant segment (38.9%) caters to monthly stays (30+ nights) in Kirkby Malzeard, pointing to opportunities in the extended-stay market.
Recommendations
- Align with the market by considering a 30+ Nights minimum stay, as 38.9% of Kirkby Malzeard hosts use this setting.
- If feasible, allowing 1-night stays, especially midweek or during low season, could capture last-minute bookings, as only 16.7% currently do.
- Explore offering discounts for stays of 30+ nights to attract the 38.9% of the market seeking extended stays.
- Adjust minimum nights based on seasonality – potentially shorter during low season and longer during peak demand periods in Kirkby Malzeard.
Kirkby Malzeard Airbnb Cancellation Policy Trends Analysis (2026)
Super Strict 60 Days
6 listings
33.3% of total
Super Strict 30 Days
2 listings
11.1% of total
Limited
1 listings
5.6% of total
Flexible
1 listings
5.6% of total
Moderate
3 listings
16.7% of total
Firm
3 listings
16.7% of total
Strict
2 listings
11.1% of total
Cancellation Policy Insights for Kirkby Malzeard
- The prevailing Airbnb cancellation policy trend in Kirkby Malzeard is Super Strict 60 Days, used by 33.3% of listings.
- There's a relatively balanced mix between guest-friendly (22.3%) and stricter (27.8%) policies, offering choices for different guest needs.
Recommendations for Hosts
- Consider adopting a Super Strict 60 Days policy to align with the 33.3% market standard in Kirkby Malzeard.
- Using a Strict policy might deter some guests, as only 11.1% of listings use it. Evaluate if potential revenue protection outweighs possible lower booking rates.
- Regularly review your cancellation policy against competitors and market demand shifts in Kirkby Malzeard.
Kirkby Malzeard STR Booking Lead Time Analysis (2026)
Average Booking Lead Time by Month
Booking Lead Time Insights for Kirkby Malzeard
- The overall average booking lead time for vacation rentals in Kirkby Malzeard is 60 days.
- Guests book furthest in advance for stays during November (average 102 days), likely coinciding with peak travel demand or local events.
- The shortest booking windows occur for stays in February (average 18 days), indicating more last-minute travel plans during this time.
- Seasonally, Fall (84 days avg.) sees the longest lead times, while Winter (42 days avg.) has the shortest, reflecting typical travel planning cycles.
Recommendations for Hosts
- Use the overall average lead time (60 days) as a baseline for your pricing and availability strategy in Kirkby Malzeard.
- For November stays, consider implementing length-of-stay discounts or slightly higher rates for bookings made less than 102 days out to capitalize on advance planning.
- Target marketing efforts for the Fall season well in advance (at least 84 days) to capture early planners.
- Monitor your own booking lead times against these Kirkby Malzeard averages to identify opportunities for dynamic pricing adjustments.
Popular & Essential Airbnb Amenities in Kirkby Malzeard (2026)
Amenity Prevalence
Amenity Insights for Kirkby Malzeard
- Essential amenities in Kirkby Malzeard that guests expect include: Heating, Kitchen, Wifi, Smoke alarm, TV. Lacking these (any) could significantly impact bookings.
- Popular amenities like Hot water, Washer, Refrigerator are common but not universal. Offering these can provide a competitive edge.
Recommendations for Hosts
- Ensure your listing includes all essential amenities for Kirkby Malzeard: Heating, Kitchen, Wifi, Smoke alarm, TV.
- Consider adding popular differentiators like Hot water or Washer to increase appeal.
- Highlight unique or less common amenities you offer (e.g., hot tub, dedicated workspace, EV charger) in your listing description and photos.
- Regularly check competitor amenities in Kirkby Malzeard to stay competitive.
Kirkby Malzeard Airbnb Guest Demographics & Profile Analysis (2026)
Guest Profile Summary for Kirkby Malzeard
- The typical guest profile for Airbnb in Kirkby Malzeard consists of primarily domestic travelers (91%), often arriving from nearby England, typically belonging to the Post-2000s (Gen Z/Alpha) group (50%), primarily speaking English or French.
- Domestic travelers account for 90.5% of guests.
- Key international markets include United Kingdom (90.5%) and Australia (4.4%).
- Top languages spoken are English (81.3%) followed by French (12.5%).
- A significant demographic segment is the Post-2000s (Gen Z/Alpha) group, representing 50% of guests.
Recommendations for Hosts
- Target domestic marketing efforts towards travelers from England and London.
- Tailor amenities and listing descriptions to appeal to the dominant Post-2000s (Gen Z/Alpha) demographic (e.g., highlight fast WiFi, smart home features, local guides).
- Highlight unique local experiences or amenities relevant to the primary guest profile.
- Consider seasonal promotions aligned with peak travel times for key origin markets.
Nearby Short-Term Rental Market Comparison
How does the Kirkby Malzeard Airbnb market stack up against its neighbors? Compare key performance metrics like average monthly revenue, ADR, and occupancy rates in surrounding areas to understand the broader regional STR landscape.
| Market | Active Properties | Monthly Revenue | Daily Rate | Avg. Occupancy |
|---|---|---|---|---|
| Stamford Bridge | 11 | $4,828 | $418.84 | 39% |
| Cartmel Fell | 23 | $4,560 | $364.59 | 48% |
| Burneside | 10 | $4,526 | $331.60 | 54% |
| Grinton | 12 | $4,363 | $338.85 | 48% |
| Ellingham | 12 | $4,350 | $318.71 | 51% |
| Bowness-on-Windermere | 358 | $4,223 | $357.92 | 45% |
| High Newton by the Sea | 19 | $4,216 | $506.29 | 39% |
| Hayton | 16 | $4,173 | $258.03 | 57% |
| Tollerton | 12 | $4,121 | $303.75 | 52% |
| Holy Island | 14 | $4,102 | $326.39 | 58% |