Leicester Airbnb Market Analysis 2026: Short Term Rental Data & Vacation Rental Statistics in England, United Kingdom
Is Airbnb profitable in Leicester in 2026? Explore comprehensive Airbnb analytics for Leicester, England, United Kingdom to uncover income potential. This 2026 STR market report for Leicester, based on AirROI data from February 2025 to January 2026, reveals key trends in the market of 483 active listings.
Whether you're considering an Airbnb investment in Leicester, optimizing your existing vacation rental, or exploring rental arbitrage opportunities, understanding the Leicester Airbnb data is crucial. Leveraging the low regulation environment is key to maximizing your short term rental income potential. Let's dive into the specifics.
Key Leicester Airbnb Performance Metrics Overview
Monthly Airbnb Revenue Variations & Income Potential in Leicester (2026)
Understanding the monthly revenue variations for Airbnb listings in Leicester is key to maximizing your short term rental income potential. Seasonality significantly impacts earnings. Our analysis, based on data from the past 12 months, shows that the peak revenue month for STRs in Leicester is typically July, while January often presents the lowest earnings, highlighting opportunities for strategic pricing adjustments during shoulder and low seasons. Explore the typical Airbnb income in Leicester across different performance tiers:
- Best-in-class properties (Top 10%) achieve $3,648+ monthly, often utilizing dynamic pricing and superior guest experiences.
- Strong performing properties (Top 25%) earn $2,096 or more, indicating effective management and desirable locations/amenities.
- Typical properties (Median) generate around $1,046 per month, representing the average market performance.
- Entry-level properties (Bottom 25%) see earnings around $422, often with potential for optimization.
Average Monthly Airbnb Earnings Trend in Leicester
Leicester Airbnb Occupancy Rate Trends (2026)
Maximize your bookings by understanding the Leicester STR occupancy trends. Seasonal demand shifts significantly influence how often properties are booked. Typically, Februarysees the highest demand (peak season occupancy), while January experiences the lowest (low season). Effective strategies, like adjusting minimum stays or offering promotions, can boost occupancy during slower periods. Here's how different property tiers perform in Leicester:
- Best-in-class properties (Top 10%) achieve 75%+ occupancy, indicating high desirability and potentially optimized availability.
- Strong performing properties (Top 25%) maintain 56% or higher occupancy, suggesting good market fit and guest satisfaction.
- Typical properties (Median) have an occupancy rate around 31%.
- Entry-level properties (Bottom 25%) average 14% occupancy, potentially facing higher vacancy.
Average Monthly Occupancy Rate Trend in Leicester
Average Daily Rate (ADR) Airbnb Trends in Leicester (2026)
Effective short term rental pricing strategy in Leicester involves understanding monthly ADR fluctuations. The Average Daily Rate (ADR) for Airbnb in Leicester typically peaks in September and dips lowest during February. Leveraging Airbnb dynamic pricing tools or strategies based on this seasonality can significantly boost revenue. Here's a look at the typical nightly rates achieved:
- Best-in-class properties (Top 10%) command rates of $223+ per night, often due to premium features or locations.
- Strong performing properties (Top 25%) achieve nightly rates of $169 or more.
- Typical properties (Median) charge around $115 per night.
- Entry-level properties (Bottom 25%) earn around $68 per night.
Average Daily Rate (ADR) Trend by Month in Leicester
Get Live Leicester Market Intelligence 👇

Explore Real-time Analytics
Airbnb Seasonality Analysis & Trends in Leicester (2026)
Peak Season (July, August, October)
- Revenue averages $1,883 per month
- Occupancy rates average 38.7%
- Daily rates average $140
Shoulder Season
- Revenue averages $1,578 per month
- Occupancy maintains around 38.0%
- Daily rates hold near $133
Low Season (January, May, November)
- Revenue drops to average $1,324 per month
- Occupancy decreases to average 30.4%
- Daily rates adjust to average $135
Seasonality Insights for Leicester
- The Airbnb seasonality in Leicester shows moderate seasonality with distinct peak and low periods. While the sections above show seasonal averages, it's also insightful to look at the extremes:
- During the high season, the absolute peak month showcases Leicester's highest earning potential, with monthly revenues capable of climbing to $1,990, occupancy reaching a high of 42.9%, and ADRs peaking at $142.
- Conversely, the slowest single month of the year, typically falling within the low season, marks the market's lowest point. In this month, revenue might dip to $1,231, occupancy could drop to 28.4%, and ADRs may adjust down to $127.
- Understanding both the seasonal averages and these monthly peaks and troughs in revenue, occupancy, and ADR is crucial for maximizing your Airbnb profit potential in Leicester.
Seasonal Strategies for Maximizing Profit
- Peak Season: Maximize revenue through premium pricing and potentially longer minimum stays. Ensure high availability.
- Low Season: Offer competitive pricing, special promotions (e.g., extended stay discounts), and flexible cancellation policies. Target off-season travelers like remote workers or budget-conscious guests.
- Shoulder Seasons: Implement dynamic pricing that balances peak and low rates. Target weekend travelers or specific events. Offer slightly more flexible terms than peak season.
- Regularly analyze your own performance against these Leicester seasonality benchmarks and adjust your pricing and availability strategy accordingly.
Best Areas for Airbnb Investment in Leicester (2026)
Exploring the top neighborhoods for short-term rentals in Leicester? This section highlights key areas, outlining why they are attractive for hosts and guests, along with notable local attractions. Consider these locations based on your target guest profile and investment strategy.
| Neighborhood / Area | Why Host Here? (Target Guests & Appeal) | Key Attractions & Landmarks |
|---|---|---|
| City Centre | The heart of Leicester, known for its vibrant atmosphere, restaurants, and shopping options. Ideal for tourists who want to be close to attractions and nightlife. | Leicester Cathedral, King Richard III Visitor Centre, Highcross Shopping Centre, Leicester Market, Curve Theatre |
| Stoneygate | A leafy suburb known for its desirable residential areas and proximity to the city centre. It appeals to families and professionals. | Victoria Park, Stoneygate Conservation Area, Local eateries and cafes, Royal Leicester Golf Club |
| Freemens Common | An emerging area popular with young professionals and students, it offers affordable housing and a lively atmosphere. | University of Leicester, De Montfort University, The Curve Theatre, Local pubs and restaurants |
| Oadby | A suburban area with a strong community feel, great schools, and parks. Perfect for family stays and long-term rentals. | Oadby and Wigston Borough Park, University of Leicester Botanic Garden, Local shopping areas |
| Leicester Forest East | Great for those looking for a blend of suburban living with quick access to the city and surrounding areas. Popular with families and commuters. | Foss Park Shopping Centre, Bede Park, Local nature reserves |
| Aylestone | A popular residential area offering a mix of green space and local amenities, suitable for visitors looking for a more relaxed stay. | Aylestone Meadows, Local parks, River Soar walks |
| Highfields | A diverse neighborhood close to the city, known for its cultural richness and vibrant community, ideal for authentic local experiences. | Victoria Park, Belgrave Road (Golden Mile), Local shops and eateries |
| Diverse Communities in East Leicester | Known for its multicultural environment, this area offers unique attractions and experiences, appealing to a wide variety of guests. | The Golden Mile, Local markets, Cultural festivals |
Understanding Airbnb License Requirements & STR Laws in Leicester (2026)
While Leicester, England, United Kingdom currently shows low STR regulations, specific Airbnb license requirements might still exist or change. Always verify the latest short term rental regulations and Airbnb license requirements directly with local government authorities for Leicester to ensure full compliance before hosting.
(Source: AirROI data, 2026, based on 2% licensed listings)
Top Performing Airbnb Properties in Leicester (2026)
Benchmark your potential! Explore examples of top-performing Airbnb properties in Leicesterbased on Trailing Twelve Month (TTM) revenue. Analyze their characteristics, revenue, occupancy rate, and ADR to understand what drives success in this market.
24 Guests Haven in Stoneygate
Entire Place • 10 bedrooms
Spectacular Period Property. Large Gardens.
Entire Place • 7 bedrooms

Cozy 5BR Leicester Home • Sleeps 10 • Free Parking
Entire Place • 5 bedrooms

22B: Gorgeous, Spacious Home Perfect For Groups
Entire Place • 5 bedrooms
22A: Gorgeous, Spacious Home Perfect For Groups
Entire Place • 5 bedrooms

5 Bed Modern Elm Tree House City Centre 92" Cinema
Entire Place • 5 bedrooms
Note: Performance varies based on location, size, amenities, seasonality, and management quality. Data reflects the past 12 months.
Top Performing Airbnb Hosts in Leicester (2026)
Learn from the best! This table showcases top-performing Airbnb hosts in Leicester based on the number of properties managed and estimated total revenue over the past year. Analyze their scale and performance metrics.
| Host Name | Properties | Grossing Revenue | Stay Reviews | Avg Rating |
|---|---|---|---|---|
| Kurosh | 3 | $340,029 | 110 | 4.99/5.0 |
| Kyle | 10 | $271,748 | 211 | 4.81/5.0 |
| Olly Stabler | 6 | $249,360 | 526 | 4.82/5.0 |
| Uliv | 16 | $207,766 | 765 | 4.60/5.0 |
| Thomas | 15 | $200,017 | 657 | 4.65/5.0 |
| Sanjay Vig | 19 | $193,040 | 411 | 4.21/5.0 |
| Vexford Management | 8 | $155,597 | 178 | 4.79/5.0 |
| Mihir | 4 | $149,018 | 703 | 4.94/5.0 |
| Iliyan | 7 | $114,636 | 380 | 4.79/5.0 |
| A&H Prime Properties | 5 | $108,758 | 177 | 4.89/5.0 |
Analyzing the strategies of top hosts, such as their property selection, pricing, and guest communication, can offer valuable lessons for optimizing your own Airbnb operations in Leicester.
Dive Deeper: Advanced Leicester STR Market Data (2026)
Ready to unlock more insights? AirROI provides access to advanced metrics and comprehensive Airbnb data for Leicester. Explore detailed analytics beyond this report to refine your investment strategy, optimize pricing, and maximize your vacation rental profits.
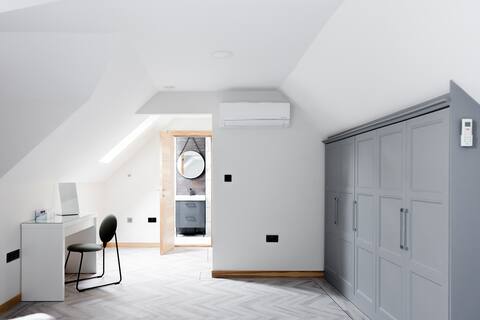
Explore Advanced MetricsLeicester Short-Term Rental Market Composition (2026): Property & Room Types
Room Type Distribution
Property Type Distribution
Market Composition Insights for Leicester
- The Leicester Airbnb market composition is heavily skewed towards Entire Home/Apt listings, which make up 70.6% of the 483 active rentals. This indicates strong guest preference for privacy and space.
- Looking at the property type distribution in Leicester, Apartment/Condo properties are the most common (54%), reflecting the local real estate landscape.
- Houses represent a significant 39.5% portion, catering likely to families or larger groups.
- The presence of 5.6% Hotel/Boutique listings indicates integration with traditional hospitality.
- Smaller segments like others, outdoor/unique (combined 0.8%) offer potential for unique stay experiences.
Leicester Airbnb Room Capacity Analysis (2026): Bedroom Distribution
Distribution of Listings by Number of Bedrooms
Room Capacity Insights for Leicester
- The dominant room capacity in Leicester is 1 bedroom listings, making up 38.5% of the market. This suggests a strong demand for properties suitable for couples or solo travelers.
- Together, 1 bedroom and 2 bedrooms properties represent 59.4% of the active Airbnb listings in Leicester, indicating a high concentration in these sizes.
Leicester Vacation Rental Guest Capacity Trends (2026)
Distribution of Listings by Guest Capacity
Guest Capacity Insights for Leicester
- The most common guest capacity trend in Leicester vacation rentals is listings accommodating 2 guests (24.6%). This suggests the primary traveler segment is likely couples or solo travelers.
- Properties designed for 2 guests and 4 guests dominate the Leicester STR market, accounting for 39.1% of listings.
- 23.8% of properties accommodate 6+ guests, serving the market segment for larger families or group travel in Leicester.
- On average, properties in Leicester are equipped to host 3.3 guests.
Leicester Airbnb Booking Patterns (2026): Available vs. Booked Days
Available Days Distribution
Booked Days Distribution
Booking Pattern Insights for Leicester
- The most common availability pattern in Leicester falls within the 271-366 days range, representing 61.9% of listings. This suggests many properties have significant open periods on their calendars.
- Approximately 88.2% of listings show high availability (181+ days open annually), indicating potential for increased bookings or specific owner usage patterns.
- For booked days, the 1-30 days range is most frequent in Leicester (30.8%), reflecting common guest stay durations or potential owner blocking patterns.
- A notable 12.2% of properties secure long booking periods (181+ days booked per year), highlighting successful long-term rental strategies or significant owner usage.
Leicester Airbnb Minimum Stay Requirements Analysis
Distribution of Listings by Minimum Night Requirement
1 Night
160 listings
33.1% of total
2 Nights
95 listings
19.7% of total
3 Nights
28 listings
5.8% of total
4-6 Nights
14 listings
2.9% of total
7-29 Nights
55 listings
11.4% of total
30+ Nights
131 listings
27.1% of total
Key Insights
- The most prevalent minimum stay requirement in Leicester is 1 Night, adopted by 33.1% of listings. This highlights the market's preference for shorter, flexible bookings.
- A significant segment (27.1%) caters to monthly stays (30+ nights) in Leicester, pointing to opportunities in the extended-stay market.
Recommendations
- Align with the market by considering a 1 Night minimum stay, as 33.1% of Leicester hosts use this setting.
- Explore offering discounts for stays of 30+ nights to attract the 27.1% of the market seeking extended stays.
- Adjust minimum nights based on seasonality – potentially shorter during low season and longer during peak demand periods in Leicester.
Leicester Airbnb Cancellation Policy Trends Analysis (2026)
Non-refundable
1 listings
0.2% of total
Limited
3 listings
0.6% of total
Super Strict 30 Days
3 listings
0.6% of total
Refundable
1 listings
0.2% of total
Flexible
160 listings
33.1% of total
Moderate
171 listings
35.4% of total
Firm
98 listings
20.3% of total
Strict
46 listings
9.5% of total
Cancellation Policy Insights for Leicester
- The prevailing Airbnb cancellation policy trend in Leicester is Moderate, used by 35.4% of listings.
- There's a relatively balanced mix between guest-friendly (68.5%) and stricter (29.8%) policies, offering choices for different guest needs.
- Strict cancellation policies are quite rare (9.5%), potentially making listings with this policy less competitive unless justified by high demand or property type.
Recommendations for Hosts
- Consider adopting a Moderate policy to align with the 35.4% market standard in Leicester.
- Using a Strict policy might deter some guests, as only 9.5% of listings use it. Evaluate if potential revenue protection outweighs possible lower booking rates.
- Regularly review your cancellation policy against competitors and market demand shifts in Leicester.
Leicester STR Booking Lead Time Analysis (2026)
Average Booking Lead Time by Month
Booking Lead Time Insights for Leicester
- The overall average booking lead time for vacation rentals in Leicester is 28 days.
- Guests book furthest in advance for stays during May (average 50 days), likely coinciding with peak travel demand or local events.
- The shortest booking windows occur for stays in March (average 18 days), indicating more last-minute travel plans during this time.
- Seasonally, Fall (32 days avg.) sees the longest lead times, while Winter (23 days avg.) has the shortest, reflecting typical travel planning cycles.
Recommendations for Hosts
- Use the overall average lead time (28 days) as a baseline for your pricing and availability strategy in Leicester.
- For May stays, consider implementing length-of-stay discounts or slightly higher rates for bookings made less than 50 days out to capitalize on advance planning.
- Target marketing efforts for the Fall season well in advance (at least 32 days) to capture early planners.
- Monitor your own booking lead times against these Leicester averages to identify opportunities for dynamic pricing adjustments.
Popular & Essential Airbnb Amenities in Leicester (2026)
Amenity Prevalence
Amenity Insights for Leicester
- Essential amenities in Leicester that guests expect include: Wifi. Lacking these (this) could significantly impact bookings.
- Popular amenities like Smoke alarm, Kitchen, TV are common but not universal. Offering these can provide a competitive edge.
Recommendations for Hosts
- Ensure your listing includes all essential amenities for Leicester: Wifi.
- Prioritize adding missing essentials: Wifi.
- Consider adding popular differentiators like Smoke alarm or Kitchen to increase appeal.
- Highlight unique or less common amenities you offer (e.g., hot tub, dedicated workspace, EV charger) in your listing description and photos.
- Regularly check competitor amenities in Leicester to stay competitive.
Leicester Airbnb Guest Demographics & Profile Analysis (2026)
Guest Profile Summary for Leicester
- The typical guest profile for Airbnb in Leicester consists of primarily domestic travelers (83%), often arriving from nearby England, typically belonging to the Post-2000s (Gen Z/Alpha) group (50%), primarily speaking English or French.
- Domestic travelers account for 83.3% of guests.
- Key international markets include United Kingdom (83.3%) and United States (3.7%).
- Top languages spoken are English (58.4%) followed by French (6.2%).
- A significant demographic segment is the Post-2000s (Gen Z/Alpha) group, representing 50% of guests.
Recommendations for Hosts
- Target domestic marketing efforts towards travelers from England and London.
- Tailor amenities and listing descriptions to appeal to the dominant Post-2000s (Gen Z/Alpha) demographic (e.g., highlight fast WiFi, smart home features, local guides).
- Highlight unique local experiences or amenities relevant to the primary guest profile.
- Consider seasonal promotions aligned with peak travel times for key origin markets.
Nearby Short-Term Rental Market Comparison
How does the Leicester Airbnb market stack up against its neighbors? Compare key performance metrics like average monthly revenue, ADR, and occupancy rates in surrounding areas to understand the broader regional STR landscape.
| Market | Active Properties | Monthly Revenue | Daily Rate | Avg. Occupancy |
|---|---|---|---|---|
| Dorney | 11 | $7,510 | $743.63 | 39% |
| Chew Magna | 13 | $7,041 | $430.65 | 44% |
| Englishcombe | 15 | $6,734 | $511.35 | 53% |
| Lambourn | 11 | $6,499 | $723.41 | 31% |
| East Knoyle | 10 | $6,300 | $407.06 | 44% |
| Wraysbury | 16 | $6,199 | $530.56 | 49% |
| City of Westminster | 1,424 | $6,053 | $515.72 | 50% |
| Long Sutton | 18 | $6,029 | $383.58 | 46% |
| Withington | 10 | $5,690 | $499.79 | 44% |
| Ashley | 13 | $5,497 | $364.68 | 54% |