Market Drayton Airbnb Market Analysis 2026: Short Term Rental Data & Vacation Rental Statistics in England, United Kingdom
Is Airbnb profitable in Market Drayton in 2026? Explore comprehensive Airbnb analytics for Market Drayton, England, United Kingdom to uncover income potential. This 2026 STR market report for Market Drayton, based on AirROI data from February 2025 to January 2026, reveals key trends in the niche market of 18 active listings.
Whether you're considering an Airbnb investment in Market Drayton, optimizing your existing vacation rental, or exploring rental arbitrage opportunities, understanding the Market Drayton Airbnb data is crucial. Leveraging the low regulation environment is key to maximizing your short term rental income potential. Let's dive into the specifics.
Key Market Drayton Airbnb Performance Metrics Overview
Monthly Airbnb Revenue Variations & Income Potential in Market Drayton (2026)
Understanding the monthly revenue variations for Airbnb listings in Market Drayton is key to maximizing your short term rental income potential. Seasonality significantly impacts earnings. Our analysis, based on data from the past 12 months, shows that the peak revenue month for STRs in Market Drayton is typically August, while January often presents the lowest earnings, highlighting opportunities for strategic pricing adjustments during shoulder and low seasons. Explore the typical Airbnb income in Market Drayton across different performance tiers:
- Best-in-class properties (Top 10%) achieve $4,653+ monthly, often utilizing dynamic pricing and superior guest experiences.
- Strong performing properties (Top 25%) earn $2,722 or more, indicating effective management and desirable locations/amenities.
- Typical properties (Median) generate around $1,723 per month, representing the average market performance.
- Entry-level properties (Bottom 25%) see earnings around $984, often with potential for optimization.
Average Monthly Airbnb Earnings Trend in Market Drayton
Market Drayton Airbnb Occupancy Rate Trends (2026)
Maximize your bookings by understanding the Market Drayton STR occupancy trends. Seasonal demand shifts significantly influence how often properties are booked. Typically, Augustsees the highest demand (peak season occupancy), while January experiences the lowest (low season). Effective strategies, like adjusting minimum stays or offering promotions, can boost occupancy during slower periods. Here's how different property tiers perform in Market Drayton:
- Best-in-class properties (Top 10%) achieve 84%+ occupancy, indicating high desirability and potentially optimized availability.
- Strong performing properties (Top 25%) maintain 69% or higher occupancy, suggesting good market fit and guest satisfaction.
- Typical properties (Median) have an occupancy rate around 50%.
- Entry-level properties (Bottom 25%) average 25% occupancy, potentially facing higher vacancy.
Average Monthly Occupancy Rate Trend in Market Drayton
Average Daily Rate (ADR) Airbnb Trends in Market Drayton (2026)
Effective short term rental pricing strategy in Market Drayton involves understanding monthly ADR fluctuations. The Average Daily Rate (ADR) for Airbnb in Market Drayton typically peaks in December and dips lowest during March. Leveraging Airbnb dynamic pricing tools or strategies based on this seasonality can significantly boost revenue. Here's a look at the typical nightly rates achieved:
- Best-in-class properties (Top 10%) command rates of $238+ per night, often due to premium features or locations.
- Strong performing properties (Top 25%) achieve nightly rates of $167 or more.
- Typical properties (Median) charge around $129 per night.
- Entry-level properties (Bottom 25%) earn around $94 per night.
Average Daily Rate (ADR) Trend by Month in Market Drayton
Get Live Market Drayton Market Intelligence 👇
Explore Real-time Analytics
Airbnb Seasonality Analysis & Trends in Market Drayton (2026)
Peak Season (August, September, December)
- Revenue averages $2,751 per month
- Occupancy rates average 55.5%
- Daily rates average $151
Shoulder Season
- Revenue averages $2,034 per month
- Occupancy maintains around 48.8%
- Daily rates hold near $147
Low Season (January, February, April)
- Revenue drops to average $1,672 per month
- Occupancy decreases to average 42.4%
- Daily rates adjust to average $137
Seasonality Insights for Market Drayton
- The Airbnb seasonality in Market Drayton shows highly seasonal trends requiring careful strategy. While the sections above show seasonal averages, it's also insightful to look at the extremes:
- During the high season, the absolute peak month showcases Market Drayton's highest earning potential, with monthly revenues capable of climbing to $3,056, occupancy reaching a high of 57.7%, and ADRs peaking at $160.
- Conversely, the slowest single month of the year, typically falling within the low season, marks the market's lowest point. In this month, revenue might dip to $1,400, occupancy could drop to 35.5%, and ADRs may adjust down to $127.
- Understanding both the seasonal averages and these monthly peaks and troughs in revenue, occupancy, and ADR is crucial for maximizing your Airbnb profit potential in Market Drayton.
Seasonal Strategies for Maximizing Profit
- Peak Season: Maximize revenue through premium pricing and potentially longer minimum stays. Ensure high availability.
- Low Season: Offer competitive pricing, special promotions (e.g., extended stay discounts), and flexible cancellation policies. Target off-season travelers like remote workers or budget-conscious guests.
- Shoulder Seasons: Implement dynamic pricing that balances peak and low rates. Target weekend travelers or specific events. Offer slightly more flexible terms than peak season.
- Regularly analyze your own performance against these Market Drayton seasonality benchmarks and adjust your pricing and availability strategy accordingly.
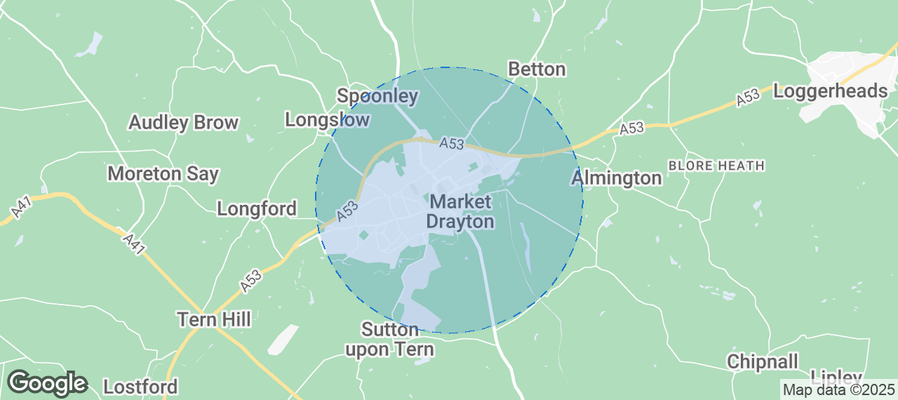
Best Areas for Airbnb Investment in Market Drayton (2026)
Exploring the top neighborhoods for short-term rentals in Market Drayton? This section highlights key areas, outlining why they are attractive for hosts and guests, along with notable local attractions. Consider these locations based on your target guest profile and investment strategy.
| Neighborhood / Area | Why Host Here? (Target Guests & Appeal) | Key Attractions & Landmarks |
|---|---|---|
| Market Drayton Town Centre | The heart of Market Drayton with shops, restaurants, and local attractions, making it a prime location for visitors exploring the area. | Market Drayton Museum, Festival Drayton Centre, Local Markets, Hawksworth Hall, Reabrook Valley |
| The Shropshire Union Canal | This scenic canal area attracts visitors for walking, cycling, and boating, providing a tranquil setting for relaxation and outdoor activities. | Shropshire Union Canal, Wrest Park, Canal Walks, Fisher's Mill locks |
| Fairfields | A desirable residential area with proximity to parks and schools, appealing to families and long-term guests seeking a homely stay. | Fairfields Park, Local Playgrounds, Close to amenities |
| Longford | A scenic neighborhood near the countryside, offering a peaceful environment while still being close to town amenities, perfect for nature lovers. | Walking trails, Natural reserves, Countryside views |
| Little Drayton | A quaint area known for its rural charm and community feel, popular among those wanting a relaxing stay away from the hustle and bustle. | Local farms, Village attractions, Rural activities |
| Derby Road | A major thoroughfare with easy access to local shops and restaurants, making it convenient for transient guests and short-term stays. | Shopping venues, Restaurants, Transport Links |
| Tern Hill | Offers a more rural retreat vibe with proximity to the Tern Valley and countryside walks, ideal for outdoor enthusiasts and families. | Tern Valley, Countryside walks, Natural scenery |
| Market Drayton Festivals | During festival seasons, Market Drayton transforms with vibrant activities, attracting tourists and creating opportunities for Airbnb hosts. | Market Drayton Food Festival, Local Craft Fairs, Cultural events |
Understanding Airbnb License Requirements & STR Laws in Market Drayton (2026)
While Market Drayton, England, United Kingdom currently shows low STR regulations, specific Airbnb license requirements might still exist or change. Always verify the latest short term rental regulations and Airbnb license requirements directly with local government authorities for Market Drayton to ensure full compliance before hosting.
(Source: AirROI data, 2026, finding no licensed listings among those analyzed)
Top Performing Airbnb Properties in Market Drayton (2026)
Benchmark your potential! Explore examples of top-performing Airbnb properties in Market Draytonbased on Trailing Twelve Month (TTM) revenue. Analyze their characteristics, revenue, occupancy rate, and ADR to understand what drives success in this market.
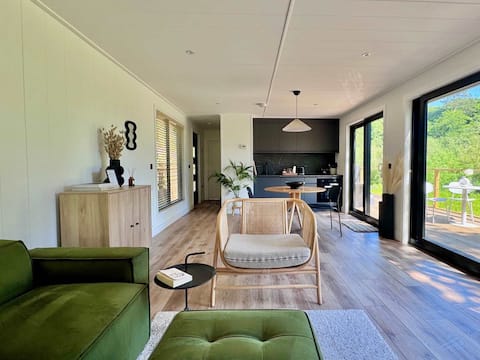
Eco Retreat with River Views in Shropshire
Entire Place • 1 bedroom
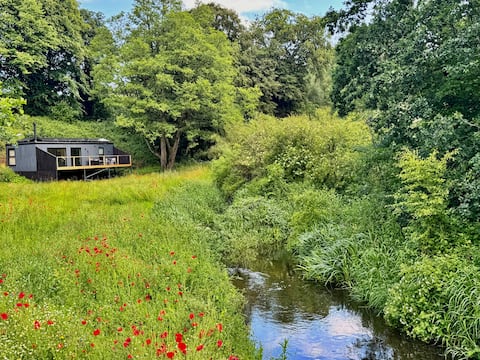
Luxurious Eco-Retreat in Market Drayton
Entire Place • 1 bedroom
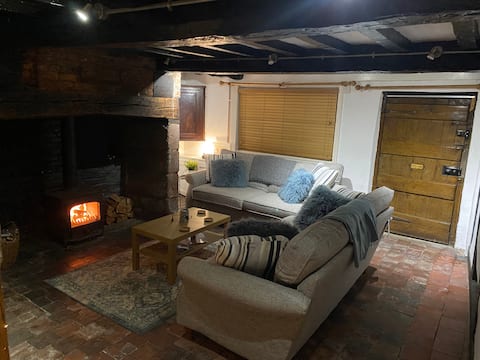
A historic cottage in the heart of Market Drayton
Entire Place • 2 bedrooms

Styche view beautiful spacious, four bedroom home
Entire Place • 4 bedrooms

Fronting Shropshire Union canal
Entire Place • 2 bedrooms
Charming Victorian Hidden Gem in Market Drayton
Entire Place • 2 bedrooms
Note: Performance varies based on location, size, amenities, seasonality, and management quality. Data reflects the past 12 months.
Top Performing Airbnb Hosts in Market Drayton (2026)
Learn from the best! This table showcases top-performing Airbnb hosts in Market Drayton based on the number of properties managed and estimated total revenue over the past year. Analyze their scale and performance metrics.
| Host Name | Properties | Grossing Revenue | Stay Reviews | Avg Rating |
|---|---|---|---|---|
| Michael | 2 | $105,239 | 112 | 4.82/5.0 |
| Janet | 2 | $44,968 | 383 | 4.97/5.0 |
| Laurie | 1 | $35,703 | 198 | 4.95/5.0 |
| Sam | 1 | $35,461 | 98 | 4.97/5.0 |
| Damion | 2 | $35,341 | 397 | 4.79/5.0 |
| Karen | 2 | $27,736 | 11 | 4.90/5.0 |
| Mark | 1 | $25,967 | 108 | 4.91/5.0 |
| Jane-Pass The Keys | 1 | $24,440 | 29 | 5.00/5.0 |
| Amanda | 1 | $23,035 | 370 | 4.94/5.0 |
| Jemma | 1 | $22,898 | 99 | 4.96/5.0 |
Analyzing the strategies of top hosts, such as their property selection, pricing, and guest communication, can offer valuable lessons for optimizing your own Airbnb operations in Market Drayton.
Dive Deeper: Advanced Market Drayton STR Market Data (2026)
Ready to unlock more insights? AirROI provides access to advanced metrics and comprehensive Airbnb data for Market Drayton. Explore detailed analytics beyond this report to refine your investment strategy, optimize pricing, and maximize your vacation rental profits.
Explore Advanced MetricsMarket Drayton Short-Term Rental Market Composition (2026): Property & Room Types
Room Type Distribution
Property Type Distribution
Market Composition Insights for Market Drayton
- The Market Drayton Airbnb market composition is heavily skewed towards Entire Home/Apt listings, which make up 94.4% of the 18 active rentals. This indicates strong guest preference for privacy and space.
- Looking at the property type distribution in Market Drayton, House properties are the most common (44.4%), reflecting the local real estate landscape.
- Houses represent a significant 44.4% portion, catering likely to families or larger groups.
Market Drayton Airbnb Room Capacity Analysis (2026): Bedroom Distribution
Distribution of Listings by Number of Bedrooms
Room Capacity Insights for Market Drayton
- The dominant room capacity in Market Drayton is 1 bedroom listings, making up 50% of the market. This suggests a strong demand for properties suitable for couples or solo travelers.
- Together, 1 bedroom and 2 bedrooms properties represent 72.2% of the active Airbnb listings in Market Drayton, indicating a high concentration in these sizes.
Market Drayton Vacation Rental Guest Capacity Trends (2026)
Distribution of Listings by Guest Capacity
Guest Capacity Insights for Market Drayton
- The most common guest capacity trend in Market Drayton vacation rentals is listings accommodating 2 guests (44.4%). This suggests the primary traveler segment is likely couples or solo travelers.
- Properties designed for 2 guests and 4 guests dominate the Market Drayton STR market, accounting for 72.2% of listings.
- A significant 44.4% of listings cater specifically to 1-2 guests, highlighting strong demand from couples and solo travelers in Market Drayton.
- 11.2% of properties accommodate 6+ guests, serving the market segment for larger families or group travel in Market Drayton.
- On average, properties in Market Drayton are equipped to host 3.2 guests.
Market Drayton Airbnb Booking Patterns (2026): Available vs. Booked Days
Available Days Distribution
Booked Days Distribution
Booking Pattern Insights for Market Drayton
- The most common availability pattern in Market Drayton falls within the 91-180 days range, representing 44.4% of listings. This suggests many properties have significant open periods on their calendars.
- Approximately 50.0% of listings show high availability (181+ days open annually), indicating potential for increased bookings or specific owner usage patterns.
- For booked days, the 181-270 days range is most frequent in Market Drayton (38.9%), reflecting common guest stay durations or potential owner blocking patterns.
- A notable 50.0% of properties secure long booking periods (181+ days booked per year), highlighting successful long-term rental strategies or significant owner usage.
Market Drayton Airbnb Minimum Stay Requirements Analysis
Distribution of Listings by Minimum Night Requirement
1 Night
7 listings
38.9% of total
2 Nights
4 listings
22.2% of total
3 Nights
1 listings
5.6% of total
30+ Nights
6 listings
33.3% of total
Key Insights
- The most prevalent minimum stay requirement in Market Drayton is 1 Night, adopted by 38.9% of listings. This highlights the market's preference for shorter, flexible bookings.
- A strong majority (61.1%) of the Market Drayton Airbnb data shows acceptance of very short stays (1-2 nights), indicating a dynamic, high-turnover market.
- A significant segment (33.3%) caters to monthly stays (30+ nights) in Market Drayton, pointing to opportunities in the extended-stay market.
Recommendations
- Align with the market by considering a 1 Night minimum stay, as 38.9% of Market Drayton hosts use this setting.
- Explore offering discounts for stays of 30+ nights to attract the 33.3% of the market seeking extended stays.
- Adjust minimum nights based on seasonality – potentially shorter during low season and longer during peak demand periods in Market Drayton.
Market Drayton Airbnb Cancellation Policy Trends Analysis (2026)
Flexible
10 listings
55.6% of total
Moderate
4 listings
22.2% of total
Firm
4 listings
22.2% of total
Cancellation Policy Insights for Market Drayton
- The prevailing Airbnb cancellation policy trend in Market Drayton is Flexible, used by 55.6% of listings.
- The market strongly favors guest-friendly terms, with 77.8% of listings offering Flexible or Moderate policies. This suggests guests in Market Drayton may expect booking flexibility.
Recommendations for Hosts
- Consider adopting a Flexible policy to align with the 55.6% market standard in Market Drayton.
- Given the high prevalence of Flexible policies (55.6%), offering this can enhance booking appeal, especially during shoulder seasons.
- Regularly review your cancellation policy against competitors and market demand shifts in Market Drayton.
Market Drayton STR Booking Lead Time Analysis (2026)
Average Booking Lead Time by Month
Booking Lead Time Insights for Market Drayton
- The overall average booking lead time for vacation rentals in Market Drayton is 49 days.
- Guests book furthest in advance for stays during September (average 70 days), likely coinciding with peak travel demand or local events.
- The shortest booking windows occur for stays in November (average 24 days), indicating more last-minute travel plans during this time.
- Seasonally, Summer (50 days avg.) sees the longest lead times, while Winter (41 days avg.) has the shortest, reflecting typical travel planning cycles.
Recommendations for Hosts
- Use the overall average lead time (49 days) as a baseline for your pricing and availability strategy in Market Drayton.
- For September stays, consider implementing length-of-stay discounts or slightly higher rates for bookings made less than 70 days out to capitalize on advance planning.
- Target marketing efforts for the Summer season well in advance (at least 50 days) to capture early planners.
- Monitor your own booking lead times against these Market Drayton averages to identify opportunities for dynamic pricing adjustments.
Popular & Essential Airbnb Amenities in Market Drayton (2026)
Amenity Prevalence
Amenity Insights for Market Drayton
- Essential amenities in Market Drayton that guests expect include: Bed linens, Heating, Wifi, TV. Lacking these (any) could significantly impact bookings.
- Popular amenities like Cooking basics, Wine glasses, Hot water kettle are common but not universal. Offering these can provide a competitive edge.
Recommendations for Hosts
- Ensure your listing includes all essential amenities for Market Drayton: Bed linens, Heating, Wifi, TV.
- Consider adding popular differentiators like Cooking basics or Wine glasses to increase appeal.
- Highlight unique or less common amenities you offer (e.g., hot tub, dedicated workspace, EV charger) in your listing description and photos.
- Regularly check competitor amenities in Market Drayton to stay competitive.
Market Drayton Airbnb Guest Demographics & Profile Analysis (2026)
Guest Profile Summary for Market Drayton
- The typical guest profile for Airbnb in Market Drayton consists of primarily domestic travelers (94%), often arriving from nearby England, typically belonging to the Post-2000s (Gen Z/Alpha) group (50%), primarily speaking English or French.
- Domestic travelers account for 93.6% of guests.
- Key international markets include United Kingdom (93.6%) and United States (1.6%).
- Top languages spoken are English (75.9%) followed by French (8%).
- A significant demographic segment is the Post-2000s (Gen Z/Alpha) group, representing 50% of guests.
Recommendations for Hosts
- Target domestic marketing efforts towards travelers from England and London.
- Tailor amenities and listing descriptions to appeal to the dominant Post-2000s (Gen Z/Alpha) demographic (e.g., highlight fast WiFi, smart home features, local guides).
- Highlight unique local experiences or amenities relevant to the primary guest profile.
- Consider seasonal promotions aligned with peak travel times for key origin markets.
Nearby Short-Term Rental Market Comparison
How does the Market Drayton Airbnb market stack up against its neighbors? Compare key performance metrics like average monthly revenue, ADR, and occupancy rates in surrounding areas to understand the broader regional STR landscape.
| Market | Active Properties | Monthly Revenue | Daily Rate | Avg. Occupancy |
|---|---|---|---|---|
| Chew Magna | 13 | $7,041 | $430.65 | 44% |
| Englishcombe | 15 | $6,734 | $511.35 | 53% |
| Lambourn | 11 | $6,499 | $723.41 | 31% |
| East Knoyle | 10 | $6,300 | $407.06 | 44% |
| Long Sutton | 18 | $6,029 | $383.58 | 46% |
| Withington | 10 | $5,690 | $499.79 | 44% |
| Ashley | 13 | $5,497 | $364.68 | 54% |
| Bont-dolgadfan | 10 | $5,458 | $293.24 | 58% |
| Freshford | 12 | $5,333 | $317.81 | 58% |
| Grosmont | 11 | $5,211 | $459.67 | 55% |