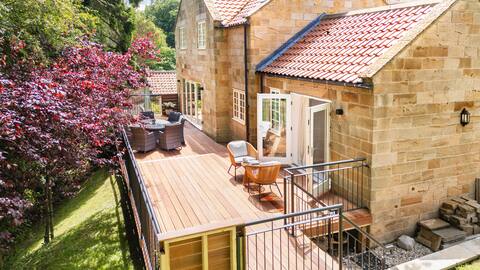
Newholm-cum-Dunsley Airbnb Market Analysis 2026: Short Term Rental Data & Vacation Rental Statistics in England, United Kingdom
Is Airbnb profitable in Newholm-cum-Dunsley in 2026? Explore comprehensive Airbnb analytics for Newholm-cum-Dunsley, England, United Kingdom to uncover income potential. This 2026 STR market report for Newholm-cum-Dunsley, based on AirROI data from February 2025 to January 2026, reveals key trends in the niche market of 19 active listings.
Whether you're considering an Airbnb investment in Newholm-cum-Dunsley, optimizing your existing vacation rental, or exploring rental arbitrage opportunities, understanding the Newholm-cum-Dunsley Airbnb data is crucial. Leveraging the low regulation environment is key to maximizing your short term rental income potential. Let's dive into the specifics.
Key Newholm-cum-Dunsley Airbnb Performance Metrics Overview
Monthly Airbnb Revenue Variations & Income Potential in Newholm-cum-Dunsley (2026)
Understanding the monthly revenue variations for Airbnb listings in Newholm-cum-Dunsley is key to maximizing your short term rental income potential. Seasonality significantly impacts earnings. Our analysis, based on data from the past 12 months, shows that the peak revenue month for STRs in Newholm-cum-Dunsley is typically June, while January often presents the lowest earnings, highlighting opportunities for strategic pricing adjustments during shoulder and low seasons. Explore the typical Airbnb income in Newholm-cum-Dunsley across different performance tiers:
- Best-in-class properties (Top 10%) achieve $12,438+ monthly, often utilizing dynamic pricing and superior guest experiences.
- Strong performing properties (Top 25%) earn $5,976 or more, indicating effective management and desirable locations/amenities.
- Typical properties (Median) generate around $3,048 per month, representing the average market performance.
- Entry-level properties (Bottom 25%) see earnings around $1,381, often with potential for optimization.
Average Monthly Airbnb Earnings Trend in Newholm-cum-Dunsley
Newholm-cum-Dunsley Airbnb Occupancy Rate Trends (2026)
Maximize your bookings by understanding the Newholm-cum-Dunsley STR occupancy trends. Seasonal demand shifts significantly influence how often properties are booked. Typically, Augustsees the highest demand (peak season occupancy), while January experiences the lowest (low season). Effective strategies, like adjusting minimum stays or offering promotions, can boost occupancy during slower periods. Here's how different property tiers perform in Newholm-cum-Dunsley:
- Best-in-class properties (Top 10%) achieve 82%+ occupancy, indicating high desirability and potentially optimized availability.
- Strong performing properties (Top 25%) maintain 63% or higher occupancy, suggesting good market fit and guest satisfaction.
- Typical properties (Median) have an occupancy rate around 42%.
- Entry-level properties (Bottom 25%) average 24% occupancy, potentially facing higher vacancy.
Average Monthly Occupancy Rate Trend in Newholm-cum-Dunsley
Average Daily Rate (ADR) Airbnb Trends in Newholm-cum-Dunsley (2026)
Effective short term rental pricing strategy in Newholm-cum-Dunsley involves understanding monthly ADR fluctuations. The Average Daily Rate (ADR) for Airbnb in Newholm-cum-Dunsley typically peaks in August and dips lowest during January. Leveraging Airbnb dynamic pricing tools or strategies based on this seasonality can significantly boost revenue. Here's a look at the typical nightly rates achieved:
- Best-in-class properties (Top 10%) command rates of $649+ per night, often due to premium features or locations.
- Strong performing properties (Top 25%) achieve nightly rates of $435 or more.
- Typical properties (Median) charge around $265 per night.
- Entry-level properties (Bottom 25%) earn around $141 per night.
Average Daily Rate (ADR) Trend by Month in Newholm-cum-Dunsley
Get Live Newholm-cum-Dunsley Market Intelligence 👇

Explore Real-time Analytics
Airbnb Seasonality Analysis & Trends in Newholm-cum-Dunsley (2026)
Peak Season (June, December, August)
- Revenue averages $6,699 per month
- Occupancy rates average 49.7%
- Daily rates average $381
Shoulder Season
- Revenue averages $5,467 per month
- Occupancy maintains around 47.9%
- Daily rates hold near $365
Low Season (January, March, September)
- Revenue drops to average $3,496 per month
- Occupancy decreases to average 38.4%
- Daily rates adjust to average $342
Seasonality Insights for Newholm-cum-Dunsley
- The Airbnb seasonality in Newholm-cum-Dunsley shows highly seasonal trends requiring careful strategy. While the sections above show seasonal averages, it's also insightful to look at the extremes:
- During the high season, the absolute peak month showcases Newholm-cum-Dunsley's highest earning potential, with monthly revenues capable of climbing to $6,859, occupancy reaching a high of 62.7%, and ADRs peaking at $404.
- Conversely, the slowest single month of the year, typically falling within the low season, marks the market's lowest point. In this month, revenue might dip to $2,951, occupancy could drop to 23.5%, and ADRs may adjust down to $324.
- Understanding both the seasonal averages and these monthly peaks and troughs in revenue, occupancy, and ADR is crucial for maximizing your Airbnb profit potential in Newholm-cum-Dunsley.
Seasonal Strategies for Maximizing Profit
- Peak Season: Maximize revenue through premium pricing and potentially longer minimum stays. Ensure high availability.
- Low Season: Offer competitive pricing, special promotions (e.g., extended stay discounts), and flexible cancellation policies. Target off-season travelers like remote workers or budget-conscious guests.
- Shoulder Seasons: Implement dynamic pricing that balances peak and low rates. Target weekend travelers or specific events. Offer slightly more flexible terms than peak season.
- Regularly analyze your own performance against these Newholm-cum-Dunsley seasonality benchmarks and adjust your pricing and availability strategy accordingly.
Best Areas for Airbnb Investment in Newholm-cum-Dunsley (2026)
Exploring the top neighborhoods for short-term rentals in Newholm-cum-Dunsley? This section highlights key areas, outlining why they are attractive for hosts and guests, along with notable local attractions. Consider these locations based on your target guest profile and investment strategy.
| Neighborhood / Area | Why Host Here? (Target Guests & Appeal) | Key Attractions & Landmarks |
|---|---|---|
| Whitby Harbour | Scenic harbor town known for its historic charm and proximity to the North York Moors. Popular with tourists for its picturesque views and rich maritime history. | Whitby Abbey, Captain Cook Memorial Museum, Whitby Beach, Lifeboat Museum, Pannett Park |
| Robin Hood's Bay | Quaint coastal village with steep streets and stunning cliffs. Ideal for visitors seeking a relaxing beach getaway and scenic walks along the coast. | Robin Hood's Bay Beach, Coastguard Station, National Trust Cliffs, Hiking Trails, Old Village |
| Sandsend | Beautiful beach village adjacent to Whitby, famous for its stunning sandy beach and charming seaside atmosphere. Attracts families and beachgoers. | Sandsend Beach, Cafes and Restaurants, Coastal Walking Paths, Sandsend Dunes, Whitby Golf Club |
| Goathland | Famous for its connections to the TV series Heartbeat, this picturesque village in the North York Moors is perfect for tourists looking for scenic beauty and tranquility. | Goathland Station, Moors National Park, Heartbeat Experience, Hiking Trails, Mallyan Spout Waterfall |
| Runswick Bay | Charming coastal village known for its stunning beach and scenic cliffs. Popular for those wanting to enjoy traditional British seaside life. | Runswick Bay Beach, Coastal Walks, Village Shops and Pubs, Scenic Cliffs, Marine Life |
| Danby | Situated in the North York Moors, Danby is great for those who enjoy nature and outdoor activities. Close to historical sites and national parks. | Danby Castle, North York Moors Railway, Danby Lodge, Hiking Trails, Beck Hole |
| Staithes | A traditional fishing village with scenic views and a rich history, ideal for those who appreciate art and culture by the sea. | Staithes Museum, Captain Cook's Heritage Centre, Staithes Beach, Coastal Walks, Art Galleries |
| Middlesbrough | Larger town with urban amenities and access to attractions such as museums and shopping, making it ideal for business travelers and families. | Middlesbrough Institute of Modern Art, Dorman Museum, Tees Transporter Bridge, Cleveland Centre, Albert Park |
Understanding Airbnb License Requirements & STR Laws in Newholm-cum-Dunsley (2026)
While Newholm-cum-Dunsley, England, United Kingdom currently shows low STR regulations, specific Airbnb license requirements might still exist or change. Always verify the latest short term rental regulations and Airbnb license requirements directly with local government authorities for Newholm-cum-Dunsley to ensure full compliance before hosting.
(Source: AirROI data, 2026, finding no licensed listings among those analyzed)
Top Performing Airbnb Properties in Newholm-cum-Dunsley (2026)
Benchmark your potential! Explore examples of top-performing Airbnb properties in Newholm-cum-Dunsleybased on Trailing Twelve Month (TTM) revenue. Analyze their characteristics, revenue, occupancy rate, and ADR to understand what drives success in this market.

Sandsend Retreats
Entire Place • 9 bedrooms

Sandfield House
Entire Place • 4 bedrooms
East Hampton
Entire Place • 3 bedrooms
Host & Stay | Dunsley Chapel
Entire Place • 5 bedrooms
Stable Cottage
Entire Place • 2 bedrooms

oak Cottage - uk48269
Entire Place • 2 bedrooms
Note: Performance varies based on location, size, amenities, seasonality, and management quality. Data reflects the past 12 months.
Top Performing Airbnb Hosts in Newholm-cum-Dunsley (2026)
Learn from the best! This table showcases top-performing Airbnb hosts in Newholm-cum-Dunsley based on the number of properties managed and estimated total revenue over the past year. Analyze their scale and performance metrics.
| Host Name | Properties | Grossing Revenue | Stay Reviews | Avg Rating |
|---|---|---|---|---|
| Peter | 3 | $391,643 | 12 | 5.00/5.0 |
| Sandfield House Farm Ltd | 3 | $224,603 | 71 | 4.98/5.0 |
| Cottages | 2 | $85,323 | 6 | 5.00/5.0 |
| Host & Stay | 1 | $83,428 | 111 | 4.54/5.0 |
| Stella | 4 | $52,818 | 207 | 4.90/5.0 |
| Emily | 1 | $28,569 | 40 | 4.83/5.0 |
| Stays York | 3 | $21,260 | 84 | 4.68/5.0 |
| Lisa | 1 | $18,497 | 250 | 4.97/5.0 |
| Felicity | 1 | $3,236 | 14 | 4.71/5.0 |
Analyzing the strategies of top hosts, such as their property selection, pricing, and guest communication, can offer valuable lessons for optimizing your own Airbnb operations in Newholm-cum-Dunsley.
Dive Deeper: Advanced Newholm-cum-Dunsley STR Market Data (2026)
Ready to unlock more insights? AirROI provides access to advanced metrics and comprehensive Airbnb data for Newholm-cum-Dunsley. Explore detailed analytics beyond this report to refine your investment strategy, optimize pricing, and maximize your vacation rental profits.
Explore Advanced MetricsNewholm-cum-Dunsley Short-Term Rental Market Composition (2026): Property & Room Types
Room Type Distribution
Property Type Distribution
Market Composition Insights for Newholm-cum-Dunsley
- The Newholm-cum-Dunsley Airbnb market composition is heavily skewed towards Entire Home/Apt listings, which make up 100% of the 19 active rentals. This indicates strong guest preference for privacy and space.
- Looking at the property type distribution in Newholm-cum-Dunsley, House properties are the most common (73.7%), reflecting the local real estate landscape.
- Houses represent a significant 73.7% portion, catering likely to families or larger groups.
Newholm-cum-Dunsley Airbnb Room Capacity Analysis (2026): Bedroom Distribution
Distribution of Listings by Number of Bedrooms
Room Capacity Insights for Newholm-cum-Dunsley
- The dominant room capacity in Newholm-cum-Dunsley is 2 bedrooms listings, making up 52.6% of the market. This suggests a strong demand for properties suitable for couples or solo travelers.
- Together, 2 bedrooms and 3 bedrooms properties represent 68.4% of the active Airbnb listings in Newholm-cum-Dunsley, indicating a high concentration in these sizes.
- A significant 31.6% of listings offer 3+ bedrooms, catering to larger groups and families seeking more space in Newholm-cum-Dunsley.
Newholm-cum-Dunsley Vacation Rental Guest Capacity Trends (2026)
Distribution of Listings by Guest Capacity
Guest Capacity Insights for Newholm-cum-Dunsley
- The most common guest capacity trend in Newholm-cum-Dunsley vacation rentals is listings accommodating 4 guests (47.4%). This suggests the primary traveler segment is likely small families or groups.
- Properties designed for 4 guests and 6 guests dominate the Newholm-cum-Dunsley STR market, accounting for 68.5% of listings.
- 36.9% of properties accommodate 6+ guests, serving the market segment for larger families or group travel in Newholm-cum-Dunsley.
- On average, properties in Newholm-cum-Dunsley are equipped to host 4.7 guests.
Newholm-cum-Dunsley Airbnb Booking Patterns (2026): Available vs. Booked Days
Available Days Distribution
Booked Days Distribution
Booking Pattern Insights for Newholm-cum-Dunsley
- The most common availability pattern in Newholm-cum-Dunsley falls within the 181-270 days range, representing 42.1% of listings. This suggests many properties have significant open periods on their calendars.
- Approximately 73.7% of listings show high availability (181+ days open annually), indicating potential for increased bookings or specific owner usage patterns.
- For booked days, the 91-180 days range is most frequent in Newholm-cum-Dunsley (47.4%), reflecting common guest stay durations or potential owner blocking patterns.
- A notable 26.3% of properties secure long booking periods (181+ days booked per year), highlighting successful long-term rental strategies or significant owner usage.
Newholm-cum-Dunsley Airbnb Minimum Stay Requirements Analysis
Distribution of Listings by Minimum Night Requirement
1 Night
3 listings
15.8% of total
2 Nights
6 listings
31.6% of total
30+ Nights
10 listings
52.6% of total
Key Insights
- The most prevalent minimum stay requirement in Newholm-cum-Dunsley is 30+ Nights, adopted by 52.6% of listings. This highlights the market's preference for longer commitments.
- A significant segment (52.6%) caters to monthly stays (30+ nights) in Newholm-cum-Dunsley, pointing to opportunities in the extended-stay market.
Recommendations
- Align with the market by considering a 30+ Nights minimum stay, as 52.6% of Newholm-cum-Dunsley hosts use this setting.
- If feasible, allowing 1-night stays, especially midweek or during low season, could capture last-minute bookings, as only 15.8% currently do.
- A 2-night minimum appears standard (31.6%). Consider this for weekends or peak periods.
- Explore offering discounts for stays of 30+ nights to attract the 52.6% of the market seeking extended stays.
- Adjust minimum nights based on seasonality – potentially shorter during low season and longer during peak demand periods in Newholm-cum-Dunsley.
Newholm-cum-Dunsley Airbnb Cancellation Policy Trends Analysis (2026)
Super Strict 60 Days
2 listings
10.5% of total
Super Strict 30 Days
1 listings
5.3% of total
Flexible
1 listings
5.3% of total
Moderate
3 listings
15.8% of total
Firm
7 listings
36.8% of total
Strict
5 listings
26.3% of total
Cancellation Policy Insights for Newholm-cum-Dunsley
- The prevailing Airbnb cancellation policy trend in Newholm-cum-Dunsley is Firm, used by 36.8% of listings.
- A majority (63.1%) of hosts in Newholm-cum-Dunsley utilize Firm or Strict policies, indicating a market where hosts prioritize booking security.
Recommendations for Hosts
- Consider adopting a Firm policy to align with the 36.8% market standard in Newholm-cum-Dunsley.
- Regularly review your cancellation policy against competitors and market demand shifts in Newholm-cum-Dunsley.
Newholm-cum-Dunsley STR Booking Lead Time Analysis (2026)
Average Booking Lead Time by Month
Booking Lead Time Insights for Newholm-cum-Dunsley
- The overall average booking lead time for vacation rentals in Newholm-cum-Dunsley is 78 days.
- Guests book furthest in advance for stays during June (average 104 days), likely coinciding with peak travel demand or local events.
- The shortest booking windows occur for stays in February (average 23 days), indicating more last-minute travel plans during this time.
- Seasonally, Summer (98 days avg.) sees the longest lead times, while Winter (59 days avg.) has the shortest, reflecting typical travel planning cycles.
Recommendations for Hosts
- Use the overall average lead time (78 days) as a baseline for your pricing and availability strategy in Newholm-cum-Dunsley.
- For June stays, consider implementing length-of-stay discounts or slightly higher rates for bookings made less than 104 days out to capitalize on advance planning.
- Target marketing efforts for the Summer season well in advance (at least 98 days) to capture early planners.
- Monitor your own booking lead times against these Newholm-cum-Dunsley averages to identify opportunities for dynamic pricing adjustments.
Popular & Essential Airbnb Amenities in Newholm-cum-Dunsley (2026)
Amenity Prevalence
Amenity Insights for Newholm-cum-Dunsley
- Essential amenities in Newholm-cum-Dunsley that guests expect include: Kitchen, Heating, Smoke alarm, TV, Hangers. Lacking these (any) could significantly impact bookings.
- Popular amenities like Microwave, Free parking on premises, Refrigerator are common but not universal. Offering these can provide a competitive edge.
Recommendations for Hosts
- Ensure your listing includes all essential amenities for Newholm-cum-Dunsley: Kitchen, Heating, Smoke alarm, TV, Hangers.
- Consider adding popular differentiators like Microwave or Free parking on premises to increase appeal.
- Highlight unique or less common amenities you offer (e.g., hot tub, dedicated workspace, EV charger) in your listing description and photos.
- Regularly check competitor amenities in Newholm-cum-Dunsley to stay competitive.
Newholm-cum-Dunsley Airbnb Guest Demographics & Profile Analysis (2026)
Guest Profile Summary for Newholm-cum-Dunsley
- The typical guest profile for Airbnb in Newholm-cum-Dunsley consists of primarily domestic travelers (96%), often arriving from nearby England, typically belonging to the Post-2000s (Gen Z/Alpha) group (50%), primarily speaking English or French.
- Domestic travelers account for 95.6% of guests.
- Key international markets include United Kingdom (95.6%) and Australia (1.8%).
- Top languages spoken are English (88.5%) followed by French (3.8%).
- A significant demographic segment is the Post-2000s (Gen Z/Alpha) group, representing 50% of guests.
Recommendations for Hosts
- Target domestic marketing efforts towards travelers from England and London.
- Tailor amenities and listing descriptions to appeal to the dominant Post-2000s (Gen Z/Alpha) demographic (e.g., highlight fast WiFi, smart home features, local guides).
- Highlight unique local experiences or amenities relevant to the primary guest profile.
- Consider seasonal promotions aligned with peak travel times for key origin markets.
Nearby Short-Term Rental Market Comparison
How does the Newholm-cum-Dunsley Airbnb market stack up against its neighbors? Compare key performance metrics like average monthly revenue, ADR, and occupancy rates in surrounding areas to understand the broader regional STR landscape.
| Market | Active Properties | Monthly Revenue | Daily Rate | Avg. Occupancy |
|---|---|---|---|---|
| Stamford Bridge | 11 | $4,828 | $418.84 | 39% |
| Grinton | 12 | $4,363 | $338.85 | 48% |
| Ellingham | 12 | $4,350 | $318.71 | 51% |
| High Newton by the Sea | 19 | $4,216 | $506.29 | 39% |
| Tollerton | 12 | $4,121 | $303.75 | 52% |
| Holy Island | 14 | $4,102 | $326.39 | 58% |
| Huntington | 19 | $3,823 | $233.48 | 53% |
| Huggate | 10 | $3,763 | $279.44 | 47% |
| Bishop Monkton | 14 | $3,719 | $310.92 | 46% |
| Burythorpe | 10 | $3,534 | $189.99 | 57% |