North Norfolk Airbnb Market Analysis 2026: Short Term Rental Data & Vacation Rental Statistics in England, United Kingdom
Is Airbnb profitable in North Norfolk in 2026? Explore comprehensive Airbnb analytics for North Norfolk, England, United Kingdom to uncover income potential. This 2026 STR market report for North Norfolk, based on AirROI data from February 2025 to January 2026, reveals key trends in the bustling market of 2,218 active listings.
Whether you're considering an Airbnb investment in North Norfolk, optimizing your existing vacation rental, or exploring rental arbitrage opportunities, understanding the North Norfolk Airbnb data is crucial. Leveraging the low regulation environment is key to maximizing your short term rental income potential. Let's dive into the specifics.
Key North Norfolk Airbnb Performance Metrics Overview
Monthly Airbnb Revenue Variations & Income Potential in North Norfolk (2026)
Understanding the monthly revenue variations for Airbnb listings in North Norfolk is key to maximizing your short term rental income potential. Seasonality significantly impacts earnings. Our analysis, based on data from the past 12 months, shows that the peak revenue month for STRs in North Norfolk is typically August, while January often presents the lowest earnings, highlighting opportunities for strategic pricing adjustments during shoulder and low seasons. Explore the typical Airbnb income in North Norfolk across different performance tiers:
- Best-in-class properties (Top 10%) achieve $7,388+ monthly, often utilizing dynamic pricing and superior guest experiences.
- Strong performing properties (Top 25%) earn $4,450 or more, indicating effective management and desirable locations/amenities.
- Typical properties (Median) generate around $2,719 per month, representing the average market performance.
- Entry-level properties (Bottom 25%) see earnings around $1,549, often with potential for optimization.
Average Monthly Airbnb Earnings Trend in North Norfolk
North Norfolk Airbnb Occupancy Rate Trends (2026)
Maximize your bookings by understanding the North Norfolk STR occupancy trends. Seasonal demand shifts significantly influence how often properties are booked. Typically, Augustsees the highest demand (peak season occupancy), while January experiences the lowest (low season). Effective strategies, like adjusting minimum stays or offering promotions, can boost occupancy during slower periods. Here's how different property tiers perform in North Norfolk:
- Best-in-class properties (Top 10%) achieve 81%+ occupancy, indicating high desirability and potentially optimized availability.
- Strong performing properties (Top 25%) maintain 64% or higher occupancy, suggesting good market fit and guest satisfaction.
- Typical properties (Median) have an occupancy rate around 44%.
- Entry-level properties (Bottom 25%) average 23% occupancy, potentially facing higher vacancy.
Average Monthly Occupancy Rate Trend in North Norfolk
Average Daily Rate (ADR) Airbnb Trends in North Norfolk (2026)
Effective short term rental pricing strategy in North Norfolk involves understanding monthly ADR fluctuations. The Average Daily Rate (ADR) for Airbnb in North Norfolk typically peaks in September and dips lowest during March. Leveraging Airbnb dynamic pricing tools or strategies based on this seasonality can significantly boost revenue. Here's a look at the typical nightly rates achieved:
- Best-in-class properties (Top 10%) command rates of $550+ per night, often due to premium features or locations.
- Strong performing properties (Top 25%) achieve nightly rates of $344 or more.
- Typical properties (Median) charge around $217 per night.
- Entry-level properties (Bottom 25%) earn around $150 per night.
Average Daily Rate (ADR) Trend by Month in North Norfolk
Get Live North Norfolk Market Intelligence 👇

Explore Real-time Analytics
Airbnb Seasonality Analysis & Trends in North Norfolk (2026)
Peak Season (August, July, September)
- Revenue averages $5,290 per month
- Occupancy rates average 60.5%
- Daily rates average $315
Shoulder Season
- Revenue averages $3,600 per month
- Occupancy maintains around 43.6%
- Daily rates hold near $293
Low Season (January, February, November)
- Revenue drops to average $2,428 per month
- Occupancy decreases to average 32.3%
- Daily rates adjust to average $283
Seasonality Insights for North Norfolk
- The Airbnb seasonality in North Norfolk shows highly seasonal trends requiring careful strategy. While the sections above show seasonal averages, it's also insightful to look at the extremes:
- During the high season, the absolute peak month showcases North Norfolk's highest earning potential, with monthly revenues capable of climbing to $6,187, occupancy reaching a high of 67.9%, and ADRs peaking at $319.
- Conversely, the slowest single month of the year, typically falling within the low season, marks the market's lowest point. In this month, revenue might dip to $1,927, occupancy could drop to 24.4%, and ADRs may adjust down to $268.
- Understanding both the seasonal averages and these monthly peaks and troughs in revenue, occupancy, and ADR is crucial for maximizing your Airbnb profit potential in North Norfolk.
Seasonal Strategies for Maximizing Profit
- Peak Season: Maximize revenue through premium pricing and potentially longer minimum stays. Ensure high availability.
- Low Season: Offer competitive pricing, special promotions (e.g., extended stay discounts), and flexible cancellation policies. Target off-season travelers like remote workers or budget-conscious guests.
- Shoulder Seasons: Implement dynamic pricing that balances peak and low rates. Target weekend travelers or specific events. Offer slightly more flexible terms than peak season.
- Regularly analyze your own performance against these North Norfolk seasonality benchmarks and adjust your pricing and availability strategy accordingly.
Best Areas for Airbnb Investment in North Norfolk (2026)
Exploring the top neighborhoods for short-term rentals in North Norfolk? This section highlights key areas, outlining why they are attractive for hosts and guests, along with notable local attractions. Consider these locations based on your target guest profile and investment strategy.
| Neighborhood / Area | Why Host Here? (Target Guests & Appeal) | Key Attractions & Landmarks |
|---|---|---|
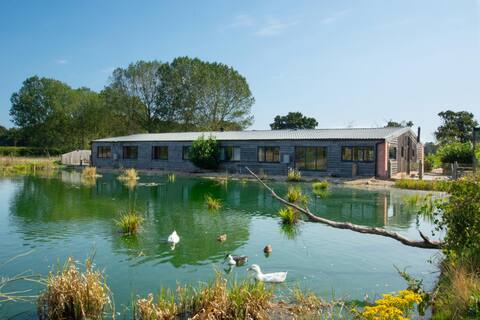
| Cromer | A charming coastal town known for its sandy beaches, famous for crabs. Ideal for families and beach lovers, with a lively pier and numerous local attractions. | Cromer Pier, Cromer Beach, Lifeboat Museum, RNLI Henry Blogg Museum, Cromer Carnival |
| Wells-next-the-Sea | A picturesque coastal town famous for its beautiful harbor and stunning beaches. Great for tourists interested in nature and coastal walks. | Wells Beach, Holkham National Nature Reserve, Wells-next-the-Sea Harbour, St Nicholas' Church, Pinewoods Holiday Park |
| Sheringham | A delightful seaside town with a mix of sandy and shingle beaches. Popular among families for its scenic beauty and local events. | Sheringham Beach, Sheringham Park, North Norfolk Railway, Sheringham Museum, The Mo Museum |
| Holt | A historic market town known for its charming architecture and boutique shopping. Attracts visitors seeking a quaint English town experience. | Holt Country Park, The Muckleburgh Collection, Holt Railway Station, St Andrew's Church, Holt Antiques |
| Burnham Market | An affluent village popular with tourists for its local shops and proximity to the coast. Great for upscale travelers looking for a unique stay. | Burnham Market Green, The Hoste, Burnham Overy Staithe Beach, Royal West Norfolk Golf Club, The Burnham Market Village Shop |
| Blakeney | A beautiful coastal village known for its stunning views and access to nature reserves. Ideal for bird watchers and nature enthusiasts. | Blakeney Point, Blakeney Harbour, Nature reserves, The Blakeney Hotel, St Nicholas Church |
| North Walsham | A historic market town providing easy access to a variety of attractions in North Norfolk. Good for travelers looking for a central location. | North Walsham Clock Tower, St Nicholas Church, Bacton Woods, Paston Great Barn, North Walsham Museum |
| Stiffkey | A small, picturesque village near the coast known for its stunning views and peaceful atmosphere, attracting nature lovers and walkers. | Stiffkey Marshes, St Mary the Virgin Church, Stiffkey Beach, Nature trails, Local cafes and pubs |
Understanding Airbnb License Requirements & STR Laws in North Norfolk (2026)
While North Norfolk, England, United Kingdom currently shows low STR regulations, specific Airbnb license requirements might still exist or change. Always verify the latest short term rental regulations and Airbnb license requirements directly with local government authorities for North Norfolk to ensure full compliance before hosting.
(Source: AirROI data, 2026, based on 0% licensed listings)
Top Performing Airbnb Properties in North Norfolk (2026)
Benchmark your potential! Explore examples of top-performing Airbnb properties in North Norfolkbased on Trailing Twelve Month (TTM) revenue. Analyze their characteristics, revenue, occupancy rate, and ADR to understand what drives success in this market.
10 Bed in Briston (oc-mjbrdb)
Entire Place • 10 bedrooms
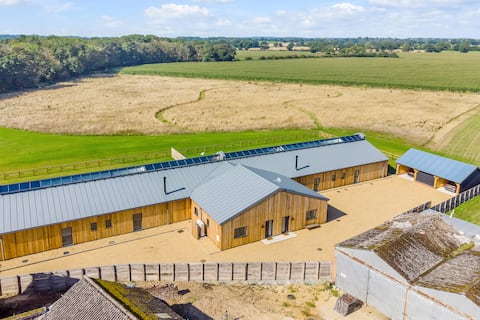
Sleeps 20 | Barn Conversion
Entire Place • 8 bedrooms

Coastal retreat, seaview, beach, hottub, EV charge
Entire Place • 8 bedrooms
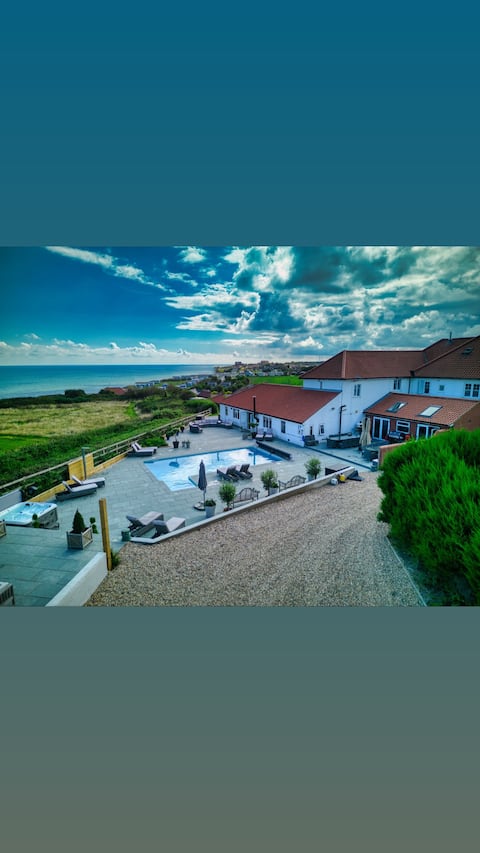
Sea View Manor, heated pool, hot tub, Beach access
Entire Place • 8 bedrooms
Luxury Coastal House for 16, Wells Next The Sea
Entire Place • 8 bedrooms
Overcliff Lodge Boutique Beachside Property
Entire Place • 12 bedrooms
Note: Performance varies based on location, size, amenities, seasonality, and management quality. Data reflects the past 12 months.
Top Performing Airbnb Hosts in North Norfolk (2026)
Learn from the best! This table showcases top-performing Airbnb hosts in North Norfolk based on the number of properties managed and estimated total revenue over the past year. Analyze their scale and performance metrics.
| Host Name | Properties | Grossing Revenue | Stay Reviews | Avg Rating |
|---|---|---|---|---|
| Norfolk Cottages | 195 | $9,560,148 | 590 | 4.65/5.0 |
| James | 110 | $6,282,430 | 742 | 4.84/5.0 |
| Cottages | 197 | $5,042,554 | 1656 | 4.75/5.0 |
| NorfolkStays | 5 | $994,941 | 564 | 4.71/5.0 |
| Host & Stay | 33 | $898,068 | 1025 | 4.65/5.0 |
| Michelle | 11 | $583,929 | 3142 | 4.81/5.0 |
| Holidaycottages.Co.Uk | 13 | $564,290 | 29 | 4.96/5.0 |
| Norfolk Holiday Rentals | 3 | $532,972 | 86 | 4.87/5.0 |
| Holidaycottages.Co.Uk | 13 | $528,191 | 33 | 4.72/5.0 |
| Alice | 6 | $515,316 | 203 | 4.96/5.0 |
Analyzing the strategies of top hosts, such as their property selection, pricing, and guest communication, can offer valuable lessons for optimizing your own Airbnb operations in North Norfolk.
Dive Deeper: Advanced North Norfolk STR Market Data (2026)
Ready to unlock more insights? AirROI provides access to advanced metrics and comprehensive Airbnb data for North Norfolk. Explore detailed analytics beyond this report to refine your investment strategy, optimize pricing, and maximize your vacation rental profits.
Explore Advanced MetricsNorth Norfolk Short-Term Rental Market Composition (2026): Property & Room Types
Room Type Distribution
Property Type Distribution
Market Composition Insights for North Norfolk
- The North Norfolk Airbnb market composition is heavily skewed towards Entire Home/Apt listings, which make up 93.9% of the 2,218 active rentals. This indicates strong guest preference for privacy and space.
- Looking at the property type distribution in North Norfolk, House properties are the most common (74.1%), reflecting the local real estate landscape.
- Houses represent a significant 74.1% portion, catering likely to families or larger groups.
- The presence of 5.3% Hotel/Boutique listings indicates integration with traditional hospitality.
- Smaller segments like unique stays, outdoor/unique, others (combined 11.9%) offer potential for unique stay experiences.
North Norfolk Airbnb Room Capacity Analysis (2026): Bedroom Distribution
Distribution of Listings by Number of Bedrooms
Room Capacity Insights for North Norfolk
- The dominant room capacity in North Norfolk is 2 bedrooms listings, making up 36.6% of the market. This suggests a strong demand for properties suitable for couples or solo travelers.
- Together, 2 bedrooms and 3 bedrooms properties represent 57.9% of the active Airbnb listings in North Norfolk, indicating a high concentration in these sizes.
- A significant 36.6% of listings offer 3+ bedrooms, catering to larger groups and families seeking more space in North Norfolk.
North Norfolk Vacation Rental Guest Capacity Trends (2026)
Distribution of Listings by Guest Capacity
Guest Capacity Insights for North Norfolk
- The most common guest capacity trend in North Norfolk vacation rentals is listings accommodating 4 guests (32.2%). This suggests the primary traveler segment is likely small families or groups.
- Properties designed for 4 guests and 6 guests dominate the North Norfolk STR market, accounting for 51.2% of listings.
- 35.0% of properties accommodate 6+ guests, serving the market segment for larger families or group travel in North Norfolk.
- On average, properties in North Norfolk are equipped to host 4.5 guests.
North Norfolk Airbnb Booking Patterns (2026): Available vs. Booked Days
Available Days Distribution
Booked Days Distribution
Booking Pattern Insights for North Norfolk
- The most common availability pattern in North Norfolk falls within the 271-366 days range, representing 42.1% of listings. This suggests many properties have significant open periods on their calendars.
- Approximately 74.5% of listings show high availability (181+ days open annually), indicating potential for increased bookings or specific owner usage patterns.
- For booked days, the 91-180 days range is most frequent in North Norfolk (32.2%), reflecting common guest stay durations or potential owner blocking patterns.
- A notable 27.3% of properties secure long booking periods (181+ days booked per year), highlighting successful long-term rental strategies or significant owner usage.
North Norfolk Airbnb Minimum Stay Requirements Analysis
Distribution of Listings by Minimum Night Requirement
1 Night
375 listings
16.9% of total
2 Nights
378 listings
17.1% of total
3 Nights
259 listings
11.7% of total
4-6 Nights
102 listings
4.6% of total
7-29 Nights
21 listings
0.9% of total
30+ Nights
1082 listings
48.8% of total
Key Insights
- The most prevalent minimum stay requirement in North Norfolk is 30+ Nights, adopted by 48.8% of listings. This highlights the market's preference for longer commitments.
- A significant segment (48.8%) caters to monthly stays (30+ nights) in North Norfolk, pointing to opportunities in the extended-stay market.
Recommendations
- Align with the market by considering a 30+ Nights minimum stay, as 48.8% of North Norfolk hosts use this setting.
- If feasible, allowing 1-night stays, especially midweek or during low season, could capture last-minute bookings, as only 16.9% currently do.
- Explore offering discounts for stays of 30+ nights to attract the 48.8% of the market seeking extended stays.
- Adjust minimum nights based on seasonality – potentially shorter during low season and longer during peak demand periods in North Norfolk.
North Norfolk Airbnb Cancellation Policy Trends Analysis (2026)
Super Strict 60 Days
514 listings
23.2% of total
Super Strict 30 Days
126 listings
5.7% of total
Refundable
7 listings
0.3% of total
Non-refundable
11 listings
0.5% of total
Limited
7 listings
0.3% of total
Flexible
240 listings
10.8% of total
Moderate
356 listings
16.1% of total
Firm
745 listings
33.7% of total
Strict
207 listings
9.4% of total
Cancellation Policy Insights for North Norfolk
- The prevailing Airbnb cancellation policy trend in North Norfolk is Firm, used by 33.7% of listings.
- There's a relatively balanced mix between guest-friendly (26.9%) and stricter (43.1%) policies, offering choices for different guest needs.
- Strict cancellation policies are quite rare (9.4%), potentially making listings with this policy less competitive unless justified by high demand or property type.
Recommendations for Hosts
- Consider adopting a Firm policy to align with the 33.7% market standard in North Norfolk.
- Using a Strict policy might deter some guests, as only 9.4% of listings use it. Evaluate if potential revenue protection outweighs possible lower booking rates.
- Regularly review your cancellation policy against competitors and market demand shifts in North Norfolk.
North Norfolk STR Booking Lead Time Analysis (2026)
Average Booking Lead Time by Month
Booking Lead Time Insights for North Norfolk
- The overall average booking lead time for vacation rentals in North Norfolk is 75 days.
- Guests book furthest in advance for stays during August (average 110 days), likely coinciding with peak travel demand or local events.
- The shortest booking windows occur for stays in February (average 46 days), indicating more last-minute travel plans during this time.
- Seasonally, Summer (90 days avg.) sees the longest lead times, while Winter (66 days avg.) has the shortest, reflecting typical travel planning cycles.
Recommendations for Hosts
- Use the overall average lead time (75 days) as a baseline for your pricing and availability strategy in North Norfolk.
- For August stays, consider implementing length-of-stay discounts or slightly higher rates for bookings made less than 110 days out to capitalize on advance planning.
- Target marketing efforts for the Summer season well in advance (at least 90 days) to capture early planners.
- Monitor your own booking lead times against these North Norfolk averages to identify opportunities for dynamic pricing adjustments.
Popular & Essential Airbnb Amenities in North Norfolk (2026)
Amenity Prevalence
Amenity Insights for North Norfolk
- Essential amenities in North Norfolk that guests expect include: Heating, Smoke alarm. Lacking these (any) could significantly impact bookings.
- Popular amenities like Wifi, TV, Kitchen are common but not universal. Offering these can provide a competitive edge.
- Warning: Wifi is not universally provided but is considered essential globally. Ensure reliable Wifi is offered.
Recommendations for Hosts
- Ensure your listing includes all essential amenities for North Norfolk: Heating, Smoke alarm.
- Prioritize adding missing essentials: Heating, Smoke alarm.
- Consider adding popular differentiators like Wifi or TV to increase appeal.
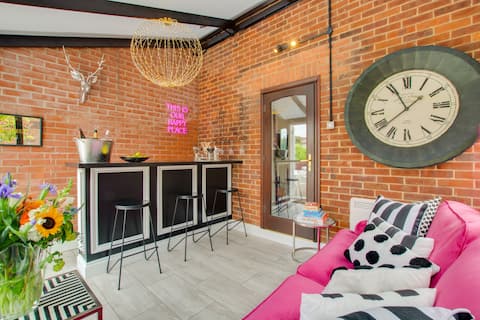
- Highlight unique or less common amenities you offer (e.g., hot tub, dedicated workspace, EV charger) in your listing description and photos.
- Regularly check competitor amenities in North Norfolk to stay competitive.
North Norfolk Airbnb Guest Demographics & Profile Analysis (2026)
Guest Profile Summary for North Norfolk
- The typical guest profile for Airbnb in North Norfolk consists of primarily domestic travelers (96%), often arriving from nearby England, typically belonging to the Post-2000s (Gen Z/Alpha) group (50%), primarily speaking English or French.
- Domestic travelers account for 96.3% of guests.
- Key international markets include United Kingdom (96.3%) and United States (1%).
- Top languages spoken are English (74.4%) followed by French (9%).
- A significant demographic segment is the Post-2000s (Gen Z/Alpha) group, representing 50% of guests.
Recommendations for Hosts
- Target domestic marketing efforts towards travelers from England and London.
- Tailor amenities and listing descriptions to appeal to the dominant Post-2000s (Gen Z/Alpha) demographic (e.g., highlight fast WiFi, smart home features, local guides).
- Highlight unique local experiences or amenities relevant to the primary guest profile.
- Consider seasonal promotions aligned with peak travel times for key origin markets.
Nearby Short-Term Rental Market Comparison
How does the North Norfolk Airbnb market stack up against its neighbors? Compare key performance metrics like average monthly revenue, ADR, and occupancy rates in surrounding areas to understand the broader regional STR landscape.
| Market | Active Properties | Monthly Revenue | Daily Rate | Avg. Occupancy |
|---|---|---|---|---|
| Epping Forest | 106 | $3,041 | $275.10 | 46% |
| Diksmuide | 49 | $2,992 | $319.73 | 37% |
| Braintree | 188 | $2,746 | $274.67 | 40% |
| Gistel | 11 | $2,723 | $241.22 | 38% |
| Sevenoaks | 172 | $2,708 | $282.06 | 42% |
| Uttlesford | 225 | $2,642 | $240.43 | 46% |
| King's Lynn and West Norfolk | 1,157 | $2,571 | $281.22 | 40% |
| Canterbury | 1,045 | $2,468 | $235.58 | 43% |
| Thanet | 1,104 | $2,438 | $237.81 | 41% |
| Zuydcoote | 11 | $2,435 | $190.92 | 49% |