Pembridge Airbnb Market Analysis 2026: Short Term Rental Data & Vacation Rental Statistics in England, United Kingdom
Is Airbnb profitable in Pembridge in 2026? Explore comprehensive Airbnb analytics for Pembridge, England, United Kingdom to uncover income potential. This 2026 STR market report for Pembridge, based on AirROI data from February 2025 to January 2026, reveals key trends in the niche market of 23 active listings.
Whether you're considering an Airbnb investment in Pembridge, optimizing your existing vacation rental, or exploring rental arbitrage opportunities, understanding the Pembridge Airbnb data is crucial. Leveraging the low regulation environment is key to maximizing your short term rental income potential. Let's dive into the specifics.
Key Pembridge Airbnb Performance Metrics Overview
Monthly Airbnb Revenue Variations & Income Potential in Pembridge (2026)
Understanding the monthly revenue variations for Airbnb listings in Pembridge is key to maximizing your short term rental income potential. Seasonality significantly impacts earnings. Our analysis, based on data from the past 12 months, shows that the peak revenue month for STRs in Pembridge is typically August, while September often presents the lowest earnings, highlighting opportunities for strategic pricing adjustments during shoulder and low seasons. Explore the typical Airbnb income in Pembridge across different performance tiers:
- Best-in-class properties (Top 10%) achieve $6,760+ monthly, often utilizing dynamic pricing and superior guest experiences.
- Strong performing properties (Top 25%) earn $4,248 or more, indicating effective management and desirable locations/amenities.
- Typical properties (Median) generate around $2,021 per month, representing the average market performance.
- Entry-level properties (Bottom 25%) see earnings around $792, often with potential for optimization.
Average Monthly Airbnb Earnings Trend in Pembridge
Pembridge Airbnb Occupancy Rate Trends (2026)
Maximize your bookings by understanding the Pembridge STR occupancy trends. Seasonal demand shifts significantly influence how often properties are booked. Typically, Augustsees the highest demand (peak season occupancy), while December experiences the lowest (low season). Effective strategies, like adjusting minimum stays or offering promotions, can boost occupancy during slower periods. Here's how different property tiers perform in Pembridge:
- Best-in-class properties (Top 10%) achieve 77%+ occupancy, indicating high desirability and potentially optimized availability.
- Strong performing properties (Top 25%) maintain 55% or higher occupancy, suggesting good market fit and guest satisfaction.
- Typical properties (Median) have an occupancy rate around 30%.
- Entry-level properties (Bottom 25%) average 13% occupancy, potentially facing higher vacancy.
Average Monthly Occupancy Rate Trend in Pembridge
Average Daily Rate (ADR) Airbnb Trends in Pembridge (2026)
Effective short term rental pricing strategy in Pembridge involves understanding monthly ADR fluctuations. The Average Daily Rate (ADR) for Airbnb in Pembridge typically peaks in December and dips lowest during March. Leveraging Airbnb dynamic pricing tools or strategies based on this seasonality can significantly boost revenue. Here's a look at the typical nightly rates achieved:
- Best-in-class properties (Top 10%) command rates of $624+ per night, often due to premium features or locations.
- Strong performing properties (Top 25%) achieve nightly rates of $357 or more.
- Typical properties (Median) charge around $242 per night.
- Entry-level properties (Bottom 25%) earn around $145 per night.
Average Daily Rate (ADR) Trend by Month in Pembridge
Get Live Pembridge Market Intelligence 👇
Explore Real-time Analytics
Airbnb Seasonality Analysis & Trends in Pembridge (2026)
Peak Season (August, April, July)
- Revenue averages $3,616 per month
- Occupancy rates average 46.1%
- Daily rates average $307
Shoulder Season
- Revenue averages $2,668 per month
- Occupancy maintains around 35.7%
- Daily rates hold near $305
Low Season (March, September, December)
- Revenue drops to average $2,347 per month
- Occupancy decreases to average 28.2%
- Daily rates adjust to average $306
Seasonality Insights for Pembridge
- The Airbnb seasonality in Pembridge shows highly seasonal trends requiring careful strategy. While the sections above show seasonal averages, it's also insightful to look at the extremes:
- During the high season, the absolute peak month showcases Pembridge's highest earning potential, with monthly revenues capable of climbing to $4,178, occupancy reaching a high of 53.4%, and ADRs peaking at $320.
- Conversely, the slowest single month of the year, typically falling within the low season, marks the market's lowest point. In this month, revenue might dip to $2,132, occupancy could drop to 26.0%, and ADRs may adjust down to $288.
- Understanding both the seasonal averages and these monthly peaks and troughs in revenue, occupancy, and ADR is crucial for maximizing your Airbnb profit potential in Pembridge.
Seasonal Strategies for Maximizing Profit
- Peak Season: Maximize revenue through premium pricing and potentially longer minimum stays. Ensure high availability.
- Low Season: Offer competitive pricing, special promotions (e.g., extended stay discounts), and flexible cancellation policies. Target off-season travelers like remote workers or budget-conscious guests.
- Shoulder Seasons: Implement dynamic pricing that balances peak and low rates. Target weekend travelers or specific events. Offer slightly more flexible terms than peak season.
- Regularly analyze your own performance against these Pembridge seasonality benchmarks and adjust your pricing and availability strategy accordingly.
Best Areas for Airbnb Investment in Pembridge (2026)
Exploring the top neighborhoods for short-term rentals in Pembridge? This section highlights key areas, outlining why they are attractive for hosts and guests, along with notable local attractions. Consider these locations based on your target guest profile and investment strategy.
| Neighborhood / Area | Why Host Here? (Target Guests & Appeal) | Key Attractions & Landmarks |
|---|---|---|
| Pembridge Village | Charming rural village known for its picturesque surroundings and historic architecture. Attracts visitors looking for a tranquil escape in the English countryside, making it a great spot for Airbnb hosts. | Pembridge Church, Old Market Hall, The Royal Oak Pub, Pembridge Village Hall, River Arrow |
| Lyonshall | Quaint village located close to Pembridge, ideal for those seeking a peaceful getaway. Offers beautiful landscapes and easy access to walking trails, appealing to nature lovers. | Lyonshall Castle, Wye Valley, Huntington Court Gardens, Local farms, Walking trails |
| Eardisley | Historic village that is a gateway to the Black Mountains, attracting outdoor enthusiasts. Offers a blend of history and nature, making it appealing to both tourists and locals. | Eardisley Castle, Brookspring Wood, St. Mary's Church, Local artisan shops, Nature walks |
| Kington | Nearby market town known for its vibrant community and access to the scenic Herefordshire countryside. Popular for those seeking both rural charm and local amenities. | Kington Museum, Hergest Ridge, Local markets, Kington Golf Club, The Old Chapel |
| Almeley | Scenic village with stunning rural landscape, perfect for visitors wanting to explore the Herefordshire nature. Great for families and couples looking for a quiet retreat. | Almeley Castle, The Church of St Mary, Cycle routes, Local pubs, Nature reserves |
| Weobley | Traditional black and white village that offers a rich history and cultural experiences. Popular among tourists interested in local heritage and walking tours. | Weobley Castle, The Old Surgery, Local art galleries, Historical buildings, Walking trails |
| Bredwardine | Picturesque village situated on the River Wye, ideal for fishing and water sports. Attracts those who love outdoor activities, especially water-related leisure. | Bredwardine Bridge, River Wye, The Red Lion Inn, Nature walks, Bird watching spots |
| Dorstone | Idyllic village set in a beautiful landscape, popular for its serene environment and the nearby Golden Valley. Perfect for those looking to escape city life. | Dorstone Church, Golden Valley, Herefordshire Beacon, Local farms, Hiking routes |
Understanding Airbnb License Requirements & STR Laws in Pembridge (2026)
While Pembridge, England, United Kingdom currently shows low STR regulations, specific Airbnb license requirements might still exist or change. Always verify the latest short term rental regulations and Airbnb license requirements directly with local government authorities for Pembridge to ensure full compliance before hosting.
(Source: AirROI data, 2026, finding no licensed listings among those analyzed)
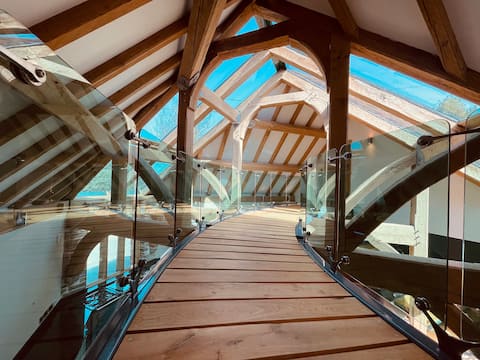
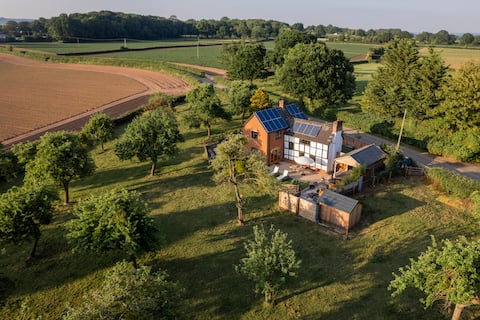
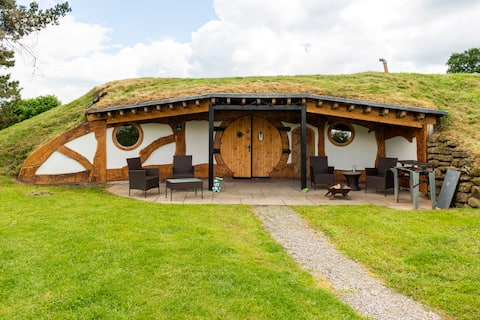
Top Performing Airbnb Properties in Pembridge (2026)
Benchmark your potential! Explore examples of top-performing Airbnb properties in Pembridgebased on Trailing Twelve Month (TTM) revenue. Analyze their characteristics, revenue, occupancy rate, and ADR to understand what drives success in this market.
Orchard Barn
Entire Place • 2 bedrooms
14th-CenturyWellness Retreat cottage Sauna Hot Tub
Entire Place • 2 bedrooms

The summer house
Entire Place • N/A

Kingfisher Cottage, Herefordshire
Entire Place • 3 bedrooms
Toad Hall
Entire Place • 3 bedrooms
Market House Barn and Retreat (for cozy weekends)
Entire Place • 1 bedroom
Note: Performance varies based on location, size, amenities, seasonality, and management quality. Data reflects the past 12 months.
Top Performing Airbnb Hosts in Pembridge (2026)
Learn from the best! This table showcases top-performing Airbnb hosts in Pembridge based on the number of properties managed and estimated total revenue over the past year. Analyze their scale and performance metrics.
| Host Name | Properties | Grossing Revenue | Stay Reviews | Avg Rating |
|---|---|---|---|---|
| Jacqui | 3 | $98,523 | 193 | 4.87/5.0 |
| Jasmine | 1 | $89,538 | 118 | 4.82/5.0 |
| Katie | 1 | $58,522 | 92 | 4.90/5.0 |
| Su | 3 | $54,743 | 163 | 4.82/5.0 |
| Emma | 1 | $49,740 | 45 | 4.96/5.0 |
| Peter | 2 | $31,858 | 9 | 4.67/5.0 |
| Chris | 2 | $29,073 | 50 | 4.88/5.0 |
| Nicola | 1 | $27,021 | 35 | 5.00/5.0 |
| Clare | 1 | $24,864 | 217 | 4.94/5.0 |
| Rural Retreats Holidays Ltd | 2 | $22,304 | 31 | 4.98/5.0 |
Analyzing the strategies of top hosts, such as their property selection, pricing, and guest communication, can offer valuable lessons for optimizing your own Airbnb operations in Pembridge.
Dive Deeper: Advanced Pembridge STR Market Data (2026)
Ready to unlock more insights? AirROI provides access to advanced metrics and comprehensive Airbnb data for Pembridge. Explore detailed analytics beyond this report to refine your investment strategy, optimize pricing, and maximize your vacation rental profits.
Explore Advanced MetricsPembridge Short-Term Rental Market Composition (2026): Property & Room Types
Room Type Distribution
Property Type Distribution
Market Composition Insights for Pembridge
- The Pembridge Airbnb market composition is heavily skewed towards Entire Home/Apt listings, which make up 87% of the 23 active rentals. This indicates strong guest preference for privacy and space.
- Looking at the property type distribution in Pembridge, House properties are the most common (69.6%), reflecting the local real estate landscape.
- Houses represent a significant 69.6% portion, catering likely to families or larger groups.
- Smaller segments like apartment/condo (combined 4.3%) offer potential for unique stay experiences.
Pembridge Airbnb Room Capacity Analysis (2026): Bedroom Distribution
Distribution of Listings by Number of Bedrooms
Room Capacity Insights for Pembridge
- The dominant room capacity in Pembridge is 1 bedroom listings, making up 26.1% of the market. This suggests a strong demand for properties suitable for couples or solo travelers.
- Together, 1 bedroom and 3 bedrooms properties represent 47.8% of the active Airbnb listings in Pembridge, indicating a high concentration in these sizes.
- A significant 30.4% of listings offer 3+ bedrooms, catering to larger groups and families seeking more space in Pembridge.
Pembridge Vacation Rental Guest Capacity Trends (2026)
Distribution of Listings by Guest Capacity
Guest Capacity Insights for Pembridge
- The most common guest capacity trend in Pembridge vacation rentals is listings accommodating 4 guests (26.1%). This suggests the primary traveler segment is likely small families or groups.
- Properties designed for 4 guests and 2 guests dominate the Pembridge STR market, accounting for 47.8% of listings.
- 26.1% of properties accommodate 6+ guests, serving the market segment for larger families or group travel in Pembridge.
- On average, properties in Pembridge are equipped to host 3.8 guests.
Pembridge Airbnb Booking Patterns (2026): Available vs. Booked Days
Available Days Distribution
Booked Days Distribution
Booking Pattern Insights for Pembridge
- The most common availability pattern in Pembridge falls within the 271-366 days range, representing 65.2% of listings. This suggests many properties have significant open periods on their calendars.
- Approximately 82.6% of listings show high availability (181+ days open annually), indicating potential for increased bookings or specific owner usage patterns.
- For booked days, the 1-30 days range is most frequent in Pembridge (34.8%), reflecting common guest stay durations or potential owner blocking patterns.
- A notable 17.4% of properties secure long booking periods (181+ days booked per year), highlighting successful long-term rental strategies or significant owner usage.
Pembridge Airbnb Minimum Stay Requirements Analysis
Distribution of Listings by Minimum Night Requirement
1 Night
3 listings
13% of total
2 Nights
6 listings
26.1% of total
3 Nights
2 listings
8.7% of total
30+ Nights
12 listings
52.2% of total
Key Insights
- The most prevalent minimum stay requirement in Pembridge is 30+ Nights, adopted by 52.2% of listings. This highlights the market's preference for longer commitments.
- A significant segment (52.2%) caters to monthly stays (30+ nights) in Pembridge, pointing to opportunities in the extended-stay market.
Recommendations
- Align with the market by considering a 30+ Nights minimum stay, as 52.2% of Pembridge hosts use this setting.
- If feasible, allowing 1-night stays, especially midweek or during low season, could capture last-minute bookings, as only 13% currently do.
- Explore offering discounts for stays of 30+ nights to attract the 52.2% of the market seeking extended stays.
- Adjust minimum nights based on seasonality – potentially shorter during low season and longer during peak demand periods in Pembridge.
Pembridge Airbnb Cancellation Policy Trends Analysis (2026)
Super Strict 60 Days
2 listings
8.7% of total
Flexible
1 listings
4.3% of total
Moderate
7 listings
30.4% of total
Firm
10 listings
43.5% of total
Strict
3 listings
13% of total
Cancellation Policy Insights for Pembridge
- The prevailing Airbnb cancellation policy trend in Pembridge is Firm, used by 43.5% of listings.
- A majority (56.5%) of hosts in Pembridge utilize Firm or Strict policies, indicating a market where hosts prioritize booking security.
Recommendations for Hosts
- Consider adopting a Firm policy to align with the 43.5% market standard in Pembridge.
- Using a Strict policy might deter some guests, as only 13% of listings use it. Evaluate if potential revenue protection outweighs possible lower booking rates.
- Regularly review your cancellation policy against competitors and market demand shifts in Pembridge.
Pembridge STR Booking Lead Time Analysis (2026)
Average Booking Lead Time by Month
Booking Lead Time Insights for Pembridge
- The overall average booking lead time for vacation rentals in Pembridge is 60 days.
- Guests book furthest in advance for stays during May (average 77 days), likely coinciding with peak travel demand or local events.
- The shortest booking windows occur for stays in March (average 27 days), indicating more last-minute travel plans during this time.
- Seasonally, Summer (64 days avg.) sees the longest lead times, while Spring (44 days avg.) has the shortest, reflecting typical travel planning cycles.
Recommendations for Hosts
- Use the overall average lead time (60 days) as a baseline for your pricing and availability strategy in Pembridge.
- For May stays, consider implementing length-of-stay discounts or slightly higher rates for bookings made less than 77 days out to capitalize on advance planning.
- Target marketing efforts for the Summer season well in advance (at least 64 days) to capture early planners.
- Monitor your own booking lead times against these Pembridge averages to identify opportunities for dynamic pricing adjustments.
Popular & Essential Airbnb Amenities in Pembridge (2026)
Amenity Prevalence
Amenity Insights for Pembridge
- Essential amenities in Pembridge that guests expect include: Heating, Hangers, Smoke alarm, Free parking on premises. Lacking these (any) could significantly impact bookings.
- Popular amenities like Hot water, TV, Iron are common but not universal. Offering these can provide a competitive edge.
- Warning: Wifi is not universally provided but is considered essential globally. Ensure reliable Wifi is offered.
Recommendations for Hosts
- Ensure your listing includes all essential amenities for Pembridge: Heating, Hangers, Smoke alarm, Free parking on premises.
- Prioritize adding missing essentials: Hangers, Smoke alarm, Free parking on premises.
- Consider adding popular differentiators like Hot water or TV to increase appeal.
- Highlight unique or less common amenities you offer (e.g., hot tub, dedicated workspace, EV charger) in your listing description and photos.
- Regularly check competitor amenities in Pembridge to stay competitive.
Pembridge Airbnb Guest Demographics & Profile Analysis (2026)
Guest Profile Summary for Pembridge
- The typical guest profile for Airbnb in Pembridge consists of primarily domestic travelers (94%), often arriving from nearby England, typically belonging to the Post-2000s (Gen Z/Alpha) group (50%), primarily speaking English or French.
- Domestic travelers account for 94.1% of guests.
- Key international markets include United Kingdom (94.1%) and France (1.2%).
- Top languages spoken are English (71.4%) followed by French (11.1%).
- A significant demographic segment is the Post-2000s (Gen Z/Alpha) group, representing 50% of guests.
Recommendations for Hosts
- Target domestic marketing efforts towards travelers from England and London.
- Tailor amenities and listing descriptions to appeal to the dominant Post-2000s (Gen Z/Alpha) demographic (e.g., highlight fast WiFi, smart home features, local guides).
- Highlight unique local experiences or amenities relevant to the primary guest profile.
- Consider seasonal promotions aligned with peak travel times for key origin markets.
Nearby Short-Term Rental Market Comparison
How does the Pembridge Airbnb market stack up against its neighbors? Compare key performance metrics like average monthly revenue, ADR, and occupancy rates in surrounding areas to understand the broader regional STR landscape.
| Market | Active Properties | Monthly Revenue | Daily Rate | Avg. Occupancy |
|---|---|---|---|---|
| Chew Magna | 13 | $7,041 | $430.65 | 44% |
| Englishcombe | 15 | $6,734 | $511.35 | 53% |
| Lambourn | 11 | $6,499 | $723.41 | 31% |
| East Knoyle | 10 | $6,300 | $407.06 | 44% |
| Long Sutton | 18 | $6,029 | $383.58 | 46% |
| Withington | 10 | $5,690 | $499.79 | 44% |
| Ashley | 13 | $5,497 | $364.68 | 54% |
| Bont-dolgadfan | 10 | $5,458 | $293.24 | 58% |
| Freshford | 12 | $5,333 | $317.81 | 58% |
| Grosmont | 11 | $5,211 | $459.67 | 55% |