Ponteland Airbnb Market Analysis 2026: Short Term Rental Data & Vacation Rental Statistics in England, United Kingdom
Is Airbnb profitable in Ponteland in 2026? Explore comprehensive Airbnb analytics for Ponteland, England, United Kingdom to uncover income potential. This 2026 STR market report for Ponteland, based on AirROI data from February 2025 to January 2026, reveals key trends in the niche market of 22 active listings.
Whether you're considering an Airbnb investment in Ponteland, optimizing your existing vacation rental, or exploring rental arbitrage opportunities, understanding the Ponteland Airbnb data is crucial. Leveraging the low regulation environment is key to maximizing your short term rental income potential. Let's dive into the specifics.
Key Ponteland Airbnb Performance Metrics Overview
Monthly Airbnb Revenue Variations & Income Potential in Ponteland (2026)
Understanding the monthly revenue variations for Airbnb listings in Ponteland is key to maximizing your short term rental income potential. Seasonality significantly impacts earnings. Our analysis, based on data from the past 12 months, shows that the peak revenue month for STRs in Ponteland is typically August, while January often presents the lowest earnings, highlighting opportunities for strategic pricing adjustments during shoulder and low seasons. Explore the typical Airbnb income in Ponteland across different performance tiers:
- Best-in-class properties (Top 10%) achieve $3,029+ monthly, often utilizing dynamic pricing and superior guest experiences.
- Strong performing properties (Top 25%) earn $1,880 or more, indicating effective management and desirable locations/amenities.
- Typical properties (Median) generate around $1,201 per month, representing the average market performance.
- Entry-level properties (Bottom 25%) see earnings around $639, often with potential for optimization.
Average Monthly Airbnb Earnings Trend in Ponteland
Ponteland Airbnb Occupancy Rate Trends (2026)
Maximize your bookings by understanding the Ponteland STR occupancy trends. Seasonal demand shifts significantly influence how often properties are booked. Typically, Julysees the highest demand (peak season occupancy), while January experiences the lowest (low season). Effective strategies, like adjusting minimum stays or offering promotions, can boost occupancy during slower periods. Here's how different property tiers perform in Ponteland:
- Best-in-class properties (Top 10%) achieve 66%+ occupancy, indicating high desirability and potentially optimized availability.
- Strong performing properties (Top 25%) maintain 50% or higher occupancy, suggesting good market fit and guest satisfaction.
- Typical properties (Median) have an occupancy rate around 36%.
- Entry-level properties (Bottom 25%) average 20% occupancy, potentially facing higher vacancy.
Average Monthly Occupancy Rate Trend in Ponteland
Average Daily Rate (ADR) Airbnb Trends in Ponteland (2026)
Effective short term rental pricing strategy in Ponteland involves understanding monthly ADR fluctuations. The Average Daily Rate (ADR) for Airbnb in Ponteland typically peaks in October and dips lowest during September. Leveraging Airbnb dynamic pricing tools or strategies based on this seasonality can significantly boost revenue. Here's a look at the typical nightly rates achieved:
- Best-in-class properties (Top 10%) command rates of $227+ per night, often due to premium features or locations.
- Strong performing properties (Top 25%) achieve nightly rates of $142 or more.
- Typical properties (Median) charge around $120 per night.
- Entry-level properties (Bottom 25%) earn around $86 per night.
Average Daily Rate (ADR) Trend by Month in Ponteland
Get Live Ponteland Market Intelligence 👇

Explore Real-time Analytics
Airbnb Seasonality Analysis & Trends in Ponteland (2026)
Peak Season (August, July, September)
- Revenue averages $2,107 per month
- Occupancy rates average 47.1%
- Daily rates average $131
Shoulder Season
- Revenue averages $1,531 per month
- Occupancy maintains around 35.7%
- Daily rates hold near $140
Low Season (January, April, June)
- Revenue drops to average $1,215 per month
- Occupancy decreases to average 29.1%
- Daily rates adjust to average $137
Seasonality Insights for Ponteland
- The Airbnb seasonality in Ponteland shows moderate seasonality with distinct peak and low periods. While the sections above show seasonal averages, it's also insightful to look at the extremes:
- During the high season, the absolute peak month showcases Ponteland's highest earning potential, with monthly revenues capable of climbing to $2,207, occupancy reaching a high of 49.1%, and ADRs peaking at $151.
- Conversely, the slowest single month of the year, typically falling within the low season, marks the market's lowest point. In this month, revenue might dip to $1,110, occupancy could drop to 27.4%, and ADRs may adjust down to $125.
- Understanding both the seasonal averages and these monthly peaks and troughs in revenue, occupancy, and ADR is crucial for maximizing your Airbnb profit potential in Ponteland.
Seasonal Strategies for Maximizing Profit
- Peak Season: Maximize revenue through premium pricing and potentially longer minimum stays. Ensure high availability.
- Low Season: Offer competitive pricing, special promotions (e.g., extended stay discounts), and flexible cancellation policies. Target off-season travelers like remote workers or budget-conscious guests.
- Shoulder Seasons: Implement dynamic pricing that balances peak and low rates. Target weekend travelers or specific events. Offer slightly more flexible terms than peak season.
- Regularly analyze your own performance against these Ponteland seasonality benchmarks and adjust your pricing and availability strategy accordingly.
Best Areas for Airbnb Investment in Ponteland (2026)
Exploring the top neighborhoods for short-term rentals in Ponteland? This section highlights key areas, outlining why they are attractive for hosts and guests, along with notable local attractions. Consider these locations based on your target guest profile and investment strategy.
| Neighborhood / Area | Why Host Here? (Target Guests & Appeal) | Key Attractions & Landmarks |
|---|---|---|
| Ponteland Village | A picturesque village with charming homes, boutiques, and restaurants. Ideal for guests looking for a peaceful retreat close to the countryside and Newcastle. | St. Mary’s Church, Ponteland Park, Denton Hall, Ponteland Golf Club, local shops and cafes |
| Eldon Square | Located in nearby Newcastle, Eldon Square is a bustling shopping and dining area. Great for guests who want to experience the urban life of Newcastle while staying near Ponteland. | Eldon Square Shopping Centre, Eldon Square Art Gallery, Newcastle Cathedral, Grey Street, Theatre Royal |
| Heaton | A trendy suburb of Newcastle known for its vibrant arts scene and cultural diversity. Attractive to younger guests and those looking for nightlife options. | Heaton Park, Ouseburn Valley, The Cluny Pub, Heaton Road restaurants, The Biscuit Factory |
| Quayside | Near the River Tyne, this area is famous for its iconic bridges and waterfront restaurants. A sought-after location for travelers wanting scenic views and night life. | Tyne Bridge, Gateshead Millennium Bridge, BALTIC Centre for Contemporary Art, Quayside Market, numerous restaurants and pubs |
| Jesmond | A desirable neighborhood in Newcastle, known for its gardens, cafes, and proximity to the city center. Perfect for families and young professionals alike. | Jesmond Dene Park, Jesmond Metro Station, Ouseburn River, Littletown Park, local dining spots |
| Newcastle City Centre | The heart of the city with its rich history, shopping, and vibrant nightlife. Perfect for those who want to be in the midst of the action. | Eldon Square, St. James' Park, Newcastle Castle, Grainger Town, The Sage Gateshead |
| Northumberland National Park | An area of outstanding natural beauty, perfect for guests who want outdoor adventures and a peaceful environment. Great for hikers and nature lovers. | Hadrian's Wall, Kielder Water, Cheviot Hills, local wildlife, beautiful landscapes |
| Blagdon | A quiet village with beautiful countryside surroundings, perfect for those looking to escape the bustling city life. Great for relaxing getaways. | Blagdon Lake, local farms, nature trails, peaceful scenery, community events |
Understanding Airbnb License Requirements & STR Laws in Ponteland (2026)
While Ponteland, England, United Kingdom currently shows low STR regulations, specific Airbnb license requirements might still exist or change. Always verify the latest short term rental regulations and Airbnb license requirements directly with local government authorities for Ponteland to ensure full compliance before hosting.
(Source: AirROI data, 2026, finding no licensed listings among those analyzed)
Top Performing Airbnb Properties in Ponteland (2026)
Benchmark your potential! Explore examples of top-performing Airbnb properties in Pontelandbased on Trailing Twelve Month (TTM) revenue. Analyze their characteristics, revenue, occupancy rate, and ADR to understand what drives success in this market.

Luxury Shepherd Hut, Hot Tub, Northumberland
Entire Place • 1 bedroom
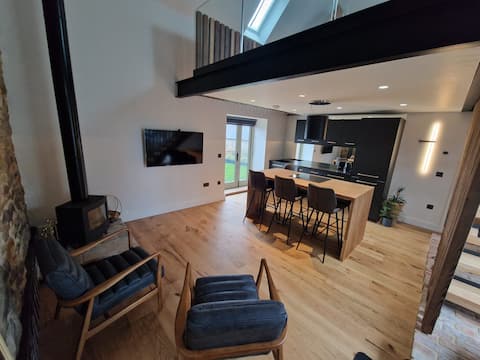
Unique Barn Conversion
Entire Place • 1 bedroom
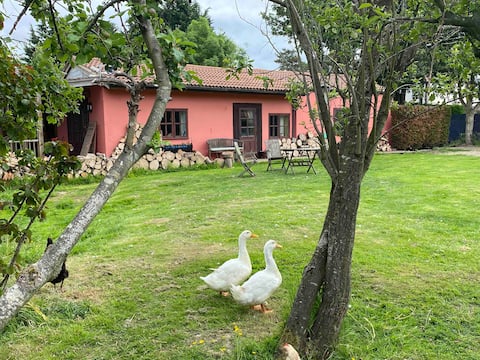
Lake lodge Retreat- studio, log burner and lake
Private Room • 1 bedroom

Diamond Inn- Rm8 Deluxe Dbl
Private Room • 1 bedroom

Diamond Inn. Rm 4 Dbl
Private Room • 1 bedroom
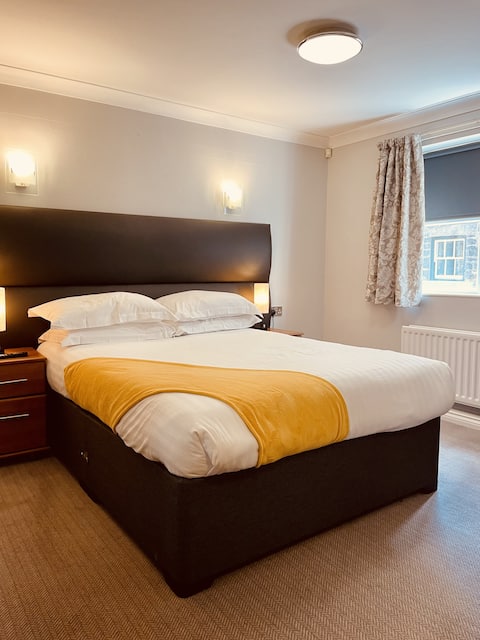
Diamond Inn-Rm7 Double
Private Room • N/A
Note: Performance varies based on location, size, amenities, seasonality, and management quality. Data reflects the past 12 months.
Top Performing Airbnb Hosts in Ponteland (2026)
Learn from the best! This table showcases top-performing Airbnb hosts in Ponteland based on the number of properties managed and estimated total revenue over the past year. Analyze their scale and performance metrics.
| Host Name | Properties | Grossing Revenue | Stay Reviews | Avg Rating |
|---|---|---|---|---|
| Connor | 9 | $124,536 | 54 | 4.75/5.0 |
| Louise | 1 | $83,409 | 57 | 5.00/5.0 |
| James (And Mark) | 1 | $31,207 | 76 | 4.92/5.0 |
| Kevin | 5 | $29,426 | 75 | 4.80/5.0 |
| Kevin | 1 | $21,732 | 195 | 4.88/5.0 |
| Jafar | 1 | $12,497 | 3 | 5.00/5.0 |
| Cottages | 1 | $2,940 | 4 | 4.25/5.0 |
| Gina | 1 | $2,678 | 15 | 4.53/5.0 |
| Graeme | 1 | $2,048 | 56 | 4.96/5.0 |
| Carolyn | 1 | $490 | 49 | 4.92/5.0 |
Analyzing the strategies of top hosts, such as their property selection, pricing, and guest communication, can offer valuable lessons for optimizing your own Airbnb operations in Ponteland.
Dive Deeper: Advanced Ponteland STR Market Data (2026)
Ready to unlock more insights? AirROI provides access to advanced metrics and comprehensive Airbnb data for Ponteland. Explore detailed analytics beyond this report to refine your investment strategy, optimize pricing, and maximize your vacation rental profits.
Explore Advanced MetricsPonteland Short-Term Rental Market Composition (2026): Property & Room Types
Room Type Distribution
Property Type Distribution
Market Composition Insights for Ponteland
- The Ponteland Airbnb market composition is heavily skewed towards Private Room listings, which make up 72.7% of the 22 active rentals. This indicates strong guest preference for privacy and space.
- Looking at the property type distribution in Ponteland, Hotel/Boutique properties are the most common (68.2%), reflecting the local real estate landscape.
- The presence of 68.2% Hotel/Boutique listings indicates integration with traditional hospitality.
- Smaller segments like apartment/condo, unique stays, others (combined 13.5%) offer potential for unique stay experiences.
Ponteland Airbnb Room Capacity Analysis (2026): Bedroom Distribution
Distribution of Listings by Number of Bedrooms
Room Capacity Insights for Ponteland
- The dominant room capacity in Ponteland is 1 bedroom listings, making up 45.5% of the market. This suggests a strong demand for properties suitable for couples or solo travelers.
- Together, 1 bedroom and 5+ bedrooms properties represent 63.7% of the active Airbnb listings in Ponteland, indicating a high concentration in these sizes.
- A significant 22.7% of listings offer 3+ bedrooms, catering to larger groups and families seeking more space in Ponteland.
Ponteland Vacation Rental Guest Capacity Trends (2026)
Distribution of Listings by Guest Capacity
Guest Capacity Insights for Ponteland
- The most common guest capacity trend in Ponteland vacation rentals is listings accommodating 2 guests (50%). This suggests the primary traveler segment is likely couples or solo travelers.
- Properties designed for 2 guests and 4 guests dominate the Ponteland STR market, accounting for 54.5% of listings.
- A significant 50.0% of listings cater specifically to 1-2 guests, highlighting strong demand from couples and solo travelers in Ponteland.
- Listings for large groups (6+ guests) are relatively rare (4.5%), potentially indicating an opportunity for hosts targeting this segment in Ponteland.
- On average, properties in Ponteland are equipped to host 1.5 guests.
Ponteland Airbnb Booking Patterns (2026): Available vs. Booked Days
Available Days Distribution
Booked Days Distribution
Booking Pattern Insights for Ponteland
- The most common availability pattern in Ponteland falls within the 271-366 days range, representing 50% of listings. This suggests many properties have significant open periods on their calendars.
- Approximately 90.9% of listings show high availability (181+ days open annually), indicating potential for increased bookings or specific owner usage patterns.
- For booked days, the 91-180 days range is most frequent in Ponteland (40.9%), reflecting common guest stay durations or potential owner blocking patterns.
- A notable 9.1% of properties secure long booking periods (181+ days booked per year), highlighting successful long-term rental strategies or significant owner usage.
Ponteland Airbnb Minimum Stay Requirements Analysis
Distribution of Listings by Minimum Night Requirement
1 Night
20 listings
90.9% of total
2 Nights
1 listings
4.5% of total
7-29 Nights
1 listings
4.5% of total
Key Insights
- The most prevalent minimum stay requirement in Ponteland is 1 Night, adopted by 90.9% of listings. This highlights the market's preference for shorter, flexible bookings.
- A strong majority (95.4%) of the Ponteland Airbnb data shows acceptance of very short stays (1-2 nights), indicating a dynamic, high-turnover market.
Recommendations
- Align with the market by considering a 1 Night minimum stay, as 90.9% of Ponteland hosts use this setting.
- Adjust minimum nights based on seasonality – potentially shorter during low season and longer during peak demand periods in Ponteland.
Ponteland Airbnb Cancellation Policy Trends Analysis (2026)
Super Strict 60 Days
1 listings
4.5% of total
Flexible
3 listings
13.6% of total
Moderate
10 listings
45.5% of total
Firm
6 listings
27.3% of total
Strict
2 listings
9.1% of total
Cancellation Policy Insights for Ponteland
- The prevailing Airbnb cancellation policy trend in Ponteland is Moderate, used by 45.5% of listings.
- There's a relatively balanced mix between guest-friendly (59.1%) and stricter (36.4%) policies, offering choices for different guest needs.
- Strict cancellation policies are quite rare (9.1%), potentially making listings with this policy less competitive unless justified by high demand or property type.
Recommendations for Hosts
- Consider adopting a Moderate policy to align with the 45.5% market standard in Ponteland.
- Using a Strict policy might deter some guests, as only 9.1% of listings use it. Evaluate if potential revenue protection outweighs possible lower booking rates.
- Regularly review your cancellation policy against competitors and market demand shifts in Ponteland.
Ponteland STR Booking Lead Time Analysis (2026)
Average Booking Lead Time by Month
Booking Lead Time Insights for Ponteland
- The overall average booking lead time for vacation rentals in Ponteland is 63 days.
- Guests book furthest in advance for stays during September (average 106 days), likely coinciding with peak travel demand or local events.
- The shortest booking windows occur for stays in March (average 34 days), indicating more last-minute travel plans during this time.
- Seasonally, Fall (74 days avg.) sees the longest lead times, while Spring (53 days avg.) has the shortest, reflecting typical travel planning cycles.
Recommendations for Hosts
- Use the overall average lead time (63 days) as a baseline for your pricing and availability strategy in Ponteland.
- For September stays, consider implementing length-of-stay discounts or slightly higher rates for bookings made less than 106 days out to capitalize on advance planning.
- Target marketing efforts for the Fall season well in advance (at least 74 days) to capture early planners.
- Monitor your own booking lead times against these Ponteland averages to identify opportunities for dynamic pricing adjustments.
Popular & Essential Airbnb Amenities in Ponteland (2026)
Amenity Prevalence
Amenity Insights for Ponteland
- Essential amenities in Ponteland that guests expect include: Heating, Hangers, Essentials, Smoke alarm, Free parking on premises, Wifi, TV. Lacking these (any) could significantly impact bookings.
- Popular amenities like Hot water, Hair dryer, Luggage dropoff allowed are common but not universal. Offering these can provide a competitive edge.
Recommendations for Hosts
- Ensure your listing includes all essential amenities for Ponteland: Heating, Hangers, Essentials, Smoke alarm, Free parking on premises, Wifi, TV.
- Prioritize adding missing essentials: Hangers, Essentials, Smoke alarm, Free parking on premises, Wifi, TV.
- Consider adding popular differentiators like Hot water or Hair dryer to increase appeal.
- Highlight unique or less common amenities you offer (e.g., hot tub, dedicated workspace, EV charger) in your listing description and photos.
- Regularly check competitor amenities in Ponteland to stay competitive.
Ponteland Airbnb Guest Demographics & Profile Analysis (2026)
Guest Profile Summary for Ponteland
- The typical guest profile for Airbnb in Ponteland consists of primarily domestic travelers (87%), often arriving from nearby England, typically belonging to the Post-2000s (Gen Z/Alpha) group (50%), primarily speaking English or Spanish.
- Domestic travelers account for 87.3% of guests.
- Key international markets include United Kingdom (87.3%) and Denmark (1.6%).
- Top languages spoken are English (65.5%) followed by Spanish (17.2%).
- A significant demographic segment is the Post-2000s (Gen Z/Alpha) group, representing 50% of guests.
Recommendations for Hosts
- Target domestic marketing efforts towards travelers from England and Newcastle upon Tyne.
- Tailor amenities and listing descriptions to appeal to the dominant Post-2000s (Gen Z/Alpha) demographic (e.g., highlight fast WiFi, smart home features, local guides).
- Highlight unique local experiences or amenities relevant to the primary guest profile.
- Consider seasonal promotions aligned with peak travel times for key origin markets.
Nearby Short-Term Rental Market Comparison
How does the Ponteland Airbnb market stack up against its neighbors? Compare key performance metrics like average monthly revenue, ADR, and occupancy rates in surrounding areas to understand the broader regional STR landscape.
| Market | Active Properties | Monthly Revenue | Daily Rate | Avg. Occupancy |
|---|---|---|---|---|
| Cartmel Fell | 23 | $4,560 | $364.59 | 48% |
| Burneside | 10 | $4,526 | $331.60 | 54% |
| Grinton | 12 | $4,363 | $338.85 | 48% |
| Ellingham | 12 | $4,350 | $318.71 | 51% |
| Leuchars | 14 | $4,242 | $440.14 | 40% |
| Bowness-on-Windermere | 358 | $4,223 | $357.92 | 45% |
| High Newton by the Sea | 19 | $4,216 | $506.29 | 39% |
| Hayton | 16 | $4,173 | $258.03 | 57% |
| Tollerton | 12 | $4,121 | $303.75 | 52% |
| Holy Island | 14 | $4,102 | $326.39 | 58% |