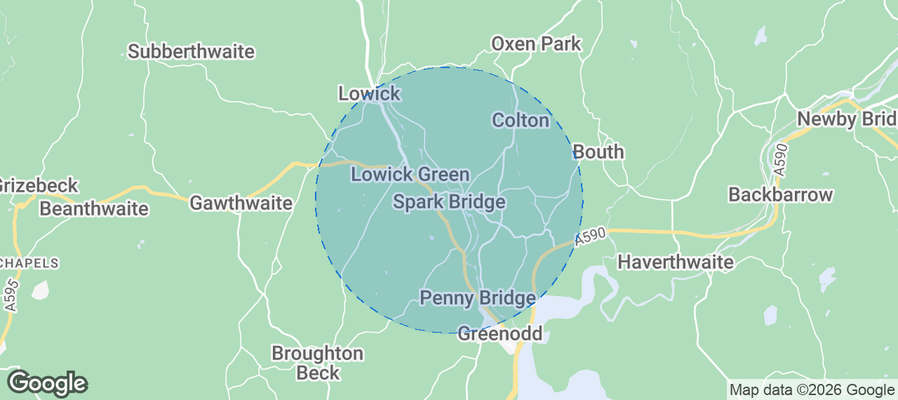
Spark Bridge Airbnb Market Analysis 2026: Short Term Rental Data & Vacation Rental Statistics in England, United Kingdom
Is Airbnb profitable in Spark Bridge in 2026? Explore comprehensive Airbnb analytics for Spark Bridge, England, United Kingdom to uncover income potential. This 2026 STR market report for Spark Bridge, based on AirROI data from February 2025 to January 2026, reveals key trends in the niche market of 18 active listings.
Whether you're considering an Airbnb investment in Spark Bridge, optimizing your existing vacation rental, or exploring rental arbitrage opportunities, understanding the Spark Bridge Airbnb data is crucial. Leveraging the low regulation environment is key to maximizing your short term rental income potential. Let's dive into the specifics.
Key Spark Bridge Airbnb Performance Metrics Overview
Monthly Airbnb Revenue Variations & Income Potential in Spark Bridge (2026)
Understanding the monthly revenue variations for Airbnb listings in Spark Bridge is key to maximizing your short term rental income potential. Seasonality significantly impacts earnings. Our analysis, based on data from the past 12 months, shows that the peak revenue month for STRs in Spark Bridge is typically August, while January often presents the lowest earnings, highlighting opportunities for strategic pricing adjustments during shoulder and low seasons. Explore the typical Airbnb income in Spark Bridge across different performance tiers:
- Best-in-class properties (Top 10%) achieve $4,808+ monthly, often utilizing dynamic pricing and superior guest experiences.
- Strong performing properties (Top 25%) earn $2,936 or more, indicating effective management and desirable locations/amenities.
- Typical properties (Median) generate around $1,851 per month, representing the average market performance.
- Entry-level properties (Bottom 25%) see earnings around $643, often with potential for optimization.
Average Monthly Airbnb Earnings Trend in Spark Bridge
Spark Bridge Airbnb Occupancy Rate Trends (2026)
Maximize your bookings by understanding the Spark Bridge STR occupancy trends. Seasonal demand shifts significantly influence how often properties are booked. Typically, Augustsees the highest demand (peak season occupancy), while January experiences the lowest (low season). Effective strategies, like adjusting minimum stays or offering promotions, can boost occupancy during slower periods. Here's how different property tiers perform in Spark Bridge:
- Best-in-class properties (Top 10%) achieve 71%+ occupancy, indicating high desirability and potentially optimized availability.
- Strong performing properties (Top 25%) maintain 51% or higher occupancy, suggesting good market fit and guest satisfaction.
- Typical properties (Median) have an occupancy rate around 35%.
- Entry-level properties (Bottom 25%) average 22% occupancy, potentially facing higher vacancy.
Average Monthly Occupancy Rate Trend in Spark Bridge
Average Daily Rate (ADR) Airbnb Trends in Spark Bridge (2026)
Effective short term rental pricing strategy in Spark Bridge involves understanding monthly ADR fluctuations. The Average Daily Rate (ADR) for Airbnb in Spark Bridge typically peaks in August and dips lowest during November. Leveraging Airbnb dynamic pricing tools or strategies based on this seasonality can significantly boost revenue. Here's a look at the typical nightly rates achieved:
- Best-in-class properties (Top 10%) command rates of $434+ per night, often due to premium features or locations.
- Strong performing properties (Top 25%) achieve nightly rates of $254 or more.
- Typical properties (Median) charge around $168 per night.
- Entry-level properties (Bottom 25%) earn around $141 per night.
Average Daily Rate (ADR) Trend by Month in Spark Bridge
Get Live Spark Bridge Market Intelligence 👇
Explore Real-time Analytics
Airbnb Seasonality Analysis & Trends in Spark Bridge (2026)
Peak Season (August, July, June)
- Revenue averages $3,261 per month
- Occupancy rates average 52.4%
- Daily rates average $238
Shoulder Season
- Revenue averages $2,294 per month
- Occupancy maintains around 37.0%
- Daily rates hold near $212
Low Season (January, November, December)
- Revenue drops to average $1,276 per month
- Occupancy decreases to average 26.9%
- Daily rates adjust to average $191
Seasonality Insights for Spark Bridge
- The Airbnb seasonality in Spark Bridge shows highly seasonal trends requiring careful strategy. While the sections above show seasonal averages, it's also insightful to look at the extremes:
- During the high season, the absolute peak month showcases Spark Bridge's highest earning potential, with monthly revenues capable of climbing to $3,592, occupancy reaching a high of 61.8%, and ADRs peaking at $243.
- Conversely, the slowest single month of the year, typically falling within the low season, marks the market's lowest point. In this month, revenue might dip to $928, occupancy could drop to 17.5%, and ADRs may adjust down to $187.
- Understanding both the seasonal averages and these monthly peaks and troughs in revenue, occupancy, and ADR is crucial for maximizing your Airbnb profit potential in Spark Bridge.
Seasonal Strategies for Maximizing Profit
- Peak Season: Maximize revenue through premium pricing and potentially longer minimum stays. Ensure high availability.
- Low Season: Offer competitive pricing, special promotions (e.g., extended stay discounts), and flexible cancellation policies. Target off-season travelers like remote workers or budget-conscious guests.
- Shoulder Seasons: Implement dynamic pricing that balances peak and low rates. Target weekend travelers or specific events. Offer slightly more flexible terms than peak season.
- Regularly analyze your own performance against these Spark Bridge seasonality benchmarks and adjust your pricing and availability strategy accordingly.
Best Areas for Airbnb Investment in Spark Bridge (2026)
Exploring the top neighborhoods for short-term rentals in Spark Bridge? This section highlights key areas, outlining why they are attractive for hosts and guests, along with notable local attractions. Consider these locations based on your target guest profile and investment strategy.
| Neighborhood / Area | Why Host Here? (Target Guests & Appeal) | Key Attractions & Landmarks |
|---|---|---|
| Lake District | A UNESCO World Heritage site known for its stunning lakes and mountains. Popular with tourists looking to hike and enjoy nature, making it ideal for Airbnb hosting. | Windermere, Derwentwater, Scafell Pike, Grasmere, Helvellyn, Beatrix Potter's Hill Top |
| York | A historic city with a vibrant cultural scene, attracting visitors to its medieval architecture and rich heritage. Ideal for those seeking a unique historical experience. | York Minster, The Shambles, National Railway Museum, York Castle Museum, Clifford's Tower, Jorvik Viking Centre |
| Bath | Known for its Roman baths and Georgian architecture, Bath is a UNESCO World Heritage site that attracts both history buffs and wellness seekers. | Roman Baths, Bath Abbey, The Circus, Royal Crescent, Thermae Bath Spa, Jane Austen Centre |
| Oxford | Famous for its prestigious university and beautiful architecture, Oxford attracts students and tourists all year round, making it a prime location for Airbnb. | University of Oxford, Bodleian Library, Ashmolean Museum, Radcliffe Camera, Christ Church, Oxford Botanic Garden |
| Brighton | A vibrant coastal city known for its pebbled beach, lively arts scene, and quirky shops. Very popular with tourists and weekenders from London. | Brighton Pier, Royal Pavilion, Brighton Beach, The Lanes, British Airways i360, undercliff walk |
| London | The capital city with a plethora of cultural attractions, business opportunities, and historical landmarks. Always in demand for short-term rentals. | The British Museum, Tower of London, Buckingham Palace, Westminster Abbey, London Eye, Covent Garden |
| Liverpool | A city rich in musical history and cultural attractions, Liverpool is popular with both tourists and business visitors, providing a diverse rental market. | The Beatles Story, Royal Albert Dock, Liverpool Cathedral, Tate Liverpool, Anfield Stadium, Walker Art Gallery |
| Edinburgh | Scotland’s capital, known for its historic and cultural attractions, including the Edinburgh Castle and annual festivals, making it a top destination for tourists. | Edinburgh Castle, Royal Mile, Arthur's Seat, Scott Monument, Holyrood Palace, Edinburgh Festival Fringe |
Understanding Airbnb License Requirements & STR Laws in Spark Bridge (2026)
While Spark Bridge, England, United Kingdom currently shows low STR regulations, specific Airbnb license requirements might still exist or change. Always verify the latest short term rental regulations and Airbnb license requirements directly with local government authorities for Spark Bridge to ensure full compliance before hosting.
(Source: AirROI data, 2026, finding no licensed listings among those analyzed)
Top Performing Airbnb Properties in Spark Bridge (2026)
Benchmark your potential! Explore examples of top-performing Airbnb properties in Spark Bridgebased on Trailing Twelve Month (TTM) revenue. Analyze their characteristics, revenue, occupancy rate, and ADR to understand what drives success in this market.

Dormy Cottage
Entire Place • 2 bedrooms

3 Bed in Spark Bridge (83701)
Entire Place • 3 bedrooms

Thorn Cottage
Entire Place • 4 bedrooms

Country cottage between Ulverston and Coniston
Entire Place • 3 bedrooms

Nan’s Cottage, South Lakeland District
Entire Place • 2 bedrooms

Willow Cottage
Entire Place • 2 bedrooms
Note: Performance varies based on location, size, amenities, seasonality, and management quality. Data reflects the past 12 months.
Top Performing Airbnb Hosts in Spark Bridge (2026)
Learn from the best! This table showcases top-performing Airbnb hosts in Spark Bridge based on the number of properties managed and estimated total revenue over the past year. Analyze their scale and performance metrics.
| Host Name | Properties | Grossing Revenue | Stay Reviews | Avg Rating |
|---|---|---|---|---|
| Cottages | 3 | $72,871 | 43 | 4.20/5.0 |
| Maria Percival | 5 | $42,824 | 224 | 4.60/5.0 |
| Matthew | 1 | $35,565 | 28 | 4.86/5.0 |
| Holidaycottages.Co.Uk | 1 | $34,608 | 2 | Not Rated |
| Sue | 1 | $32,432 | 56 | 4.77/5.0 |
| Wendy | 1 | $30,480 | 110 | 4.89/5.0 |
| Alan | 1 | $27,229 | 103 | 4.79/5.0 |
| Stephen | 1 | $19,107 | 32 | 4.88/5.0 |
| James | 1 | $18,797 | 101 | 4.80/5.0 |
| Sykes | 1 | $4,348 | 6 | 4.83/5.0 |
Analyzing the strategies of top hosts, such as their property selection, pricing, and guest communication, can offer valuable lessons for optimizing your own Airbnb operations in Spark Bridge.
Dive Deeper: Advanced Spark Bridge STR Market Data (2026)
Ready to unlock more insights? AirROI provides access to advanced metrics and comprehensive Airbnb data for Spark Bridge. Explore detailed analytics beyond this report to refine your investment strategy, optimize pricing, and maximize your vacation rental profits.
Explore Advanced MetricsSpark Bridge Short-Term Rental Market Composition (2026): Property & Room Types
Room Type Distribution
Property Type Distribution
Market Composition Insights for Spark Bridge
- The Spark Bridge Airbnb market composition is heavily skewed towards Entire Home/Apt listings, which make up 77.8% of the 18 active rentals. This indicates strong guest preference for privacy and space.
- Looking at the property type distribution in Spark Bridge, House properties are the most common (72.2%), reflecting the local real estate landscape.
- Houses represent a significant 72.2% portion, catering likely to families or larger groups.
Spark Bridge Airbnb Room Capacity Analysis (2026): Bedroom Distribution
Distribution of Listings by Number of Bedrooms
Room Capacity Insights for Spark Bridge
- The dominant room capacity in Spark Bridge is 2 bedrooms listings, making up 44.4% of the market. This suggests a strong demand for properties suitable for couples or solo travelers.
- Together, 2 bedrooms and 3 bedrooms properties represent 66.6% of the active Airbnb listings in Spark Bridge, indicating a high concentration in these sizes.
- A significant 27.8% of listings offer 3+ bedrooms, catering to larger groups and families seeking more space in Spark Bridge.
Spark Bridge Vacation Rental Guest Capacity Trends (2026)
Distribution of Listings by Guest Capacity
Guest Capacity Insights for Spark Bridge
- The most common guest capacity trend in Spark Bridge vacation rentals is listings accommodating 4 guests (38.9%). This suggests the primary traveler segment is likely small families or groups.
- Properties designed for 4 guests and 6 guests dominate the Spark Bridge STR market, accounting for 61.1% of listings.
- 27.8% of properties accommodate 6+ guests, serving the market segment for larger families or group travel in Spark Bridge.
- On average, properties in Spark Bridge are equipped to host 3.6 guests.
Spark Bridge Airbnb Booking Patterns (2026): Available vs. Booked Days
Available Days Distribution
Booked Days Distribution
Booking Pattern Insights for Spark Bridge
- The most common availability pattern in Spark Bridge falls within the 271-366 days range, representing 44.4% of listings. This suggests many properties have significant open periods on their calendars.
- Approximately 83.3% of listings show high availability (181+ days open annually), indicating potential for increased bookings or specific owner usage patterns.
- For booked days, the 91-180 days range is most frequent in Spark Bridge (38.9%), reflecting common guest stay durations or potential owner blocking patterns.
- A notable 16.7% of properties secure long booking periods (181+ days booked per year), highlighting successful long-term rental strategies or significant owner usage.
Spark Bridge Airbnb Minimum Stay Requirements Analysis
Distribution of Listings by Minimum Night Requirement
1 Night
3 listings
16.7% of total
2 Nights
5 listings
27.8% of total
3 Nights
2 listings
11.1% of total
30+ Nights
8 listings
44.4% of total
Key Insights
- The most prevalent minimum stay requirement in Spark Bridge is 30+ Nights, adopted by 44.4% of listings. This highlights the market's preference for longer commitments.
- A significant segment (44.4%) caters to monthly stays (30+ nights) in Spark Bridge, pointing to opportunities in the extended-stay market.
Recommendations
- Align with the market by considering a 30+ Nights minimum stay, as 44.4% of Spark Bridge hosts use this setting.
- If feasible, allowing 1-night stays, especially midweek or during low season, could capture last-minute bookings, as only 16.7% currently do.
- Explore offering discounts for stays of 30+ nights to attract the 44.4% of the market seeking extended stays.
- Adjust minimum nights based on seasonality – potentially shorter during low season and longer during peak demand periods in Spark Bridge.
Spark Bridge Airbnb Cancellation Policy Trends Analysis (2026)
Super Strict 60 Days
7 listings
38.9% of total
Moderate
3 listings
16.7% of total
Firm
8 listings
44.4% of total
Cancellation Policy Insights for Spark Bridge
- The prevailing Airbnb cancellation policy trend in Spark Bridge is Firm, used by 44.4% of listings.
- There's a relatively balanced mix between guest-friendly (16.7%) and stricter (44.4%) policies, offering choices for different guest needs.
Recommendations for Hosts
- Consider adopting a Firm policy to align with the 44.4% market standard in Spark Bridge.
- Regularly review your cancellation policy against competitors and market demand shifts in Spark Bridge.
Spark Bridge STR Booking Lead Time Analysis (2026)
Average Booking Lead Time by Month
Booking Lead Time Insights for Spark Bridge
- The overall average booking lead time for vacation rentals in Spark Bridge is 33 days.
- Guests book furthest in advance for stays during August (average 78 days), likely coinciding with peak travel demand or local events.
- The shortest booking windows occur for stays in October (average 26 days), indicating more last-minute travel plans during this time.
- Seasonally, Summer (58 days avg.) sees the longest lead times, while Fall (36 days avg.) has the shortest, reflecting typical travel planning cycles.
Recommendations for Hosts
- Use the overall average lead time (33 days) as a baseline for your pricing and availability strategy in Spark Bridge.
- For August stays, consider implementing length-of-stay discounts or slightly higher rates for bookings made less than 78 days out to capitalize on advance planning.
- Target marketing efforts for the Summer season well in advance (at least 58 days) to capture early planners.
- Monitor your own booking lead times against these Spark Bridge averages to identify opportunities for dynamic pricing adjustments.
Popular & Essential Airbnb Amenities in Spark Bridge (2026)
Amenity Prevalence
Amenity Insights for Spark Bridge
- Essential amenities in Spark Bridge that guests expect include: Smoke alarm, Kitchen. Lacking these (any) could significantly impact bookings.
- Popular amenities like Backyard, Bed linens, Heating are common but not universal. Offering these can provide a competitive edge.
- Warning: Wifi is not universally provided but is considered essential globally. Ensure reliable Wifi is offered.
Recommendations for Hosts
- Ensure your listing includes all essential amenities for Spark Bridge: Smoke alarm, Kitchen.
- Consider adding popular differentiators like Backyard or Bed linens to increase appeal.
- Highlight unique or less common amenities you offer (e.g., hot tub, dedicated workspace, EV charger) in your listing description and photos.
- Regularly check competitor amenities in Spark Bridge to stay competitive.
Spark Bridge Airbnb Guest Demographics & Profile Analysis (2026)
Guest Profile Summary for Spark Bridge
- The typical guest profile for Airbnb in Spark Bridge consists of primarily domestic travelers (90%), often arriving from nearby England, typically belonging to the Post-2000s (Gen Z/Alpha) group (50%), primarily speaking English or Italian.
- Domestic travelers account for 90.2% of guests.
- Key international markets include United Kingdom (90.2%) and Netherlands (2.7%).
- Top languages spoken are English (70%) followed by Italian (5%).
- A significant demographic segment is the Post-2000s (Gen Z/Alpha) group, representing 50% of guests.
Recommendations for Hosts
- Target domestic marketing efforts towards travelers from England and London.
- Tailor amenities and listing descriptions to appeal to the dominant Post-2000s (Gen Z/Alpha) demographic (e.g., highlight fast WiFi, smart home features, local guides).
- Highlight unique local experiences or amenities relevant to the primary guest profile.
- Consider seasonal promotions aligned with peak travel times for key origin markets.
Nearby Short-Term Rental Market Comparison
How does the Spark Bridge Airbnb market stack up against its neighbors? Compare key performance metrics like average monthly revenue, ADR, and occupancy rates in surrounding areas to understand the broader regional STR landscape.
| Market | Active Properties | Monthly Revenue | Daily Rate | Avg. Occupancy |
|---|---|---|---|---|
| Dalkeith | 10 | $5,775 | $478.16 | 55% |
| Buttermere | 14 | $4,802 | $415.13 | 49% |
| Llanbedr Dyffryn Clwyd | 10 | $4,746 | $463.17 | 38% |
| City of Edinburgh | 4,083 | $4,617 | $289.88 | 60% |
| Cartmel Fell | 23 | $4,560 | $364.59 | 48% |
| Burneside | 10 | $4,526 | $331.60 | 54% |
| Langbank | 11 | $4,447 | $385.29 | 53% |
| Bowness-on-Windermere | 358 | $4,223 | $357.92 | 45% |
| Rowen | 26 | $4,220 | $376.11 | 46% |
| Hayton | 16 | $4,173 | $258.03 | 57% |