St. Breward Airbnb Market Analysis 2026: Short Term Rental Data & Vacation Rental Statistics in England, United Kingdom
Is Airbnb profitable in St. Breward in 2026? Explore comprehensive Airbnb analytics for St. Breward, England, United Kingdom to uncover income potential. This 2026 STR market report for St. Breward, based on AirROI data from February 2025 to January 2026, reveals key trends in the niche market of 27 active listings.
Whether you're considering an Airbnb investment in St. Breward, optimizing your existing vacation rental, or exploring rental arbitrage opportunities, understanding the St. Breward Airbnb data is crucial. Leveraging the low regulation environment is key to maximizing your short term rental income potential. Let's dive into the specifics.
Key St. Breward Airbnb Performance Metrics Overview
Monthly Airbnb Revenue Variations & Income Potential in St. Breward (2026)
Understanding the monthly revenue variations for Airbnb listings in St. Breward is key to maximizing your short term rental income potential. Seasonality significantly impacts earnings. Our analysis, based on data from the past 12 months, shows that the peak revenue month for STRs in St. Breward is typically August, while January often presents the lowest earnings, highlighting opportunities for strategic pricing adjustments during shoulder and low seasons. Explore the typical Airbnb income in St. Breward across different performance tiers:
- Best-in-class properties (Top 10%) achieve $4,929+ monthly, often utilizing dynamic pricing and superior guest experiences.
- Strong performing properties (Top 25%) earn $2,591 or more, indicating effective management and desirable locations/amenities.
- Typical properties (Median) generate around $1,691 per month, representing the average market performance.
- Entry-level properties (Bottom 25%) see earnings around $858, often with potential for optimization.
Average Monthly Airbnb Earnings Trend in St. Breward
St. Breward Airbnb Occupancy Rate Trends (2026)
Maximize your bookings by understanding the St. Breward STR occupancy trends. Seasonal demand shifts significantly influence how often properties are booked. Typically, Augustsees the highest demand (peak season occupancy), while January experiences the lowest (low season). Effective strategies, like adjusting minimum stays or offering promotions, can boost occupancy during slower periods. Here's how different property tiers perform in St. Breward:
- Best-in-class properties (Top 10%) achieve 65%+ occupancy, indicating high desirability and potentially optimized availability.
- Strong performing properties (Top 25%) maintain 50% or higher occupancy, suggesting good market fit and guest satisfaction.
- Typical properties (Median) have an occupancy rate around 31%.
- Entry-level properties (Bottom 25%) average 15% occupancy, potentially facing higher vacancy.
Average Monthly Occupancy Rate Trend in St. Breward
Average Daily Rate (ADR) Airbnb Trends in St. Breward (2026)
Effective short term rental pricing strategy in St. Breward involves understanding monthly ADR fluctuations. The Average Daily Rate (ADR) for Airbnb in St. Breward typically peaks in July and dips lowest during February. Leveraging Airbnb dynamic pricing tools or strategies based on this seasonality can significantly boost revenue. Here's a look at the typical nightly rates achieved:
- Best-in-class properties (Top 10%) command rates of $417+ per night, often due to premium features or locations.
- Strong performing properties (Top 25%) achieve nightly rates of $219 or more.
- Typical properties (Median) charge around $147 per night.
- Entry-level properties (Bottom 25%) earn around $111 per night.
Average Daily Rate (ADR) Trend by Month in St. Breward
Get Live St. Breward Market Intelligence 👇

Explore Real-time Analytics
Airbnb Seasonality Analysis & Trends in St. Breward (2026)
Peak Season (August, July, June)
- Revenue averages $3,784 per month
- Occupancy rates average 47.7%
- Daily rates average $239
Shoulder Season
- Revenue averages $2,103 per month
- Occupancy maintains around 33.4%
- Daily rates hold near $187
Low Season (January, October, November)
- Revenue drops to average $1,280 per month
- Occupancy decreases to average 25.6%
- Daily rates adjust to average $188
Seasonality Insights for St. Breward
- The Airbnb seasonality in St. Breward shows highly seasonal trends requiring careful strategy. While the sections above show seasonal averages, it's also insightful to look at the extremes:
- During the high season, the absolute peak month showcases St. Breward's highest earning potential, with monthly revenues capable of climbing to $4,766, occupancy reaching a high of 62.5%, and ADRs peaking at $246.
- Conversely, the slowest single month of the year, typically falling within the low season, marks the market's lowest point. In this month, revenue might dip to $1,074, occupancy could drop to 16.2%, and ADRs may adjust down to $170.
- Understanding both the seasonal averages and these monthly peaks and troughs in revenue, occupancy, and ADR is crucial for maximizing your Airbnb profit potential in St. Breward.
Seasonal Strategies for Maximizing Profit
- Peak Season: Maximize revenue through premium pricing and potentially longer minimum stays. Ensure high availability.
- Low Season: Offer competitive pricing, special promotions (e.g., extended stay discounts), and flexible cancellation policies. Target off-season travelers like remote workers or budget-conscious guests.
- Shoulder Seasons: Implement dynamic pricing that balances peak and low rates. Target weekend travelers or specific events. Offer slightly more flexible terms than peak season.
- Regularly analyze your own performance against these St. Breward seasonality benchmarks and adjust your pricing and availability strategy accordingly.
Best Areas for Airbnb Investment in St. Breward (2026)
Exploring the top neighborhoods for short-term rentals in St. Breward? This section highlights key areas, outlining why they are attractive for hosts and guests, along with notable local attractions. Consider these locations based on your target guest profile and investment strategy.
| Neighborhood / Area | Why Host Here? (Target Guests & Appeal) | Key Attractions & Landmarks |
|---|---|---|
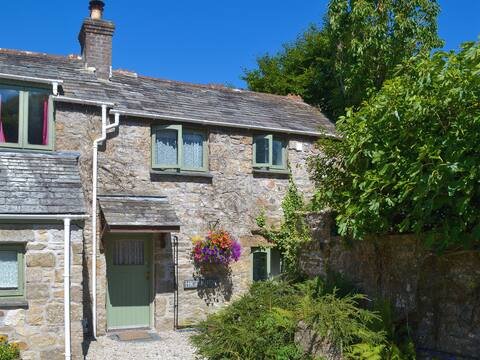
| St. Breward Village | Charming village embodying the heart of Cornwall, perfect for those seeking a peaceful countryside retreat with easy access to the rugged coastline and moorland. | Bodmin Moor, Camelford, Bodmin Jail, King Arthur's Castle, Camel Trail |
| Bodmin Moor | A unique wilderness area of stunning landscapes, ideal for outdoor enthusiasts and those looking to explore nature and history. | Cheesewring, Siblyback Lake, Golitha Falls, Minions |
| Tintagel | Historic location associated with King Arthur, popular with tourists drawn to its legends and scenic coastal views, making it a prime spot for short-term rentals. | Tintagel Castle, Merlin's Cave, The Legend of King Arthur, Castle Beach |
| Camelford | A small town near the north coast, offering access to beautiful landscapes and the nearby picturesque village of Port Isaac, attracting visitors looking for local charm. | Camel River, Davidstow Moor, Tintagel Castle nearby, Port Isaac |
| Port Isaac | A quintessential Cornish fishing village known for its narrow streets and stunning harbor, appealing to visitors who appreciate quaint and scenic coastal living. | Doc Martin's House, The Platt, Port Isaac Beach, Coastal Walks |
| Padstow | Famous for its food and beautiful harbor, it attracts many tourists throughout the year seeking culinary experiences and seaside relaxation. | Rick Stein's Restaurants, Padstow Harbour, Camel Trail, Padstow Museum |
| Wadebridge | A charming town with easy access to the Camel Estuary, making it a suitable base for tourists exploring the surrounding areas and attractions. | Camel Trail, Wadebridge's local shops, River Camel, Historic Town Centre |
| Newquay | A popular seaside resort known for its surfing beaches and vibrant nightlife, ideal for younger travelers and those seeking sun and fun. | Fistral Beach, Newquay Zoo, The Eden Project nearby, Watergate Bay |
Understanding Airbnb License Requirements & STR Laws in St. Breward (2026)
While St. Breward, England, United Kingdom currently shows low STR regulations, specific Airbnb license requirements might still exist or change. Always verify the latest short term rental regulations and Airbnb license requirements directly with local government authorities for St. Breward to ensure full compliance before hosting.
(Source: AirROI data, 2026, finding no licensed listings among those analyzed)
Top Performing Airbnb Properties in St. Breward (2026)
Benchmark your potential! Explore examples of top-performing Airbnb properties in St. Brewardbased on Trailing Twelve Month (TTM) revenue. Analyze their characteristics, revenue, occupancy rate, and ADR to understand what drives success in this market.

Cross Cottage
Entire Place • 2 bedrooms
High View
Entire Place • 1 bedroom

Klys Cottage
Entire Place • 2 bedrooms

Ladydown Cottage at Hallagenna Cottages
Entire Place • 2 bedrooms
Gwyns
Entire Place • 1 bedroom
Farmhouse annexe with home-cooked breakfast
Entire Place • 1 bedroom
Note: Performance varies based on location, size, amenities, seasonality, and management quality. Data reflects the past 12 months.
Top Performing Airbnb Hosts in St. Breward (2026)
Learn from the best! This table showcases top-performing Airbnb hosts in St. Breward based on the number of properties managed and estimated total revenue over the past year. Analyze their scale and performance metrics.
| Host Name | Properties | Grossing Revenue | Stay Reviews | Avg Rating |
|---|---|---|---|---|
| Cottages | 3 | $192,673 | 27 | 4.70/5.0 |
| Mick | 4 | $78,855 | 122 | 4.96/5.0 |
| Holidaycottages.Co.Uk | 5 | $42,504 | 19 | 4.95/5.0 |
| Lucy | 2 | $31,860 | 21 | 4.96/5.0 |
| Cornish Traditional Cottages | 2 | $29,133 | 2 | Not Rated |
| Paul | 3 | $25,946 | 23 | 4.59/5.0 |
| Julie | 1 | $22,966 | 90 | 4.97/5.0 |
| Michelle | 1 | $13,697 | 39 | 4.64/5.0 |
| Hollie | 2 | $7,959 | 19 | 5.00/5.0 |
| Tim | 2 | $4,481 | 29 | 5.00/5.0 |
Analyzing the strategies of top hosts, such as their property selection, pricing, and guest communication, can offer valuable lessons for optimizing your own Airbnb operations in St. Breward.
Dive Deeper: Advanced St. Breward STR Market Data (2026)
Ready to unlock more insights? AirROI provides access to advanced metrics and comprehensive Airbnb data for St. Breward. Explore detailed analytics beyond this report to refine your investment strategy, optimize pricing, and maximize your vacation rental profits.
Explore Advanced MetricsSt. Breward Short-Term Rental Market Composition (2026): Property & Room Types
Room Type Distribution
Property Type Distribution
Market Composition Insights for St. Breward
- The St. Breward Airbnb market composition is heavily skewed towards Entire Home/Apt listings, which make up 100% of the 27 active rentals. This indicates strong guest preference for privacy and space.
- Looking at the property type distribution in St. Breward, House properties are the most common (66.7%), reflecting the local real estate landscape.
- Houses represent a significant 66.7% portion, catering likely to families or larger groups.
St. Breward Airbnb Room Capacity Analysis (2026): Bedroom Distribution
Distribution of Listings by Number of Bedrooms
Room Capacity Insights for St. Breward
- The dominant room capacity in St. Breward is 2 bedrooms listings, making up 40.7% of the market. This suggests a strong demand for properties suitable for couples or solo travelers.
- Together, 2 bedrooms and 1 bedroom properties represent 77.7% of the active Airbnb listings in St. Breward, indicating a high concentration in these sizes.
St. Breward Vacation Rental Guest Capacity Trends (2026)
Distribution of Listings by Guest Capacity
Guest Capacity Insights for St. Breward
- The most common guest capacity trend in St. Breward vacation rentals is listings accommodating 4 guests (44.4%). This suggests the primary traveler segment is likely small families or groups.
- Properties designed for 4 guests and 2 guests dominate the St. Breward STR market, accounting for 74.0% of listings.
- 18.5% of properties accommodate 6+ guests, serving the market segment for larger families or group travel in St. Breward.
- On average, properties in St. Breward are equipped to host 3.8 guests.
St. Breward Airbnb Booking Patterns (2026): Available vs. Booked Days
Available Days Distribution
Booked Days Distribution
Booking Pattern Insights for St. Breward
- The most common availability pattern in St. Breward falls within the 271-366 days range, representing 74.1% of listings. This suggests many properties have significant open periods on their calendars.
- Approximately 92.6% of listings show high availability (181+ days open annually), indicating potential for increased bookings or specific owner usage patterns.
- For booked days, the 31-90 days range is most frequent in St. Breward (44.4%), reflecting common guest stay durations or potential owner blocking patterns.
- A notable 7.4% of properties secure long booking periods (181+ days booked per year), highlighting successful long-term rental strategies or significant owner usage.
St. Breward Airbnb Minimum Stay Requirements Analysis
Distribution of Listings by Minimum Night Requirement
1 Night
8 listings
29.6% of total
2 Nights
5 listings
18.5% of total
3 Nights
7 listings
25.9% of total
30+ Nights
7 listings
25.9% of total
Key Insights
- The most prevalent minimum stay requirement in St. Breward is 1 Night, adopted by 29.6% of listings. This highlights the market's preference for shorter, flexible bookings.
- A significant segment (25.9%) caters to monthly stays (30+ nights) in St. Breward, pointing to opportunities in the extended-stay market.
Recommendations
- Align with the market by considering a 1 Night minimum stay, as 29.6% of St. Breward hosts use this setting.
- If feasible, allowing 1-night stays, especially midweek or during low season, could capture last-minute bookings, as only 29.6% currently do.
- Explore offering discounts for stays of 30+ nights to attract the 25.9% of the market seeking extended stays.
- Adjust minimum nights based on seasonality – potentially shorter during low season and longer during peak demand periods in St. Breward.
St. Breward Airbnb Cancellation Policy Trends Analysis (2026)
Super Strict 60 Days
8 listings
29.6% of total
Moderate
1 listings
3.7% of total
Firm
12 listings
44.4% of total
Strict
6 listings
22.2% of total
Cancellation Policy Insights for St. Breward
- The prevailing Airbnb cancellation policy trend in St. Breward is Firm, used by 44.4% of listings.
- A majority (66.6%) of hosts in St. Breward utilize Firm or Strict policies, indicating a market where hosts prioritize booking security.
Recommendations for Hosts
- Consider adopting a Firm policy to align with the 44.4% market standard in St. Breward.
- Regularly review your cancellation policy against competitors and market demand shifts in St. Breward.
St. Breward STR Booking Lead Time Analysis (2026)
Average Booking Lead Time by Month
Booking Lead Time Insights for St. Breward
- The overall average booking lead time for vacation rentals in St. Breward is 64 days.
- Guests book furthest in advance for stays during May (average 107 days), likely coinciding with peak travel demand or local events.
- The shortest booking windows occur for stays in November (average 15 days), indicating more last-minute travel plans during this time.
- Seasonally, Spring (77 days avg.) sees the longest lead times, while Fall (50 days avg.) has the shortest, reflecting typical travel planning cycles.
Recommendations for Hosts
- Use the overall average lead time (64 days) as a baseline for your pricing and availability strategy in St. Breward.
- For May stays, consider implementing length-of-stay discounts or slightly higher rates for bookings made less than 107 days out to capitalize on advance planning.
- Target marketing efforts for the Spring season well in advance (at least 77 days) to capture early planners.
- Monitor your own booking lead times against these St. Breward averages to identify opportunities for dynamic pricing adjustments.
Popular & Essential Airbnb Amenities in St. Breward (2026)
Amenity Prevalence
Amenity Insights for St. Breward
- Essential amenities in St. Breward that guests expect include: Smoke alarm. Lacking these (this) could significantly impact bookings.
- Popular amenities like Kitchen, Free parking on premises, Heating are common but not universal. Offering these can provide a competitive edge.
- Warning: Wifi is not universally provided but is considered essential globally. Ensure reliable Wifi is offered.
Recommendations for Hosts
- Ensure your listing includes all essential amenities for St. Breward: Smoke alarm.
- Prioritize adding missing essentials: Smoke alarm.
- Consider adding popular differentiators like Kitchen or Free parking on premises to increase appeal.
- Highlight unique or less common amenities you offer (e.g., hot tub, dedicated workspace, EV charger) in your listing description and photos.
- Regularly check competitor amenities in St. Breward to stay competitive.
St. Breward Airbnb Guest Demographics & Profile Analysis (2026)
Guest Profile Summary for St. Breward
- The typical guest profile for Airbnb in St. Breward consists of primarily domestic travelers (80%), often arriving from nearby England, typically belonging to the Post-2000s (Gen Z/Alpha) group (50%), primarily speaking English or German.
- Domestic travelers account for 79.7% of guests.
- Key international markets include United Kingdom (79.7%) and France (3.4%).
- Top languages spoken are English (60.7%) followed by German (7.1%).
- A significant demographic segment is the Post-2000s (Gen Z/Alpha) group, representing 50% of guests.
Recommendations for Hosts
- Target domestic marketing efforts towards travelers from England and London.
- Tailor amenities and listing descriptions to appeal to the dominant Post-2000s (Gen Z/Alpha) demographic (e.g., highlight fast WiFi, smart home features, local guides).
- Highlight unique local experiences or amenities relevant to the primary guest profile.
- Consider seasonal promotions aligned with peak travel times for key origin markets.
Nearby Short-Term Rental Market Comparison
How does the St. Breward Airbnb market stack up against its neighbors? Compare key performance metrics like average monthly revenue, ADR, and occupancy rates in surrounding areas to understand the broader regional STR landscape.
| Market | Active Properties | Monthly Revenue | Daily Rate | Avg. Occupancy |
|---|---|---|---|---|
| Angle | 13 | $6,069 | $626.63 | 50% |
| Milverton | 10 | $5,067 | $377.17 | 48% |
| Southerndown | 16 | $5,064 | $409.45 | 46% |
| Southgate | 13 | $4,781 | $282.69 | 56% |
| Bridgwater | 18 | $4,662 | $355.91 | 53% |
| Crai | 31 | $4,496 | $552.02 | 38% |
| New Polzeath | 17 | $4,089 | $281.24 | 54% |
| Llantrisant | 15 | $4,086 | $275.56 | 44% |
| Trenance | 25 | $4,037 | $513.80 | 39% |
| Rhossili | 30 | $4,019 | $313.39 | 50% |