St. Ives Airbnb Market Analysis 2025: Short Term Rental Data & Vacation Rental Statistics in England, United Kingdom
Is Airbnb profitable in St. Ives in 2025? Explore comprehensive Airbnb analytics for St. Ives, England, United Kingdom to uncover income potential. This 2025 STR market report for St. Ives, based on AirROI data from April 2024 to March 2025, reveals key trends in the bustling market of 1,028 active listings.
Whether you're considering an Airbnb investment in St. Ives, optimizing your existing vacation rental, or exploring rental arbitrage opportunities, understanding the St. Ives Airbnb data is crucial. Leveraging the low regulation environment is key to maximizing your short term rental income potential. Let's dive into the specifics.
Key St. Ives Airbnb Performance Metrics Overview
Monthly Airbnb Revenue Variations & Income Potential in St. Ives (2025)
Understanding the monthly revenue variations for Airbnb listings in St. Ives is key to maximizing your short term rental income potential. Seasonality significantly impacts earnings. Our analysis, based on data from the past 12 months, shows that the peak revenue month for STRs in St. Ives is typically August, while January often presents the lowest earnings, highlighting opportunities for strategic pricing adjustments during shoulder and low seasons. Explore the typical Airbnb income in St. Ives across different performance tiers:
- Best-in-class properties (Top 10%) achieve $6,553+ monthly, often utilizing dynamic pricing and superior guest experiences.
- Strong performing properties (Top 25%) earn $4,369 or more, indicating effective management and desirable locations/amenities.
- Typical properties (Median) generate around $2,688 per month, representing the average market performance.
- Entry-level properties (Bottom 25%) see earnings around $1,496, often with potential for optimization.
Average Monthly Airbnb Earnings Trend in St. Ives
St. Ives Airbnb Occupancy Rate Trends (2025)
Maximize your bookings by understanding the St. Ives STR occupancy trends. Seasonal demand shifts significantly influence how often properties are booked. Typically, Augustsees the highest demand (peak season occupancy), while January experiences the lowest (low season). Effective strategies, like adjusting minimum stays or offering promotions, can boost occupancy during slower periods. Here's how different property tiers perform in St. Ives:
- Best-in-class properties (Top 10%) achieve 79%+ occupancy, indicating high desirability and potentially optimized availability.
- Strong performing properties (Top 25%) maintain 62% or higher occupancy, suggesting good market fit and guest satisfaction.
- Typical properties (Median) have an occupancy rate around 40%.
- Entry-level properties (Bottom 25%) average 19% occupancy, potentially facing higher vacancy.
Average Monthly Occupancy Rate Trend in St. Ives
Average Daily Rate (ADR) Airbnb Trends in St. Ives (2025)
Effective short term rental pricing strategy in St. Ives involves understanding monthly ADR fluctuations. The Average Daily Rate (ADR) for Airbnb in St. Ives typically peaks in August and dips lowest during November. Leveraging Airbnb dynamic pricing tools or strategies based on this seasonality can significantly boost revenue. Here's a look at the typical nightly rates achieved:
- Best-in-class properties (Top 10%) command rates of $466+ per night, often due to premium features or locations.
- Strong performing properties (Top 25%) achieve nightly rates of $324 or more.
- Typical properties (Median) charge around $219 per night.
- Entry-level properties (Bottom 25%) earn around $146 per night.
Average Daily Rate (ADR) Trend by Month in St. Ives
Get Live St. Ives Market Intelligence 👇

Explore Real-time Analytics
Airbnb Seasonality Analysis & Trends in St. Ives (2025)
Peak Season (August, July, June)
- Revenue averages $5,275 per month
- Occupancy rates average 57.9%
- Daily rates average $288
Shoulder Season
- Revenue averages $3,118 per month
- Occupancy maintains around 40.6%
- Daily rates hold near $257
Low Season (January, February, November)
- Revenue drops to average $1,800 per month
- Occupancy decreases to average 29.6%
- Daily rates adjust to average $243
Seasonality Insights for St. Ives
- The Airbnb seasonality in St. Ives shows highly seasonal trends requiring careful strategy. While the sections above show seasonal averages, it's also insightful to look at the extremes:
- During the high season, the absolute peak month showcases St. Ives's highest earning potential, with monthly revenues capable of climbing to $5,862, occupancy reaching a high of 63.8%, and ADRs peaking at $293.
- Conversely, the slowest single month of the year, typically falling within the low season, marks the market's lowest point. In this month, revenue might dip to $1,692, occupancy could drop to 25.4%, and ADRs may adjust down to $234.
- Understanding both the seasonal averages and these monthly peaks and troughs in revenue, occupancy, and ADR is crucial for maximizing your Airbnb profit potential in St. Ives.
Seasonal Strategies for Maximizing Profit
- Peak Season: Maximize revenue through premium pricing and potentially longer minimum stays. Ensure high availability.
- Low Season: Offer competitive pricing, special promotions (e.g., extended stay discounts), and flexible cancellation policies. Target off-season travelers like remote workers or budget-conscious guests.
- Shoulder Seasons: Implement dynamic pricing that balances peak and low rates. Target weekend travelers or specific events. Offer slightly more flexible terms than peak season.
- Regularly analyze your own performance against these St. Ives seasonality benchmarks and adjust your pricing and availability strategy accordingly.
Best Areas for Airbnb Investment in St. Ives (2025)
Exploring the top neighborhoods for short-term rentals in St. Ives? This section highlights key areas, outlining why they are attractive for hosts and guests, along with notable local attractions. Consider these locations based on your target guest profile and investment strategy.
| Neighborhood / Area | Why Host Here? (Target Guests & Appeal) | Key Attractions & Landmarks |
|---|---|---|
| Porthminster Beach | A beautiful sandy beach with clear waters, perfect for families and tourists. The area offers stunning views, beachside cafes, and proximity to local attractions. | Porthminster Beach, St Ives Harbour, The Tate St Ives, The Barbara Hepworth Museum, Coastal Path Walks |
| St Ives Harbour | The heart of St Ives, bustling with activity and close to numerous restaurants, shops, and galleries. Ideal for visitors wanting to experience the local culture and waterfront. | St Ives Harbour, The Wharf, Sloop Inn, St Ives Museum, Local seafood restaurants |
| Carbis Bay | A quieter, more residential area that still offers stunning beaches and views, perfect for families and those seeking a relaxing stay away from the busier town center. | Carbis Bay Beach, The South West Coast Path, Carbis Bay Hotel Spa, Local cafes and shops, Scenic views of St Ives |
| The Island | A unique area that offers breathtaking views of the coastline and is close to shops and restaurants. It's ideal for those seeking scenic beauty combined with convenience. | The Island, The Pilchard Works, St Nicholas Chapel, Local art galleries, Panoramic coastal views |
| Lelant | A charming village that offers a more rural experience, with easy access to the beautiful Hayle Estuary and scenic walking paths, ideal for nature lovers. | Hayle Estuary, Lelant Saltings, Pubs and local eateries, Coastal walks, Historic buildings |
| West Porthminster | A laid-back area with a mix of beach access and local amenities. It’s a great location for families and beach lovers looking for a quieter spot. | Porthminster Beach, Local shops, Porthminster Point, Restaurants overlooking the beach, Garden areas |
| Zennor | A picturesque and historic village known for its stunning landscapes and coastal paths. This area attracts those who want a peaceful countryside experience. | Zennor Beach, The Zennor Mermaid, The prehistoric remains, Zennor Head, Scenic walking trails |
| St Ives Town Center | The central hub of St Ives with shops, restaurants, and attractions. Perfect for those wanting to be in the midst of all the activities. | Fore Street, Local art galleries, The St Ives Theatre, Restaurants and cafes, Shopping boutiques |
Understanding Airbnb License Requirements & STR Laws in St. Ives (2025)
While St. Ives, England, United Kingdom currently shows low STR regulations, specific Airbnb license requirements might still exist or change. Always verify the latest short term rental regulations and Airbnb license requirements directly with local government authorities for St. Ives to ensure full compliance before hosting.
(Source: AirROI data, 2025, based on 0% licensed listings)
Top Performing Airbnb Properties in St. Ives (2025)
Benchmark your potential! Explore examples of top-performing Airbnb properties in St. Ivesbased on Trailing Twelve Month (TTM) revenue. Analyze their characteristics, revenue, occupancy rate, and ADR to understand what drives success in this market.
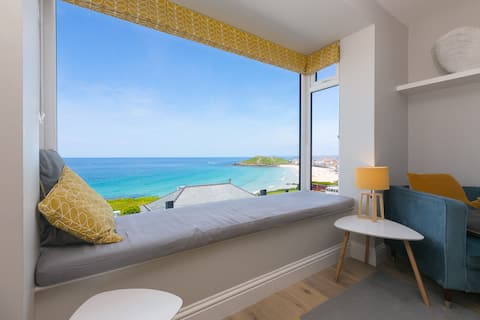
Stunning Luxury Holiday Home - amazing sea views
Entire Place • 6 bedrooms
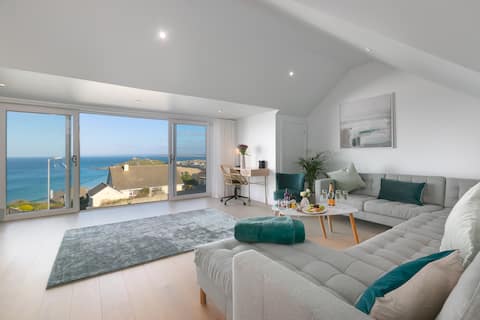
Amazing 5 bed holiday home with stunning sea views
Entire Place • 5 bedrooms
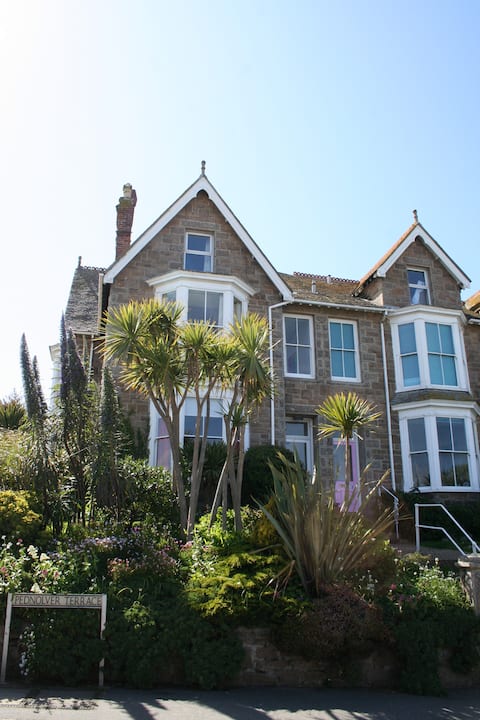
spacious house for up to 12 people with sea views
Entire Place • 6 bedrooms
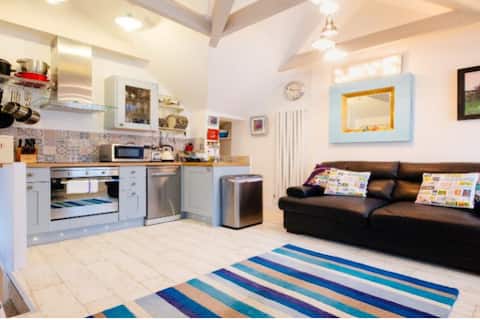
Very Central, Beaches 2 mins walk
Entire Place • 2 bedrooms

Orla-Mo St Ives 4xParking Central AmazeViews Dogs
Entire Place • 5 bedrooms
St Ives Sleeps 10, Seaview, Hot-tub, parking, wifi
Entire Place • 5 bedrooms
Note: Performance varies based on location, size, amenities, seasonality, and management quality. Data reflects the past 12 months.
Top Performing Airbnb Hosts in St. Ives (2025)
Learn from the best! This table showcases top-performing Airbnb hosts in St. Ives based on the number of properties managed and estimated total revenue over the past year. Analyze their scale and performance metrics.
| Host Name | Properties | Grossing Revenue | Stay Reviews | Avg Rating |
|---|---|---|---|---|
| Lisa | 48 | $2,214,243 | 2329 | 4.70/5.0 |
| Orange Roofs | 39 | $1,824,480 | 607 | 4.52/5.0 |
| Cornish Horizons | 87 | $1,563,082 | 217 | 1.75/5.0 |
| Cornish Escapes | 78 | $1,190,579 | 1005 | 4.24/5.0 |
| Luxury Coastal | 39 | $819,640 | 299 | 3.33/5.0 |
| Sam | 18 | $757,471 | 479 | 4.04/5.0 |
| Elizabeth | 9 | $586,386 | 238 | 4.95/5.0 |
| Alan | 11 | $520,115 | 198 | 4.48/5.0 |
| Cornish Riviera | 39 | $495,943 | 460 | 3.75/5.0 |
| Elaine | 16 | $476,573 | 3755 | 4.83/5.0 |
Analyzing the strategies of top hosts, such as their property selection, pricing, and guest communication, can offer valuable lessons for optimizing your own Airbnb operations in St. Ives.
Dive Deeper: Advanced St. Ives STR Market Data (2025)
Ready to unlock more insights? AirROI provides access to advanced metrics and comprehensive Airbnb data for St. Ives. Explore detailed analytics beyond this report to refine your investment strategy, optimize pricing, and maximize your vacation rental profits.
Explore Advanced MetricsSt. Ives Short-Term Rental Market Composition (2025): Property & Room Types
Room Type Distribution
Property Type Distribution
Market Composition Insights for St. Ives
- The St. Ives Airbnb market composition is heavily skewed towards Entire Home/Apt listings, which make up 90.8% of the 1,028 active rentals. This indicates strong guest preference for privacy and space.
- Looking at the property type distribution in St. Ives, House properties are the most common (57.3%), reflecting the local real estate landscape.
- Houses represent a significant 57.3% portion, catering likely to families or larger groups.
- Smaller segments like hotel/boutique, others, outdoor/unique, unique stays (combined 7.5%) offer potential for unique stay experiences.
St. Ives Airbnb Room Capacity Analysis (2025): Bedroom Distribution
Distribution of Listings by Number of Bedrooms
Room Capacity Insights for St. Ives
- The dominant room capacity in St. Ives is 2 bedrooms listings, making up 34.2% of the market. This suggests a strong demand for properties suitable for couples or solo travelers.
- Together, 2 bedrooms and 1 bedroom properties represent 65.1% of the active Airbnb listings in St. Ives, indicating a high concentration in these sizes.
- A significant 29.5% of listings offer 3+ bedrooms, catering to larger groups and families seeking more space in St. Ives.
St. Ives Vacation Rental Guest Capacity Trends (2025)
Distribution of Listings by Guest Capacity
Guest Capacity Insights for St. Ives
- The most common guest capacity trend in St. Ives vacation rentals is listings accommodating 4 guests (32.9%). This suggests the primary traveler segment is likely small families or groups.
- Properties designed for 4 guests and 2 guests dominate the St. Ives STR market, accounting for 58.7% of listings.
- 28.3% of properties accommodate 6+ guests, serving the market segment for larger families or group travel in St. Ives.
- On average, properties in St. Ives are equipped to host 4.1 guests.
St. Ives Airbnb Booking Patterns (2025): Available vs. Booked Days
Available Days Distribution
Booked Days Distribution
Booking Pattern Insights for St. Ives
- The most common availability pattern in St. Ives falls within the 271-366 days range, representing 40.4% of listings. This suggests many properties have significant open periods on their calendars.
- Approximately 77.2% of listings show high availability (181+ days open annually), indicating potential for increased bookings or specific owner usage patterns.
- For booked days, the 91-180 days range is most frequent in St. Ives (36.6%), reflecting common guest stay durations or potential owner blocking patterns.
- A notable 24.5% of properties secure long booking periods (181+ days booked per year), highlighting successful long-term rental strategies or significant owner usage.
St. Ives Airbnb Minimum Stay Requirements Analysis
Distribution of Listings by Minimum Night Requirement
1 Night
140 listings
14.3% of total
2 Nights
220 listings
22.4% of total
3 Nights
183 listings
18.6% of total
4-6 Nights
120 listings
12.2% of total
7-29 Nights
45 listings
4.6% of total
30+ Nights
274 listings
27.9% of total
Key Insights
- The most prevalent minimum stay requirement in St. Ives is 30+ Nights, adopted by 27.9% of listings. This highlights the market's preference for longer commitments.
- A significant segment (27.9%) caters to monthly stays (30+ nights) in St. Ives, pointing to opportunities in the extended-stay market.
Recommendations
- Align with the market by considering a 30+ Nights minimum stay, as 27.9% of St. Ives hosts use this setting.
- If feasible, allowing 1-night stays, especially midweek or during low season, could capture last-minute bookings, as only 14.3% currently do.
- Explore offering discounts for stays of 30+ nights to attract the 27.9% of the market seeking extended stays.
- Adjust minimum nights based on seasonality – potentially shorter during low season and longer during peak demand periods in St. Ives.
St. Ives Airbnb Cancellation Policy Trends Analysis (2025)
Super Strict 60 Days
145 listings
16% of total
Super Strict 30 Days
9 listings
1% of total
Flexible
70 listings
7.7% of total
Moderate
94 listings
10.4% of total
Firm
194 listings
21.4% of total
Strict
395 listings
43.6% of total
Cancellation Policy Insights for St. Ives
- The prevailing Airbnb cancellation policy trend in St. Ives is Strict, used by 43.6% of listings.
- A majority (65.0%) of hosts in St. Ives utilize Firm or Strict policies, indicating a market where hosts prioritize booking security.
Recommendations for Hosts
- Consider adopting a Strict policy to align with the 43.6% market standard in St. Ives.
- With 43.6% using Strict terms, this is a viable option in St. Ives, particularly for high-value properties or during peak demand periods.
- Regularly review your cancellation policy against competitors and market demand shifts in St. Ives.
St. Ives STR Booking Lead Time Analysis (2025)
Average Booking Lead Time by Month
Booking Lead Time Insights for St. Ives
- The overall average booking lead time for vacation rentals in St. Ives is 77 days.
- Guests book furthest in advance for stays during May (average 115 days), likely coinciding with peak travel demand or local events.
- The shortest booking windows occur for stays in February (average 53 days), indicating more last-minute travel plans during this time.
- Seasonally, Summer (106 days avg.) sees the longest lead times, while Winter (72 days avg.) has the shortest, reflecting typical travel planning cycles.
Recommendations for Hosts
- Use the overall average lead time (77 days) as a baseline for your pricing and availability strategy in St. Ives.
- For May stays, consider implementing length-of-stay discounts or slightly higher rates for bookings made less than 115 days out to capitalize on advance planning.
- Target marketing efforts for the Summer season well in advance (at least 106 days) to capture early planners.
- Monitor your own booking lead times against these St. Ives averages to identify opportunities for dynamic pricing adjustments.
Popular & Essential Airbnb Amenities in St. Ives (2025)
Amenity Prevalence
Amenity Insights for St. Ives
- Essential amenities in St. Ives that guests expect include: Smoke alarm, Wifi, Heating, TV. Lacking these (any) could significantly impact bookings.
- Popular amenities like Kitchen, Refrigerator, Dishes and silverware are common but not universal. Offering these can provide a competitive edge.
Recommendations for Hosts
- Ensure your listing includes all essential amenities for St. Ives: Smoke alarm, Wifi, Heating, TV.
- Prioritize adding missing essentials: Smoke alarm, Wifi, Heating, TV.
- Consider adding popular differentiators like Kitchen or Refrigerator to increase appeal.
- Highlight unique or less common amenities you offer (e.g., hot tub, dedicated workspace, EV charger) in your listing description and photos.
- Regularly check competitor amenities in St. Ives to stay competitive.
St. Ives Airbnb Guest Demographics & Profile Analysis (2025)
Guest Profile Summary for St. Ives
- The typical guest profile for Airbnb in St. Ives consists of primarily domestic travelers (82%), often arriving from nearby England, typically belonging to the Post-2000s (Gen Z/Alpha) group (50%), primarily speaking English or French.
- Domestic travelers account for 82.4% of guests.
- Key international markets include United Kingdom (82.4%) and United States (3.5%).
- Top languages spoken are English (64.4%) followed by French (7.6%).
- A significant demographic segment is the Post-2000s (Gen Z/Alpha) group, representing 50% of guests.
Recommendations for Hosts
- Target domestic marketing efforts towards travelers from England and London.
- Tailor amenities and listing descriptions to appeal to the dominant Post-2000s (Gen Z/Alpha) demographic (e.g., highlight fast WiFi, smart home features, local guides).
- Highlight unique local experiences or amenities relevant to the primary guest profile.
- Consider seasonal promotions aligned with peak travel times for key origin markets.
Nearby Short-Term Rental Market Comparison
How does the St. Ives Airbnb market stack up against its neighbors? Compare key performance metrics like average monthly revenue, ADR, and occupancy rates in surrounding areas to understand the broader regional STR landscape.
| Market | Active Properties | Monthly Revenue | Daily Rate | Avg. Occupancy |
|---|---|---|---|---|
| Llanrhidian | 15 | $4,842 | $386.18 | 53% |
| Trenance | 19 | $4,795 | $428.63 | 43% |
| Angle | 13 | $4,602 | $384.81 | 42% |
| Ludchurch | 15 | $4,354 | $291.87 | 43% |
| Redberth | 29 | $4,103 | $223.37 | 59% |
| Higher Crackington | 17 | $3,731 | $340.74 | 37% |
| Perranuthnoe | 24 | $3,421 | $352.15 | 37% |
| St. John | 44 | $3,354 | $233.49 | 50% |
| Llanboidy | 10 | $3,280 | $260.08 | 45% |
| Llangennith | 32 | $3,271 | $251.71 | 52% |