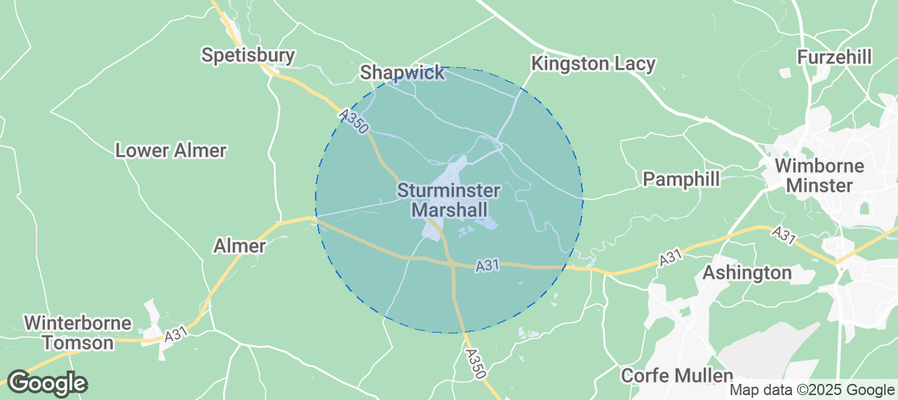
Sturminster Marshall Airbnb Market Analysis 2025: Short Term Rental Data & Vacation Rental Statistics in England, United Kingdom
Is Airbnb profitable in Sturminster Marshall in 2025? Explore comprehensive Airbnb analytics for Sturminster Marshall, England, United Kingdom to uncover income potential. This 2025 STR market report for Sturminster Marshall, based on AirROI data from July 2024 to June 2025, reveals key trends in the niche market of 18 active listings.
Whether you're considering an Airbnb investment in Sturminster Marshall, optimizing your existing vacation rental, or exploring rental arbitrage opportunities, understanding the Sturminster Marshall Airbnb data is crucial. Leveraging the low regulation environment is key to maximizing your short term rental income potential. Let's dive into the specifics.
Key Sturminster Marshall Airbnb Performance Metrics Overview
Monthly Airbnb Revenue Variations & Income Potential in Sturminster Marshall (2025)
Understanding the monthly revenue variations for Airbnb listings in Sturminster Marshall is key to maximizing your short term rental income potential. Seasonality significantly impacts earnings. Our analysis, based on data from the past 12 months, shows that the peak revenue month for STRs in Sturminster Marshall is typically August, while May often presents the lowest earnings, highlighting opportunities for strategic pricing adjustments during shoulder and low seasons. Explore the typical Airbnb income in Sturminster Marshall across different performance tiers:
- Best-in-class properties (Top 10%) achieve $4,906+ monthly, often utilizing dynamic pricing and superior guest experiences.
- Strong performing properties (Top 25%) earn $2,750 or more, indicating effective management and desirable locations/amenities.
- Typical properties (Median) generate around $1,469 per month, representing the average market performance.
- Entry-level properties (Bottom 25%) see earnings around $736, often with potential for optimization.
Average Monthly Airbnb Earnings Trend in Sturminster Marshall
Sturminster Marshall Airbnb Occupancy Rate Trends (2025)
Maximize your bookings by understanding the Sturminster Marshall STR occupancy trends. Seasonal demand shifts significantly influence how often properties are booked. Typically, Augustsees the highest demand (peak season occupancy), while October experiences the lowest (low season). Effective strategies, like adjusting minimum stays or offering promotions, can boost occupancy during slower periods. Here's how different property tiers perform in Sturminster Marshall:
- Best-in-class properties (Top 10%) achieve 79%+ occupancy, indicating high desirability and potentially optimized availability.
- Strong performing properties (Top 25%) maintain 64% or higher occupancy, suggesting good market fit and guest satisfaction.
- Typical properties (Median) have an occupancy rate around 42%.
- Entry-level properties (Bottom 25%) average 26% occupancy, potentially facing higher vacancy.
Average Monthly Occupancy Rate Trend in Sturminster Marshall
Average Daily Rate (ADR) Airbnb Trends in Sturminster Marshall (2025)
Effective short term rental pricing strategy in Sturminster Marshall involves understanding monthly ADR fluctuations. The Average Daily Rate (ADR) for Airbnb in Sturminster Marshall typically peaks in August and dips lowest during March. Leveraging Airbnb dynamic pricing tools or strategies based on this seasonality can significantly boost revenue. Here's a look at the typical nightly rates achieved:
- Best-in-class properties (Top 10%) command rates of $402+ per night, often due to premium features or locations.
- Strong performing properties (Top 25%) achieve nightly rates of $278 or more.
- Typical properties (Median) charge around $155 per night.
- Entry-level properties (Bottom 25%) earn around $96 per night.
Average Daily Rate (ADR) Trend by Month in Sturminster Marshall
Get Live Sturminster Marshall Market Intelligence 👇
Explore Real-time Analytics
Airbnb Seasonality Analysis & Trends in Sturminster Marshall (2025)
Peak Season (August, February, July)
- Revenue averages $2,996 per month
- Occupancy rates average 49.8%
- Daily rates average $223
Shoulder Season
- Revenue averages $2,225 per month
- Occupancy maintains around 45.9%
- Daily rates hold near $192
Low Season (May, October, December)
- Revenue drops to average $1,665 per month
- Occupancy decreases to average 39.9%
- Daily rates adjust to average $194
Seasonality Insights for Sturminster Marshall
- The Airbnb seasonality in Sturminster Marshall shows highly seasonal trends requiring careful strategy. While the sections above show seasonal averages, it's also insightful to look at the extremes:
- During the high season, the absolute peak month showcases Sturminster Marshall's highest earning potential, with monthly revenues capable of climbing to $3,526, occupancy reaching a high of 55.7%, and ADRs peaking at $242.
- Conversely, the slowest single month of the year, typically falling within the low season, marks the market's lowest point. In this month, revenue might dip to $1,549, occupancy could drop to 35.5%, and ADRs may adjust down to $162.
- Understanding both the seasonal averages and these monthly peaks and troughs in revenue, occupancy, and ADR is crucial for maximizing your Airbnb profit potential in Sturminster Marshall.
Seasonal Strategies for Maximizing Profit
- Peak Season: Maximize revenue through premium pricing and potentially longer minimum stays. Ensure high availability.
- Low Season: Offer competitive pricing, special promotions (e.g., extended stay discounts), and flexible cancellation policies. Target off-season travelers like remote workers or budget-conscious guests.
- Shoulder Seasons: Implement dynamic pricing that balances peak and low rates. Target weekend travelers or specific events. Offer slightly more flexible terms than peak season.
- Regularly analyze your own performance against these Sturminster Marshall seasonality benchmarks and adjust your pricing and availability strategy accordingly.
Best Areas for Airbnb Investment in Sturminster Marshall (2025)
Exploring the top neighborhoods for short-term rentals in Sturminster Marshall? This section highlights key areas, outlining why they are attractive for hosts and guests, along with notable local attractions. Consider these locations based on your target guest profile and investment strategy.
| Neighborhood / Area | Why Host Here? (Target Guests & Appeal) | Key Attractions & Landmarks |
|---|---|---|
| Sturminster Marshall Village | A picturesque village located near the River Stour, offering a peaceful environment and local charm. Ideal for those seeking a country retreat close to Dorset's attractions. | Sturminster Marshall Church, River Stour, Local pubs and cafes, Scenic walking trails |
| Wimborne Minster | Just a short drive away, this vibrant town is famous for its historic minster and quaint shops, attracting both tourists and locals. | Wimborne Minster, The Tivoli Theatre, Bishop's Palace Gardens, The Wimborne Model Town |
| Canford Heath | This area is known for its beautiful heathland and is popular for outdoor activities. Great for those who enjoy nature and walking trails. | Canford Heath Heathland, Walking and cycling paths, Wildlife spotting |
| Corfe Mullen | A suburban area with easy access to the surrounding countryside, making it popular among families and those wanting to explore the Purbecks. | Local parks, Nearby nature reserves, Access to Purbeck Hills |
| Poole | A coastal town with a beautiful harbor and sandy beaches, making it a hotspot for beachgoers and water sports enthusiasts. | Poole Harbour, Sandbanks Beach, Brownsea Island, Poole Quay |
| Blandford Forum | A historic market town that attracts visitors with its attractive Georgian architecture and access to the Dorset countryside. | Blandford Forum Town Centre, Dorset County Museum, St. Peter and St. Paul Church |
| Dorchester | As the county town of Dorset, it offers historical attractions and cultural experiences, appealing to a wide range of visitors. | Roman Town House, Dorset County Museum, Max Gate - Thomas Hardy's House |
| Bournemouth | A vibrant seaside resort known for its long beaches, gardens, and nightlife, ideal for attracting holidaymakers. | Bournemouth Beach, Bournemouth Pier, The Bournemouth International Centre, Gardens and parks |
Understanding Airbnb License Requirements & STR Laws in Sturminster Marshall (2025)
While Sturminster Marshall, England, United Kingdom currently shows low STR regulations, specific Airbnb license requirements might still exist or change. Always verify the latest short term rental regulations and Airbnb license requirements directly with local government authorities for Sturminster Marshall to ensure full compliance before hosting.
(Source: AirROI data, 2025, finding no licensed listings among those analyzed)
Top Performing Airbnb Properties in Sturminster Marshall (2025)
Benchmark your potential! Explore examples of top-performing Airbnb properties in Sturminster Marshallbased on Trailing Twelve Month (TTM) revenue. Analyze their characteristics, revenue, occupancy rate, and ADR to understand what drives success in this market.

Lakeside Lodge by Grandeur Property
Entire Place • 3 bedrooms

Bertie - The Double Decker Bus
Entire Place • 3 bedrooms
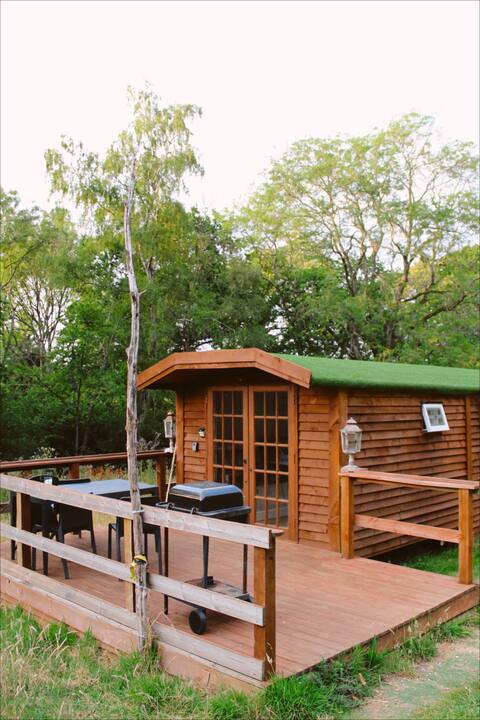
Jabba the Hut - Shepherds Hut- Secluded & Private
Entire Place • 1 bedroom

Treehouse - Floating Tree Sphere
Entire Place • 1 bedroom

Coach House Sturminster Marshall
Entire Place • 3 bedrooms

West View
Entire Place • 3 bedrooms
Note: Performance varies based on location, size, amenities, seasonality, and management quality. Data reflects the past 12 months.
Top Performing Airbnb Hosts in Sturminster Marshall (2025)
Learn from the best! This table showcases top-performing Airbnb hosts in Sturminster Marshall based on the number of properties managed and estimated total revenue over the past year. Analyze their scale and performance metrics.
| Host Name | Properties | Grossing Revenue | Stay Reviews | Avg Rating |
|---|---|---|---|---|
| Rachel | 5 | $94,338 | 1476 | 4.75/5.0 |
| Grandeur Property | 1 | $73,784 | 69 | 4.77/5.0 |
| Gary | 1 | $21,461 | 88 | 4.92/5.0 |
| Rachel | 2 | $20,865 | 157 | 4.74/5.0 |
| Cottages | 1 | $19,994 | 9 | 4.67/5.0 |
| Margaret | 1 | $12,405 | 103 | 4.99/5.0 |
| Joanna | 1 | $11,309 | 28 | 5.00/5.0 |
| Host #160954041 | 1 | $9,043 | 5 | 4.60/5.0 |
| Sykes | 1 | $1,541 | 1 | Not Rated |
| Sylvie | 1 | $1,434 | 61 | 4.87/5.0 |
Analyzing the strategies of top hosts, such as their property selection, pricing, and guest communication, can offer valuable lessons for optimizing your own Airbnb operations in Sturminster Marshall.
Dive Deeper: Advanced Sturminster Marshall STR Market Data (2025)
Ready to unlock more insights? AirROI provides access to advanced metrics and comprehensive Airbnb data for Sturminster Marshall. Explore detailed analytics beyond this report to refine your investment strategy, optimize pricing, and maximize your vacation rental profits.
Explore Advanced MetricsSturminster Marshall Short-Term Rental Market Composition (2025): Property & Room Types
Room Type Distribution
Property Type Distribution
Market Composition Insights for Sturminster Marshall
- The Sturminster Marshall Airbnb market composition is heavily skewed towards Entire Home/Apt listings, which make up 88.9% of the 18 active rentals. This indicates strong guest preference for privacy and space.
- Looking at the property type distribution in Sturminster Marshall, House properties are the most common (44.4%), reflecting the local real estate landscape.
- Houses represent a significant 44.4% portion, catering likely to families or larger groups.
Sturminster Marshall Airbnb Room Capacity Analysis (2025): Bedroom Distribution
Distribution of Listings by Number of Bedrooms
Room Capacity Insights for Sturminster Marshall
- The dominant room capacity in Sturminster Marshall is 3 bedrooms listings, making up 38.9% of the market. This suggests a strong demand for properties suitable for families or small groups.
- Together, 3 bedrooms and 1 bedroom properties represent 66.7% of the active Airbnb listings in Sturminster Marshall, indicating a high concentration in these sizes.
- A significant 38.9% of listings offer 3+ bedrooms, catering to larger groups and families seeking more space in Sturminster Marshall.
Sturminster Marshall Vacation Rental Guest Capacity Trends (2025)
Distribution of Listings by Guest Capacity
Guest Capacity Insights for Sturminster Marshall
- The most common guest capacity trend in Sturminster Marshall vacation rentals is listings accommodating 2 guests (38.9%). This suggests the primary traveler segment is likely couples or solo travelers.
- Properties designed for 2 guests and 6 guests dominate the Sturminster Marshall STR market, accounting for 72.2% of listings.
- 33.3% of properties accommodate 6+ guests, serving the market segment for larger families or group travel in Sturminster Marshall.
- On average, properties in Sturminster Marshall are equipped to host 3.4 guests.
Sturminster Marshall Airbnb Booking Patterns (2025): Available vs. Booked Days
Available Days Distribution
Booked Days Distribution
Booking Pattern Insights for Sturminster Marshall
- The most common availability pattern in Sturminster Marshall falls within the 271-366 days range, representing 66.7% of listings. This suggests many properties have significant open periods on their calendars.
- Approximately 77.8% of listings show high availability (181+ days open annually), indicating potential for increased bookings or specific owner usage patterns.
- For booked days, the 1-30 days range is most frequent in Sturminster Marshall (33.3%), reflecting common guest stay durations or potential owner blocking patterns.
- A notable 27.8% of properties secure long booking periods (181+ days booked per year), highlighting successful long-term rental strategies or significant owner usage.
Sturminster Marshall Airbnb Minimum Stay Requirements Analysis
Distribution of Listings by Minimum Night Requirement
1 Night
10 listings
62.5% of total
2 Nights
2 listings
12.5% of total
3 Nights
1 listings
6.3% of total
30+ Nights
3 listings
18.8% of total
Key Insights
- The most prevalent minimum stay requirement in Sturminster Marshall is 1 Night, adopted by 62.5% of listings. This highlights the market's preference for shorter, flexible bookings.
- A strong majority (75.0%) of the Sturminster Marshall Airbnb data shows acceptance of very short stays (1-2 nights), indicating a dynamic, high-turnover market.
- A significant segment (18.8%) caters to monthly stays (30+ nights) in Sturminster Marshall, pointing to opportunities in the extended-stay market.
Recommendations
- Align with the market by considering a 1 Night minimum stay, as 62.5% of Sturminster Marshall hosts use this setting.
- Explore offering discounts for stays of 30+ nights to attract the 18.8% of the market seeking extended stays.
- Adjust minimum nights based on seasonality – potentially shorter during low season and longer during peak demand periods in Sturminster Marshall.
Sturminster Marshall Airbnb Cancellation Policy Trends Analysis (2025)
Super Strict 60 Days
2 listings
11.8% of total
Flexible
4 listings
23.5% of total
Moderate
7 listings
41.2% of total
Firm
1 listings
5.9% of total
Strict
3 listings
17.6% of total
Cancellation Policy Insights for Sturminster Marshall
- The prevailing Airbnb cancellation policy trend in Sturminster Marshall is Moderate, used by 41.2% of listings.
- There's a relatively balanced mix between guest-friendly (64.7%) and stricter (23.5%) policies, offering choices for different guest needs.
Recommendations for Hosts
- Consider adopting a Moderate policy to align with the 41.2% market standard in Sturminster Marshall.
- Regularly review your cancellation policy against competitors and market demand shifts in Sturminster Marshall.
Sturminster Marshall STR Booking Lead Time Analysis (2025)
Average Booking Lead Time by Month
Booking Lead Time Insights for Sturminster Marshall
- The overall average booking lead time for vacation rentals in Sturminster Marshall is 35 days.
- Guests book furthest in advance for stays during September (average 50 days), likely coinciding with peak travel demand or local events.
- The shortest booking windows occur for stays in November (average 24 days), indicating more last-minute travel plans during this time.
- Seasonally, Winter (47 days avg.) sees the longest lead times, while Fall (33 days avg.) has the shortest, reflecting typical travel planning cycles.
Recommendations for Hosts
- Use the overall average lead time (35 days) as a baseline for your pricing and availability strategy in Sturminster Marshall.
- For September stays, consider implementing length-of-stay discounts or slightly higher rates for bookings made less than 50 days out to capitalize on advance planning.
- Target marketing efforts for the Winter season well in advance (at least 47 days) to capture early planners.
- Monitor your own booking lead times against these Sturminster Marshall averages to identify opportunities for dynamic pricing adjustments.
Popular & Essential Airbnb Amenities in Sturminster Marshall (2025)
Amenity data is currently unavailable for Sturminster Marshall.
Sturminster Marshall Airbnb Guest Demographics & Profile Analysis (2025)
Guest Profile Summary for Sturminster Marshall
- The typical guest profile for Airbnb in Sturminster Marshall consists of primarily domestic travelers (95%), often arriving from nearby London, typically belonging to the Post-2000s (Gen Z/Alpha) group (50%), primarily speaking English or French.
- Domestic travelers account for 95.2% of guests.
- Key international markets include United Kingdom (95.2%) and Australia (0.7%).
- Top languages spoken are English (72.7%) followed by French (3%).
- A significant demographic segment is the Post-2000s (Gen Z/Alpha) group, representing 50% of guests.
Recommendations for Hosts
- Target domestic marketing efforts towards travelers from London and England.
- Tailor amenities and listing descriptions to appeal to the dominant Post-2000s (Gen Z/Alpha) demographic (e.g., highlight fast WiFi, smart home features, local guides).
- Highlight unique local experiences or amenities relevant to the primary guest profile.
- Consider seasonal promotions aligned with peak travel times for key origin markets.
Nearby Short-Term Rental Market Comparison
How does the Sturminster Marshall Airbnb market stack up against its neighbors? Compare key performance metrics like average monthly revenue, ADR, and occupancy rates in surrounding areas to understand the broader regional STR landscape.
| Market | Active Properties | Monthly Revenue | Daily Rate | Avg. Occupancy |
|---|---|---|---|---|
| Chew Magna | 14 | $7,116 | $417.27 | 46% |
| Englishcombe | 15 | $6,386 | $526.47 | 49% |
| Long Sutton | 16 | $6,243 | $407.18 | 45% |
| Ashley | 12 | $5,408 | $388.63 | 51% |
| Lambourn | 13 | $5,330 | $650.25 | 28% |
| Kintbury | 10 | $4,970 | $260.66 | 55% |
| Oldland Common | 14 | $4,523 | $414.55 | 40% |
| Pensford | 10 | $4,504 | $849.80 | 37% |
| Dinton | 12 | $4,397 | $279.11 | 56% |
| Crai | 32 | $4,387 | $501.90 | 39% |