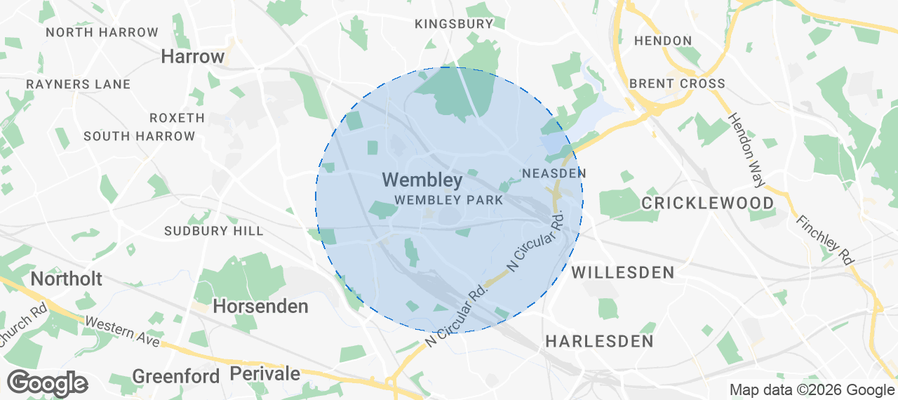
Wembley Park Airbnb Market Analysis 2026: Short Term Rental Data & Vacation Rental Statistics in England, United Kingdom
Is Airbnb profitable in Wembley Park in 2026? Explore comprehensive Airbnb analytics for Wembley Park, England, United Kingdom to uncover income potential. This 2026 STR market report for Wembley Park, based on AirROI data from February 2025 to January 2026, reveals key trends in the niche market of 19 active listings.
Whether you're considering an Airbnb investment in Wembley Park, optimizing your existing vacation rental, or exploring rental arbitrage opportunities, understanding the Wembley Park Airbnb data is crucial. Leveraging the low regulation environment is key to maximizing your short term rental income potential. Let's dive into the specifics.
Key Wembley Park Airbnb Performance Metrics Overview
Monthly Airbnb Revenue Variations & Income Potential in Wembley Park (2026)
Understanding the monthly revenue variations for Airbnb listings in Wembley Park is key to maximizing your short term rental income potential. Seasonality significantly impacts earnings. Our analysis, based on data from the past 12 months, shows that the peak revenue month for STRs in Wembley Park is typically June, while May often presents the lowest earnings, highlighting opportunities for strategic pricing adjustments during shoulder and low seasons. Explore the typical Airbnb income in Wembley Park across different performance tiers:
- Best-in-class properties (Top 10%) achieve $7,169+ monthly, often utilizing dynamic pricing and superior guest experiences.
- Strong performing properties (Top 25%) earn $4,515 or more, indicating effective management and desirable locations/amenities.
- Typical properties (Median) generate around $3,127 per month, representing the average market performance.
- Entry-level properties (Bottom 25%) see earnings around $1,299, often with potential for optimization.
Average Monthly Airbnb Earnings Trend in Wembley Park
Wembley Park Airbnb Occupancy Rate Trends (2026)
Maximize your bookings by understanding the Wembley Park STR occupancy trends. Seasonal demand shifts significantly influence how often properties are booked. Typically, Junesees the highest demand (peak season occupancy), while May experiences the lowest (low season). Effective strategies, like adjusting minimum stays or offering promotions, can boost occupancy during slower periods. Here's how different property tiers perform in Wembley Park:
- Best-in-class properties (Top 10%) achieve 68%+ occupancy, indicating high desirability and potentially optimized availability.
- Strong performing properties (Top 25%) maintain 54% or higher occupancy, suggesting good market fit and guest satisfaction.
- Typical properties (Median) have an occupancy rate around 40%.
- Entry-level properties (Bottom 25%) average 28% occupancy, potentially facing higher vacancy.
Average Monthly Occupancy Rate Trend in Wembley Park
Average Daily Rate (ADR) Airbnb Trends in Wembley Park (2026)
Effective short term rental pricing strategy in Wembley Park involves understanding monthly ADR fluctuations. The Average Daily Rate (ADR) for Airbnb in Wembley Park typically peaks in September and dips lowest during January. Leveraging Airbnb dynamic pricing tools or strategies based on this seasonality can significantly boost revenue. Here's a look at the typical nightly rates achieved:
- Best-in-class properties (Top 10%) command rates of $428+ per night, often due to premium features or locations.
- Strong performing properties (Top 25%) achieve nightly rates of $306 or more.
- Typical properties (Median) charge around $264 per night.
- Entry-level properties (Bottom 25%) earn around $188 per night.
Average Daily Rate (ADR) Trend by Month in Wembley Park
Get Live Wembley Park Market Intelligence 👇
Explore Real-time Analytics
Airbnb Seasonality Analysis & Trends in Wembley Park (2026)
Peak Season (June, December, July)
- Revenue averages $4,616 per month
- Occupancy rates average 54.6%
- Daily rates average $256
Shoulder Season
- Revenue averages $2,920 per month
- Occupancy maintains around 35.0%
- Daily rates hold near $249
Low Season (February, March, April)
- Revenue drops to average $0 per month
- Occupancy decreases to average 0.0%
- Daily rates adjust to average $265
Seasonality Insights for Wembley Park
- The Airbnb seasonality in Wembley Park shows highly seasonal trends requiring careful strategy. While the sections above show seasonal averages, it's also insightful to look at the extremes:
- During the high season, the absolute peak month showcases Wembley Park's highest earning potential, with monthly revenues capable of climbing to $4,952, occupancy reaching a high of 59.0%, and ADRs peaking at $278.
- Conversely, the slowest single month of the year, typically falling within the low season, marks the market's lowest point. In this month, revenue might dip to $0, occupancy could drop to 0.0%, and ADRs may adjust down to $214.
- Understanding both the seasonal averages and these monthly peaks and troughs in revenue, occupancy, and ADR is crucial for maximizing your Airbnb profit potential in Wembley Park.
Seasonal Strategies for Maximizing Profit
- Peak Season: Maximize revenue through premium pricing and potentially longer minimum stays. Ensure high availability.
- Low Season: Offer competitive pricing, special promotions (e.g., extended stay discounts), and flexible cancellation policies. Target off-season travelers like remote workers or budget-conscious guests.
- Shoulder Seasons: Implement dynamic pricing that balances peak and low rates. Target weekend travelers or specific events. Offer slightly more flexible terms than peak season.
- Regularly analyze your own performance against these Wembley Park seasonality benchmarks and adjust your pricing and availability strategy accordingly.
Best Areas for Airbnb Investment in Wembley Park (2026)
Exploring the top neighborhoods for short-term rentals in Wembley Park? This section highlights key areas, outlining why they are attractive for hosts and guests, along with notable local attractions. Consider these locations based on your target guest profile and investment strategy.
| Neighborhood / Area | Why Host Here? (Target Guests & Appeal) | Key Attractions & Landmarks |
|---|---|---|
| Wembley Stadium Area | Home to the iconic Wembley Stadium, making it an attractive spot for sports fans and event-goers. Perfect for guests attending concerts, games, and other major events. | Wembley Stadium, FA Cup Final, Wembley Arena, London Designer Outlet, The SSE Arena, Wembley |
| Wembley Park | A vibrant suburb undergoing significant development with new shops, restaurants, and cultural events. Great for families and travelers seeking a modern living experience. | Wembley Park Boulevard, London Designer Outlet, Boxpark Wembley, Wembley Park Theatre, Skyline View |
| Brent Reservoir | A peaceful area with scenic views and outdoor activities. Ideal for those looking to relax and enjoy nature while being close to urban amenities. | Brent Reservoir, Fishing and boating activities, Walking trails, Nearby parks |
| The Yellow Pavilion | Located near the heart of Wembley Park, this area features a mixture of cultural attractions and community events, offering a unique experience for visitors. | The Yellow Pavilion, Community events, Art installations, Food markets |
| Ealing Road | Known for its diverse range of restaurants and shops, particularly Indian and Asian cuisine, this area attracts foodies and cultural explorers. | Ealing Road shops, Cultural festivals, Religious sites, Local eateries |
| Wembley Central | A lively area with a mix of residential and commercial spaces, providing easy access to public transport and various local amenities. | Wembley Central Station, Local shops and cafes, Community parks |
| Neasden | A nearby area that offers a suburban feel while still providing quick transport links to Central London, often overlooked by tourists. | Neasden Temple, Local parks, Transport links to London |
| Alperton | Emerging as a residential and business hotspot with its proximity to the Grand Union Canal and good transport, attracts young professionals. | Grand Union Canal, Local parks, Alperton Station, Transport links |
Understanding Airbnb License Requirements & STR Laws in Wembley Park (2026)
While Wembley Park, England, United Kingdom currently shows low STR regulations, specific Airbnb license requirements might still exist or change. Always verify the latest short term rental regulations and Airbnb license requirements directly with local government authorities for Wembley Park to ensure full compliance before hosting.
(Source: AirROI data, 2026, finding no licensed listings among those analyzed)
Top Performing Airbnb Properties in Wembley Park (2026)
Benchmark your potential! Explore examples of top-performing Airbnb properties in Wembley Parkbased on Trailing Twelve Month (TTM) revenue. Analyze their characteristics, revenue, occupancy rate, and ADR to understand what drives success in this market.

Dakota Apartment | Wembley Stadium
Entire Place • 2 bedrooms

Homey and Secure apartment - Wembley Stadium!
Entire Place • 2 bedrooms

Montana Apartment | Wembley Stadium
Entire Place • 2 bedrooms

Wembley Stadium 2 bedroom apartment - 1 min walk
Entire Place • 2 bedrooms

Family Apartment - Wembley Stadium!
Entire Place • 2 bedrooms

3 Bed-Maisonette Wembley stadium
Entire Place • 3 bedrooms
Note: Performance varies based on location, size, amenities, seasonality, and management quality. Data reflects the past 12 months.
Top Performing Airbnb Hosts in Wembley Park (2026)
Learn from the best! This table showcases top-performing Airbnb hosts in Wembley Park based on the number of properties managed and estimated total revenue over the past year. Analyze their scale and performance metrics.
| Host Name | Properties | Grossing Revenue | Stay Reviews | Avg Rating |
|---|---|---|---|---|
| Andy | 2 | $111,499 | 24 | 4.91/5.0 |
| Laila | 5 | $62,964 | 13 | 4.58/5.0 |
| Akrox | 1 | $51,955 | 80 | 4.80/5.0 |
| Nishel | 1 | $37,423 | 23 | 4.91/5.0 |
| Wasity Bros. | 1 | $33,298 | 7 | 4.71/5.0 |
| Sama | 1 | $23,665 | 4 | 4.75/5.0 |
| Rated Apartments | 1 | $22,083 | 4 | 4.75/5.0 |
| Esmeralda | 1 | $20,678 | 19 | 4.95/5.0 |
| Juhaina | 1 | $18,601 | 3 | 5.00/5.0 |
| Ezra | 1 | $17,659 | 16 | 4.56/5.0 |
Analyzing the strategies of top hosts, such as their property selection, pricing, and guest communication, can offer valuable lessons for optimizing your own Airbnb operations in Wembley Park.
Dive Deeper: Advanced Wembley Park STR Market Data (2026)
Ready to unlock more insights? AirROI provides access to advanced metrics and comprehensive Airbnb data for Wembley Park. Explore detailed analytics beyond this report to refine your investment strategy, optimize pricing, and maximize your vacation rental profits.
Explore Advanced MetricsWembley Park Short-Term Rental Market Composition (2026): Property & Room Types
Room Type Distribution
Property Type Distribution
Market Composition Insights for Wembley Park
- The Wembley Park Airbnb market composition is heavily skewed towards Entire Home/Apt listings, which make up 84.2% of the 19 active rentals. This indicates strong guest preference for privacy and space.
- Looking at the property type distribution in Wembley Park, Apartment/Condo properties are the most common (89.5%), reflecting the local real estate landscape.
Wembley Park Airbnb Room Capacity Analysis (2026): Bedroom Distribution
Distribution of Listings by Number of Bedrooms
Room Capacity Insights for Wembley Park
- The dominant room capacity in Wembley Park is 2 bedrooms listings, making up 47.4% of the market. This suggests a strong demand for properties suitable for couples or solo travelers.
- Together, 2 bedrooms and 1 bedroom properties represent 73.7% of the active Airbnb listings in Wembley Park, indicating a high concentration in these sizes.
- Listings with 3+ bedrooms (5.3%) represent a smaller niche, potentially indicating an underserved market for larger group accommodations in Wembley Park.
Wembley Park Vacation Rental Guest Capacity Trends (2026)
Distribution of Listings by Guest Capacity
Guest Capacity Insights for Wembley Park
- The most common guest capacity trend in Wembley Park vacation rentals is listings accommodating 6 guests (26.3%). This suggests the primary traveler segment is likely larger groups.
- Properties designed for 6 guests and 4 guests dominate the Wembley Park STR market, accounting for 47.4% of listings.
- 26.3% of properties accommodate 6+ guests, serving the market segment for larger families or group travel in Wembley Park.
- On average, properties in Wembley Park are equipped to host 3.7 guests.
Wembley Park Airbnb Booking Patterns (2026): Available vs. Booked Days
Available Days Distribution
Booked Days Distribution
Booking Pattern Insights for Wembley Park
- The most common availability pattern in Wembley Park falls within the 271-366 days range, representing 68.4% of listings. This suggests many properties have significant open periods on their calendars.
- Approximately 100.0% of listings show high availability (181+ days open annually), indicating potential for increased bookings or specific owner usage patterns.
- For booked days, the 31-90 days range is most frequent in Wembley Park (57.9%), reflecting common guest stay durations or potential owner blocking patterns.
- A notable 5.3% of properties secure long booking periods (181+ days booked per year), highlighting successful long-term rental strategies or significant owner usage.
Wembley Park Airbnb Minimum Stay Requirements Analysis
Distribution of Listings by Minimum Night Requirement
1 Night
6 listings
31.6% of total
2 Nights
2 listings
10.5% of total
4-6 Nights
1 listings
5.3% of total
7-29 Nights
1 listings
5.3% of total
30+ Nights
9 listings
47.4% of total
Key Insights
- The most prevalent minimum stay requirement in Wembley Park is 30+ Nights, adopted by 47.4% of listings. This highlights the market's preference for longer commitments.
- A significant segment (47.4%) caters to monthly stays (30+ nights) in Wembley Park, pointing to opportunities in the extended-stay market.
Recommendations
- Align with the market by considering a 30+ Nights minimum stay, as 47.4% of Wembley Park hosts use this setting.
- Explore offering discounts for stays of 30+ nights to attract the 47.4% of the market seeking extended stays.
- Adjust minimum nights based on seasonality – potentially shorter during low season and longer during peak demand periods in Wembley Park.
Wembley Park Airbnb Cancellation Policy Trends Analysis (2026)
Super Strict 60 Days
2 listings
10.5% of total
Moderate
8 listings
42.1% of total
Firm
8 listings
42.1% of total
Strict
1 listings
5.3% of total
Cancellation Policy Insights for Wembley Park
- The prevailing Airbnb cancellation policy trend in Wembley Park is Moderate, used by 42.1% of listings.
- There's a relatively balanced mix between guest-friendly (42.1%) and stricter (47.4%) policies, offering choices for different guest needs.
- Strict cancellation policies are quite rare (5.3%), potentially making listings with this policy less competitive unless justified by high demand or property type.
Recommendations for Hosts
- Consider adopting a Moderate policy to align with the 42.1% market standard in Wembley Park.
- Using a Strict policy might deter some guests, as only 5.3% of listings use it. Evaluate if potential revenue protection outweighs possible lower booking rates.
- Regularly review your cancellation policy against competitors and market demand shifts in Wembley Park.
Wembley Park STR Booking Lead Time Analysis (2026)
Average Booking Lead Time by Month
Booking Lead Time Insights for Wembley Park
- The overall average booking lead time for vacation rentals in Wembley Park is 28 days.
- Guests book furthest in advance for stays during October (average 67 days), likely coinciding with peak travel demand or local events.
- The shortest booking windows occur for stays in April (average 0 days), indicating more last-minute travel plans during this time.
- Seasonally, Fall (53 days avg.) sees the longest lead times, while Spring (1 days avg.) has the shortest, reflecting typical travel planning cycles.
Recommendations for Hosts
- Use the overall average lead time (28 days) as a baseline for your pricing and availability strategy in Wembley Park.
- For October stays, consider implementing length-of-stay discounts or slightly higher rates for bookings made less than 67 days out to capitalize on advance planning.
- During April, focus on last-minute booking availability and promotions, as guests book with very short notice (0 days avg.).
- Target marketing efforts for the Fall season well in advance (at least 53 days) to capture early planners.
- Monitor your own booking lead times against these Wembley Park averages to identify opportunities for dynamic pricing adjustments.
Popular & Essential Airbnb Amenities in Wembley Park (2026)
Amenity Prevalence
Amenity Insights for Wembley Park
- Popular amenities like Bed linens, Microwave, Wifi are common but not universal. Offering these can provide a competitive edge.
- Warning: Wifi is not universally provided but is considered essential globally. Ensure reliable Wifi is offered.
Recommendations for Hosts
- Consider adding popular differentiators like Bed linens or Microwave to increase appeal.
- Highlight unique or less common amenities you offer (e.g., hot tub, dedicated workspace, EV charger) in your listing description and photos.
- Regularly check competitor amenities in Wembley Park to stay competitive.
Wembley Park Airbnb Guest Demographics & Profile Analysis (2026)
Guest Profile Summary for Wembley Park
- The typical guest profile for Airbnb in Wembley Park consists of primarily domestic travelers (81%), often arriving from nearby England, typically belonging to the Post-2000s (Gen Z/Alpha) group (50%), primarily speaking English or French.
- Domestic travelers account for 80.8% of guests.
- Key international markets include United Kingdom (80.8%) and United States (3.8%).
- Top languages spoken are English (55.6%) followed by French (13%).
- A significant demographic segment is the Post-2000s (Gen Z/Alpha) group, representing 50% of guests.
Recommendations for Hosts
- Target domestic marketing efforts towards travelers from England and London.
- Tailor amenities and listing descriptions to appeal to the dominant Post-2000s (Gen Z/Alpha) demographic (e.g., highlight fast WiFi, smart home features, local guides).
- Highlight unique local experiences or amenities relevant to the primary guest profile.
- Consider seasonal promotions aligned with peak travel times for key origin markets.
Nearby Short-Term Rental Market Comparison
How does the Wembley Park Airbnb market stack up against its neighbors? Compare key performance metrics like average monthly revenue, ADR, and occupancy rates in surrounding areas to understand the broader regional STR landscape.
| Market | Active Properties | Monthly Revenue | Daily Rate | Avg. Occupancy |
|---|---|---|---|---|
| Dorney | 11 | $7,510 | $743.63 | 39% |
| Lambourn | 11 | $6,499 | $723.41 | 31% |
| Wraysbury | 16 | $6,199 | $530.56 | 49% |
| City of Westminster | 1,424 | $6,053 | $515.72 | 50% |
| Dinton | 11 | $4,871 | $292.60 | 52% |
| Furzehill | 10 | $4,680 | $287.32 | 49% |
| Shrewton | 15 | $4,402 | $465.24 | 44% |
| Alderbury | 21 | $4,337 | $357.78 | 47% |
| Old Windsor | 20 | $4,177 | $286.69 | 49% |
| Cookham | 20 | $4,138 | $347.79 | 47% |