Wolsingham Airbnb Market Analysis 2026: Short Term Rental Data & Vacation Rental Statistics in England, United Kingdom
Is Airbnb profitable in Wolsingham in 2026? Explore comprehensive Airbnb analytics for Wolsingham, England, United Kingdom to uncover income potential. This 2026 STR market report for Wolsingham, based on AirROI data from February 2025 to January 2026, reveals key trends in the niche market of 27 active listings.
Whether you're considering an Airbnb investment in Wolsingham, optimizing your existing vacation rental, or exploring rental arbitrage opportunities, understanding the Wolsingham Airbnb data is crucial. Leveraging the low regulation environment is key to maximizing your short term rental income potential. Let's dive into the specifics.
Key Wolsingham Airbnb Performance Metrics Overview
Monthly Airbnb Revenue Variations & Income Potential in Wolsingham (2026)
Understanding the monthly revenue variations for Airbnb listings in Wolsingham is key to maximizing your short term rental income potential. Seasonality significantly impacts earnings. Our analysis, based on data from the past 12 months, shows that the peak revenue month for STRs in Wolsingham is typically April, while January often presents the lowest earnings, highlighting opportunities for strategic pricing adjustments during shoulder and low seasons. Explore the typical Airbnb income in Wolsingham across different performance tiers:
- Best-in-class properties (Top 10%) achieve $8,275+ monthly, often utilizing dynamic pricing and superior guest experiences.
- Strong performing properties (Top 25%) earn $4,432 or more, indicating effective management and desirable locations/amenities.
- Typical properties (Median) generate around $2,353 per month, representing the average market performance.
- Entry-level properties (Bottom 25%) see earnings around $1,336, often with potential for optimization.
Average Monthly Airbnb Earnings Trend in Wolsingham
Wolsingham Airbnb Occupancy Rate Trends (2026)
Maximize your bookings by understanding the Wolsingham STR occupancy trends. Seasonal demand shifts significantly influence how often properties are booked. Typically, Augustsees the highest demand (peak season occupancy), while January experiences the lowest (low season). Effective strategies, like adjusting minimum stays or offering promotions, can boost occupancy during slower periods. Here's how different property tiers perform in Wolsingham:
- Best-in-class properties (Top 10%) achieve 79%+ occupancy, indicating high desirability and potentially optimized availability.
- Strong performing properties (Top 25%) maintain 60% or higher occupancy, suggesting good market fit and guest satisfaction.
- Typical properties (Median) have an occupancy rate around 35%.
- Entry-level properties (Bottom 25%) average 21% occupancy, potentially facing higher vacancy.
Average Monthly Occupancy Rate Trend in Wolsingham
Average Daily Rate (ADR) Airbnb Trends in Wolsingham (2026)
Effective short term rental pricing strategy in Wolsingham involves understanding monthly ADR fluctuations. The Average Daily Rate (ADR) for Airbnb in Wolsingham typically peaks in October and dips lowest during March. Leveraging Airbnb dynamic pricing tools or strategies based on this seasonality can significantly boost revenue. Here's a look at the typical nightly rates achieved:
- Best-in-class properties (Top 10%) command rates of $557+ per night, often due to premium features or locations.
- Strong performing properties (Top 25%) achieve nightly rates of $403 or more.
- Typical properties (Median) charge around $193 per night.
- Entry-level properties (Bottom 25%) earn around $137 per night.
Average Daily Rate (ADR) Trend by Month in Wolsingham
Get Live Wolsingham Market Intelligence 👇

Explore Real-time Analytics
Airbnb Seasonality Analysis & Trends in Wolsingham (2026)
Peak Season (April, May, August)
- Revenue averages $4,866 per month
- Occupancy rates average 51.7%
- Daily rates average $293
Shoulder Season
- Revenue averages $3,511 per month
- Occupancy maintains around 41.6%
- Daily rates hold near $299
Low Season (January, February, June)
- Revenue drops to average $2,403 per month
- Occupancy decreases to average 29.4%
- Daily rates adjust to average $294
Seasonality Insights for Wolsingham
- The Airbnb seasonality in Wolsingham shows highly seasonal trends requiring careful strategy. While the sections above show seasonal averages, it's also insightful to look at the extremes:
- During the high season, the absolute peak month showcases Wolsingham's highest earning potential, with monthly revenues capable of climbing to $5,455, occupancy reaching a high of 52.7%, and ADRs peaking at $317.
- Conversely, the slowest single month of the year, typically falling within the low season, marks the market's lowest point. In this month, revenue might dip to $1,719, occupancy could drop to 21.2%, and ADRs may adjust down to $276.
- Understanding both the seasonal averages and these monthly peaks and troughs in revenue, occupancy, and ADR is crucial for maximizing your Airbnb profit potential in Wolsingham.
Seasonal Strategies for Maximizing Profit
- Peak Season: Maximize revenue through premium pricing and potentially longer minimum stays. Ensure high availability.
- Low Season: Offer competitive pricing, special promotions (e.g., extended stay discounts), and flexible cancellation policies. Target off-season travelers like remote workers or budget-conscious guests.
- Shoulder Seasons: Implement dynamic pricing that balances peak and low rates. Target weekend travelers or specific events. Offer slightly more flexible terms than peak season.
- Regularly analyze your own performance against these Wolsingham seasonality benchmarks and adjust your pricing and availability strategy accordingly.
Best Areas for Airbnb Investment in Wolsingham (2026)
Exploring the top neighborhoods for short-term rentals in Wolsingham? This section highlights key areas, outlining why they are attractive for hosts and guests, along with notable local attractions. Consider these locations based on your target guest profile and investment strategy.
| Neighborhood / Area | Why Host Here? (Target Guests & Appeal) | Key Attractions & Landmarks |
|---|---|---|
| Wolsingham Town Centre | The heart of Wolsingham with charming streets, local shops, and cafes. Ideal for visitors wanting to experience the local culture and amenities. | St. Thomas' Church, Local artisan shops, Wolsingham Park, Cafes and local eateries |
| Weardale Way | A scenic route through the beautiful countryside of Weardale, attracting hikers and nature lovers. Perfect for guests looking for adventure and the outdoors. | Weardale Railway, The river wear, Walking trails, Local wildlife |
| The Old Mill | A historic site converted for leisure, providing a unique stay with stunning views of the river and surrounding area. Great for those looking for a peaceful retreat. | The Old Mill pub, River walks, Local nature spots |
| The Durham Dales | A short drive from Wolsingham, this area offers stunning landscapes and is perfect for outdoor enthusiasts. Ideal for guests who want to explore the beautiful North Pennines. | North Pennines Area of Outstanding Natural Beauty, Hiking trails, Scenic viewpoints |
| Stanhope | A nearby town with rich history and character, offering a range of activities and proximity to natural areas, suitable for family vacations. | Stanhope Castle, Nearby waterfalls, Local markets |
| Bishop Auckland | A larger nearby town with historical attractions and amenities, ideal for guests who want a mix of history and modern facilities. | Auckland Castle, Binchester Roman Fort, Shopping and dining options |
| Burnhope | A charming village close to Wolsingham, ideal for those seeking a quiet getaway while still being close to larger attractions. | Local walking routes, Village pubs and restaurants |
| Hamsterley Forest | A large, expansive forest offering a range of outdoor activities including walking, cycling, and picnicking. Perfect for nature-loving guests. | Forest trails, Wildlife spotting, Outdoor adventure activities |
Understanding Airbnb License Requirements & STR Laws in Wolsingham (2026)
While Wolsingham, England, United Kingdom currently shows low STR regulations, specific Airbnb license requirements might still exist or change. Always verify the latest short term rental regulations and Airbnb license requirements directly with local government authorities for Wolsingham to ensure full compliance before hosting.
(Source: AirROI data, 2026, finding no licensed listings among those analyzed)
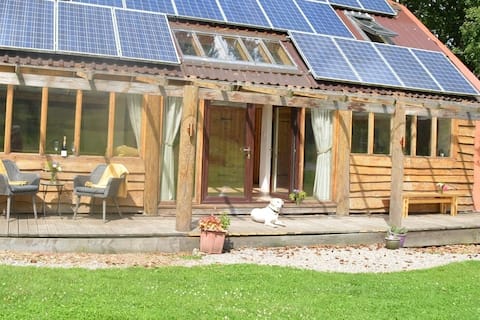
Top Performing Airbnb Properties in Wolsingham (2026)
Benchmark your potential! Explore examples of top-performing Airbnb properties in Wolsinghambased on Trailing Twelve Month (TTM) revenue. Analyze their characteristics, revenue, occupancy rate, and ADR to understand what drives success in this market.
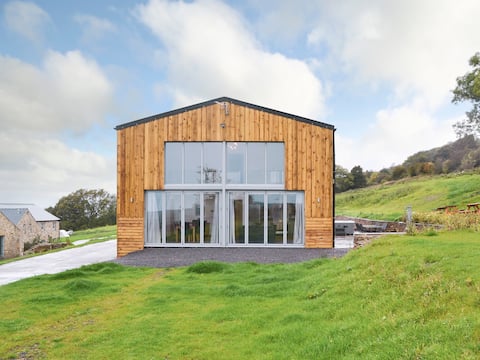
Heartwell Cottage
Entire Place • 6 bedrooms

Idyllic Farmhouse (The perfect retreat)
Entire Place • 4 bedrooms
Causeway Cottage
Entire Place • 2 bedrooms
Cosy quirky spacious cottage
Entire Place • 3 bedrooms

Alder Cottage. North Pennines rural retreat.
Entire Place • 2 bedrooms
Apple Tree Lodge an off grid woodland hideaway
Entire Place • 2 bedrooms
Note: Performance varies based on location, size, amenities, seasonality, and management quality. Data reflects the past 12 months.
Top Performing Airbnb Hosts in Wolsingham (2026)
Learn from the best! This table showcases top-performing Airbnb hosts in Wolsingham based on the number of properties managed and estimated total revenue over the past year. Analyze their scale and performance metrics.
| Host Name | Properties | Grossing Revenue | Stay Reviews | Avg Rating |
|---|---|---|---|---|
| Cottages | 5 | $320,028 | 37 | 4.89/5.0 |
| Elizabeth | 1 | $113,242 | 31 | 4.87/5.0 |
| Holidaycottages.Co.Uk | 2 | $49,029 | 3 | Not Rated |
| Jan | 1 | $42,692 | 18 | 4.89/5.0 |
| Jill | 1 | $41,841 | 107 | 5.00/5.0 |
| Pamela | 1 | $35,434 | 72 | 4.99/5.0 |
| Holidaycottages.Co.Uk | 1 | $28,616 | 3 | 5.00/5.0 |
| David | 1 | $25,847 | 1 | Not Rated |
| Laura | 1 | $25,531 | 18 | 4.83/5.0 |
| Amanda | 1 | $24,677 | 32 | 5.00/5.0 |
Analyzing the strategies of top hosts, such as their property selection, pricing, and guest communication, can offer valuable lessons for optimizing your own Airbnb operations in Wolsingham.
Dive Deeper: Advanced Wolsingham STR Market Data (2026)
Ready to unlock more insights? AirROI provides access to advanced metrics and comprehensive Airbnb data for Wolsingham. Explore detailed analytics beyond this report to refine your investment strategy, optimize pricing, and maximize your vacation rental profits.
Explore Advanced MetricsWolsingham Short-Term Rental Market Composition (2026): Property & Room Types
Room Type Distribution
Property Type Distribution
Market Composition Insights for Wolsingham
- The Wolsingham Airbnb market composition is heavily skewed towards Entire Home/Apt listings, which make up 100% of the 27 active rentals. This indicates strong guest preference for privacy and space.
- Looking at the property type distribution in Wolsingham, House properties are the most common (88.9%), reflecting the local real estate landscape.
- Houses represent a significant 88.9% portion, catering likely to families or larger groups.
- Smaller segments like unique stays, outdoor/unique, apartment/condo (combined 11.1%) offer potential for unique stay experiences.
Wolsingham Airbnb Room Capacity Analysis (2026): Bedroom Distribution
Distribution of Listings by Number of Bedrooms
Room Capacity Insights for Wolsingham
- The dominant room capacity in Wolsingham is 2 bedrooms listings, making up 37% of the market. This suggests a strong demand for properties suitable for couples or solo travelers.
- Together, 2 bedrooms and 3 bedrooms properties represent 62.9% of the active Airbnb listings in Wolsingham, indicating a high concentration in these sizes.
- A significant 44.4% of listings offer 3+ bedrooms, catering to larger groups and families seeking more space in Wolsingham.
Wolsingham Vacation Rental Guest Capacity Trends (2026)
Distribution of Listings by Guest Capacity
Guest Capacity Insights for Wolsingham
- The most common guest capacity trend in Wolsingham vacation rentals is listings accommodating 4 guests (29.6%). This suggests the primary traveler segment is likely small families or groups.
- Properties designed for 4 guests and 6 guests dominate the Wolsingham STR market, accounting for 55.5% of listings.
- 48.1% of properties accommodate 6+ guests, serving the market segment for larger families or group travel in Wolsingham.
- On average, properties in Wolsingham are equipped to host 5.1 guests.
Wolsingham Airbnb Booking Patterns (2026): Available vs. Booked Days
Available Days Distribution
Booked Days Distribution
Booking Pattern Insights for Wolsingham
- The most common availability pattern in Wolsingham falls within the 271-366 days range, representing 48.1% of listings. This suggests many properties have significant open periods on their calendars.
- Approximately 74.0% of listings show high availability (181+ days open annually), indicating potential for increased bookings or specific owner usage patterns.
- For booked days, the 31-90 days range is most frequent in Wolsingham (25.9%), reflecting common guest stay durations or potential owner blocking patterns.
- A notable 25.9% of properties secure long booking periods (181+ days booked per year), highlighting successful long-term rental strategies or significant owner usage.
Wolsingham Airbnb Minimum Stay Requirements Analysis
Distribution of Listings by Minimum Night Requirement
1 Night
6 listings
22.2% of total
2 Nights
9 listings
33.3% of total
3 Nights
5 listings
18.5% of total
30+ Nights
7 listings
25.9% of total
Key Insights
- The most prevalent minimum stay requirement in Wolsingham is 2 Nights, adopted by 33.3% of listings. This highlights the market's preference for shorter, flexible bookings.
- A significant segment (25.9%) caters to monthly stays (30+ nights) in Wolsingham, pointing to opportunities in the extended-stay market.
Recommendations
- Align with the market by considering a 2 Nights minimum stay, as 33.3% of Wolsingham hosts use this setting.
- If feasible, allowing 1-night stays, especially midweek or during low season, could capture last-minute bookings, as only 22.2% currently do.
- Explore offering discounts for stays of 30+ nights to attract the 25.9% of the market seeking extended stays.
- Adjust minimum nights based on seasonality – potentially shorter during low season and longer during peak demand periods in Wolsingham.
Wolsingham Airbnb Cancellation Policy Trends Analysis (2026)
Super Strict 60 Days
11 listings
40.7% of total
Flexible
8 listings
29.6% of total
Moderate
3 listings
11.1% of total
Firm
3 listings
11.1% of total
Strict
2 listings
7.4% of total
Cancellation Policy Insights for Wolsingham
- The prevailing Airbnb cancellation policy trend in Wolsingham is Super Strict 60 Days, used by 40.7% of listings.
- There's a relatively balanced mix between guest-friendly (40.7%) and stricter (18.5%) policies, offering choices for different guest needs.
- Strict cancellation policies are quite rare (7.4%), potentially making listings with this policy less competitive unless justified by high demand or property type.
Recommendations for Hosts
- Consider adopting a Super Strict 60 Days policy to align with the 40.7% market standard in Wolsingham.
- Using a Strict policy might deter some guests, as only 7.4% of listings use it. Evaluate if potential revenue protection outweighs possible lower booking rates.
- Regularly review your cancellation policy against competitors and market demand shifts in Wolsingham.
Wolsingham STR Booking Lead Time Analysis (2026)
Average Booking Lead Time by Month
Booking Lead Time Insights for Wolsingham
- The overall average booking lead time for vacation rentals in Wolsingham is 72 days.
- Guests book furthest in advance for stays during September (average 103 days), likely coinciding with peak travel demand or local events.
- The shortest booking windows occur for stays in June (average 46 days), indicating more last-minute travel plans during this time.
- Seasonally, Fall (80 days avg.) sees the longest lead times, while Summer (61 days avg.) has the shortest, reflecting typical travel planning cycles.
Recommendations for Hosts
- Use the overall average lead time (72 days) as a baseline for your pricing and availability strategy in Wolsingham.
- For September stays, consider implementing length-of-stay discounts or slightly higher rates for bookings made less than 103 days out to capitalize on advance planning.
- Target marketing efforts for the Fall season well in advance (at least 80 days) to capture early planners.
- Monitor your own booking lead times against these Wolsingham averages to identify opportunities for dynamic pricing adjustments.
Popular & Essential Airbnb Amenities in Wolsingham (2026)
Amenity Prevalence
Amenity Insights for Wolsingham
- Essential amenities in Wolsingham that guests expect include: Kitchen, Heating, Smoke alarm, TV, Bed linens. Lacking these (any) could significantly impact bookings.
- Popular amenities like Wifi, Fire extinguisher, Dishwasher are common but not universal. Offering these can provide a competitive edge.
- Warning: Wifi is not universally provided but is considered essential globally. Ensure reliable Wifi is offered.
Recommendations for Hosts
- Ensure your listing includes all essential amenities for Wolsingham: Kitchen, Heating, Smoke alarm, TV, Bed linens.
- Prioritize adding missing essentials: Bed linens.
- Consider adding popular differentiators like Wifi or Fire extinguisher to increase appeal.
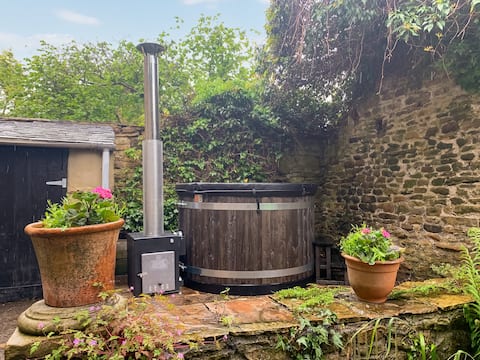
- Highlight unique or less common amenities you offer (e.g., hot tub, dedicated workspace, EV charger) in your listing description and photos.
- Regularly check competitor amenities in Wolsingham to stay competitive.
Wolsingham Airbnb Guest Demographics & Profile Analysis (2026)
Guest Profile Summary for Wolsingham
- The typical guest profile for Airbnb in Wolsingham consists of primarily domestic travelers (92%), often arriving from nearby England, typically belonging to the Post-2000s (Gen Z/Alpha) group (50%), primarily speaking English or French.
- Domestic travelers account for 92.1% of guests.
- Key international markets include United Kingdom (92.1%) and Germany (2.2%).
- Top languages spoken are English (64.5%) followed by French (9.7%).
- A significant demographic segment is the Post-2000s (Gen Z/Alpha) group, representing 50% of guests.
Recommendations for Hosts
- Target domestic marketing efforts towards travelers from England and Edinburgh.
- Tailor amenities and listing descriptions to appeal to the dominant Post-2000s (Gen Z/Alpha) demographic (e.g., highlight fast WiFi, smart home features, local guides).
- Highlight unique local experiences or amenities relevant to the primary guest profile.
- Consider seasonal promotions aligned with peak travel times for key origin markets.
Nearby Short-Term Rental Market Comparison
How does the Wolsingham Airbnb market stack up against its neighbors? Compare key performance metrics like average monthly revenue, ADR, and occupancy rates in surrounding areas to understand the broader regional STR landscape.
| Market | Active Properties | Monthly Revenue | Daily Rate | Avg. Occupancy |
|---|---|---|---|---|
| Stamford Bridge | 11 | $4,828 | $418.84 | 39% |
| Cartmel Fell | 23 | $4,560 | $364.59 | 48% |
| Burneside | 10 | $4,526 | $331.60 | 54% |
| Grinton | 12 | $4,363 | $338.85 | 48% |
| Ellingham | 12 | $4,350 | $318.71 | 51% |
| Bowness-on-Windermere | 358 | $4,223 | $357.92 | 45% |
| High Newton by the Sea | 19 | $4,216 | $506.29 | 39% |
| Hayton | 16 | $4,173 | $258.03 | 57% |
| Tollerton | 12 | $4,121 | $303.75 | 52% |
| Holy Island | 14 | $4,102 | $326.39 | 58% |