Wrington Airbnb Market Analysis 2026: Short Term Rental Data & Vacation Rental Statistics in England, United Kingdom
Is Airbnb profitable in Wrington in 2026? Explore comprehensive Airbnb analytics for Wrington, England, United Kingdom to uncover income potential. This 2026 STR market report for Wrington, based on AirROI data from February 2025 to January 2026, reveals key trends in the niche market of 20 active listings.
Whether you're considering an Airbnb investment in Wrington, optimizing your existing vacation rental, or exploring rental arbitrage opportunities, understanding the Wrington Airbnb data is crucial. Leveraging the low regulation environment is key to maximizing your short term rental income potential. Let's dive into the specifics.
Key Wrington Airbnb Performance Metrics Overview
Monthly Airbnb Revenue Variations & Income Potential in Wrington (2026)
Understanding the monthly revenue variations for Airbnb listings in Wrington is key to maximizing your short term rental income potential. Seasonality significantly impacts earnings. Our analysis, based on data from the past 12 months, shows that the peak revenue month for STRs in Wrington is typically March, while January often presents the lowest earnings, highlighting opportunities for strategic pricing adjustments during shoulder and low seasons. Explore the typical Airbnb income in Wrington across different performance tiers:
- Best-in-class properties (Top 10%) achieve $6,719+ monthly, often utilizing dynamic pricing and superior guest experiences.
- Strong performing properties (Top 25%) earn $2,250 or more, indicating effective management and desirable locations/amenities.
- Typical properties (Median) generate around $1,216 per month, representing the average market performance.
- Entry-level properties (Bottom 25%) see earnings around $618, often with potential for optimization.
Average Monthly Airbnb Earnings Trend in Wrington
Wrington Airbnb Occupancy Rate Trends (2026)
Maximize your bookings by understanding the Wrington STR occupancy trends. Seasonal demand shifts significantly influence how often properties are booked. Typically, Augustsees the highest demand (peak season occupancy), while January experiences the lowest (low season). Effective strategies, like adjusting minimum stays or offering promotions, can boost occupancy during slower periods. Here's how different property tiers perform in Wrington:
- Best-in-class properties (Top 10%) achieve 60%+ occupancy, indicating high desirability and potentially optimized availability.
- Strong performing properties (Top 25%) maintain 43% or higher occupancy, suggesting good market fit and guest satisfaction.
- Typical properties (Median) have an occupancy rate around 22%.
- Entry-level properties (Bottom 25%) average 11% occupancy, potentially facing higher vacancy.
Average Monthly Occupancy Rate Trend in Wrington
Average Daily Rate (ADR) Airbnb Trends in Wrington (2026)
Effective short term rental pricing strategy in Wrington involves understanding monthly ADR fluctuations. The Average Daily Rate (ADR) for Airbnb in Wrington typically peaks in October and dips lowest during March. Leveraging Airbnb dynamic pricing tools or strategies based on this seasonality can significantly boost revenue. Here's a look at the typical nightly rates achieved:
- Best-in-class properties (Top 10%) command rates of $575+ per night, often due to premium features or locations.
- Strong performing properties (Top 25%) achieve nightly rates of $235 or more.
- Typical properties (Median) charge around $154 per night.
- Entry-level properties (Bottom 25%) earn around $124 per night.
Average Daily Rate (ADR) Trend by Month in Wrington
Get Live Wrington Market Intelligence 👇
Explore Real-time Analytics
Airbnb Seasonality Analysis & Trends in Wrington (2026)
Peak Season (March, August, July)
- Revenue averages $3,252 per month
- Occupancy rates average 37.1%
- Daily rates average $253
Shoulder Season
- Revenue averages $2,591 per month
- Occupancy maintains around 28.4%
- Daily rates hold near $267
Low Season (January, June, December)
- Revenue drops to average $1,292 per month
- Occupancy decreases to average 21.0%
- Daily rates adjust to average $274
Seasonality Insights for Wrington
- The Airbnb seasonality in Wrington shows highly seasonal trends requiring careful strategy. While the sections above show seasonal averages, it's also insightful to look at the extremes:
- During the high season, the absolute peak month showcases Wrington's highest earning potential, with monthly revenues capable of climbing to $3,479, occupancy reaching a high of 43.1%, and ADRs peaking at $284.
- Conversely, the slowest single month of the year, typically falling within the low season, marks the market's lowest point. In this month, revenue might dip to $1,273, occupancy could drop to 14.4%, and ADRs may adjust down to $242.
- Understanding both the seasonal averages and these monthly peaks and troughs in revenue, occupancy, and ADR is crucial for maximizing your Airbnb profit potential in Wrington.
Seasonal Strategies for Maximizing Profit
- Peak Season: Maximize revenue through premium pricing and potentially longer minimum stays. Ensure high availability.
- Low Season: Offer competitive pricing, special promotions (e.g., extended stay discounts), and flexible cancellation policies. Target off-season travelers like remote workers or budget-conscious guests.
- Shoulder Seasons: Implement dynamic pricing that balances peak and low rates. Target weekend travelers or specific events. Offer slightly more flexible terms than peak season.
- Regularly analyze your own performance against these Wrington seasonality benchmarks and adjust your pricing and availability strategy accordingly.
Best Areas for Airbnb Investment in Wrington (2026)
Exploring the top neighborhoods for short-term rentals in Wrington? This section highlights key areas, outlining why they are attractive for hosts and guests, along with notable local attractions. Consider these locations based on your target guest profile and investment strategy.
| Neighborhood / Area | Why Host Here? (Target Guests & Appeal) | Key Attractions & Landmarks |
|---|---|---|
| Wrington Village | A charming village with picturesque scenery and a strong community, ideal for travelers looking for a peaceful retreat yet close to amenities. | Wrington Village Hall, St. Mary’s Church, Wrington's famous pubs, Local walking trails, Nearby vineyards |
| Chew Valley Lake | A popular destination for outdoor enthusiasts, Chew Valley Lake offers activities like sailing and fishing, making it appealing for families and nature lovers. | Chew Valley Lake, Sailing clubs, Nature walks, Picnic areas, Bird watching spots |
| Winford | A nearby village that provides a quaint atmosphere and is close to Bristol Airport, making it perfect for travelers seeking convenience and tranquility. | Winford Manor, Local countryside, Walking paths, Village pub, Bristol Airport proximity |
| Nailsea | A market town with good transport links to Bristol, Nailsea is ideal for visitors who want easy access to city attractions while staying in a serene town setting. | Nailsea Town Centre, The Tyntesfield Estate, Nature reserves, Local shops, Parks |
| Long Ashton | Known for its beautiful countryside, Long Ashton is a small suburb of Bristol, providing a balance of rural charm and city accessibility. | Ashton Court Estate, Local vineyards, Walking trails, Historical sites, Community parks |
| Bristol City Centre | While not in Wrington, it’s a short drive away and offers vibrant cultural experiences, excellent dining options, and nightlife, making it a practical location for Airbnb hosting. | Bristol Harbourside, Clifton Suspension Bridge, Cabot Circus, Bristol Museum and Art Gallery, Street art |
| Clapton-in-Gordano | A scenic village close to Clevedon and the coast, attractive for travelers looking for picturesque views and outdoor activities like hiking and cycling. | Gordano Valley, Clapton Hill, Local trails, Nearby beaches, Natural beauty spots |
| Portbury | Offering a rural atmosphere with easy access to transport links, Portbury appeals to visitors who want to explore the coastal areas of North Somerset. | Portbury Wharf Nature Reserve, Historical buildings, Rural landscapes, Access to the Severn Estuary, Community events |
Understanding Airbnb License Requirements & STR Laws in Wrington (2026)
While Wrington, England, United Kingdom currently shows low STR regulations, specific Airbnb license requirements might still exist or change. Always verify the latest short term rental regulations and Airbnb license requirements directly with local government authorities for Wrington to ensure full compliance before hosting.
(Source: AirROI data, 2026, finding no licensed listings among those analyzed)
Top Performing Airbnb Properties in Wrington (2026)
Benchmark your potential! Explore examples of top-performing Airbnb properties in Wringtonbased on Trailing Twelve Month (TTM) revenue. Analyze their characteristics, revenue, occupancy rate, and ADR to understand what drives success in this market.
Barley Wood- Stunning Views near Bristol Airport
Entire Place • 9 bedrooms
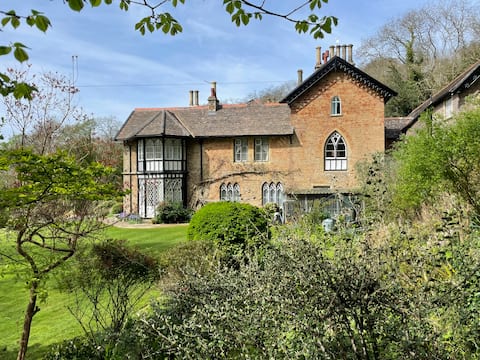
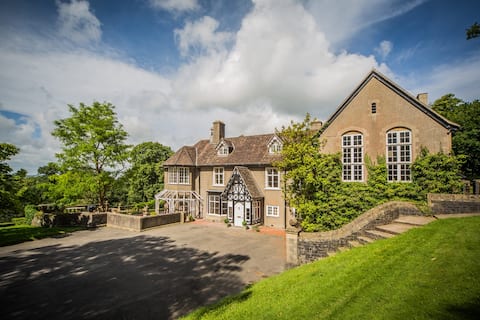
Victorian mansion with far reaching views
Entire Place • 6 bedrooms
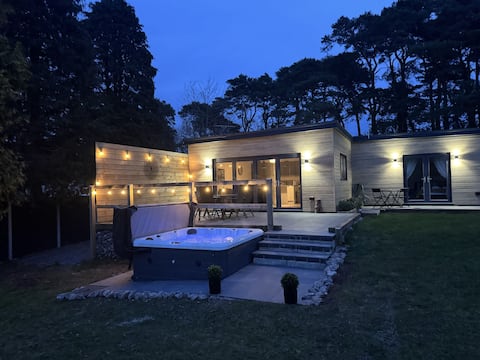
Tree Tops , 6 guest, 3 ensuites & with hot tub
Entire Place • 3 bedrooms
Small converted barn
Entire Place • 1 bedroom
New, stylish country apartment for 2 or 3
Entire Place • 1 bedroom

Lovely Bedroom Suite near Airport (self-contained)
Private Room • N/A
Note: Performance varies based on location, size, amenities, seasonality, and management quality. Data reflects the past 12 months.
Top Performing Airbnb Hosts in Wrington (2026)
Learn from the best! This table showcases top-performing Airbnb hosts in Wrington based on the number of properties managed and estimated total revenue over the past year. Analyze their scale and performance metrics.
| Host Name | Properties | Grossing Revenue | Stay Reviews | Avg Rating |
|---|---|---|---|---|
| Barley Wood | 1 | $93,373 | 23 | 4.78/5.0 |
| Jo | 1 | $71,237 | 13 | 4.92/5.0 |
| Charles MIllward | 1 | $69,924 | 15 | 5.00/5.0 |
| Russell | 5 | $34,775 | 64 | 4.55/5.0 |
| Chris | 1 | $25,526 | 123 | 4.93/5.0 |
| Penny | 1 | $18,718 | 21 | 5.00/5.0 |
| Jane | 1 | $15,890 | 427 | 4.82/5.0 |
| Henry | 1 | $15,063 | 9 | 4.67/5.0 |
| Yvonne | 1 | $13,482 | 468 | 4.98/5.0 |
| Robert James | 1 | $12,442 | 5 | 4.60/5.0 |
Analyzing the strategies of top hosts, such as their property selection, pricing, and guest communication, can offer valuable lessons for optimizing your own Airbnb operations in Wrington.
Dive Deeper: Advanced Wrington STR Market Data (2026)
Ready to unlock more insights? AirROI provides access to advanced metrics and comprehensive Airbnb data for Wrington. Explore detailed analytics beyond this report to refine your investment strategy, optimize pricing, and maximize your vacation rental profits.
Explore Advanced MetricsWrington Short-Term Rental Market Composition (2026): Property & Room Types
Room Type Distribution
Property Type Distribution
Market Composition Insights for Wrington
- The Wrington Airbnb market composition is heavily skewed towards Entire Home/Apt listings, which make up 50% of the 20 active rentals. This indicates strong guest preference for privacy and space.
- However, a notable 50% share for Private Rooms suggests opportunities for budget-conscious travelers or hosts renting out spare rooms.
- Looking at the property type distribution in Wrington, House properties are the most common (50%), reflecting the local real estate landscape.
- Houses represent a significant 50% portion, catering likely to families or larger groups.
- The presence of 40% Hotel/Boutique listings indicates integration with traditional hospitality.
Wrington Airbnb Room Capacity Analysis (2026): Bedroom Distribution
Distribution of Listings by Number of Bedrooms
Room Capacity Insights for Wrington
- The dominant room capacity in Wrington is 1 bedroom listings, making up 40% of the market. This suggests a strong demand for properties suitable for couples or solo travelers.
- Together, 1 bedroom and 5+ bedrooms properties represent 55.0% of the active Airbnb listings in Wrington, indicating a high concentration in these sizes.
- A significant 25.0% of listings offer 3+ bedrooms, catering to larger groups and families seeking more space in Wrington.
Wrington Vacation Rental Guest Capacity Trends (2026)
Distribution of Listings by Guest Capacity
Guest Capacity Insights for Wrington
- The most common guest capacity trend in Wrington vacation rentals is listings accommodating 2 guests (20%). This suggests the primary traveler segment is likely couples or solo travelers.
- Properties designed for 2 guests and 8+ guests dominate the Wrington STR market, accounting for 40.0% of listings.
- 30.0% of properties accommodate 6+ guests, serving the market segment for larger families or group travel in Wrington.
- On average, properties in Wrington are equipped to host 3.7 guests.
Wrington Airbnb Booking Patterns (2026): Available vs. Booked Days
Available Days Distribution
Booked Days Distribution
Booking Pattern Insights for Wrington
- The most common availability pattern in Wrington falls within the 271-366 days range, representing 65% of listings. This suggests many properties have significant open periods on their calendars.
- Approximately 90.0% of listings show high availability (181+ days open annually), indicating potential for increased bookings or specific owner usage patterns.
- For booked days, the 1-30 days range is most frequent in Wrington (35%), reflecting common guest stay durations or potential owner blocking patterns.
- A notable 10.0% of properties secure long booking periods (181+ days booked per year), highlighting successful long-term rental strategies or significant owner usage.
Wrington Airbnb Minimum Stay Requirements Analysis
Distribution of Listings by Minimum Night Requirement
1 Night
13 listings
65% of total
2 Nights
5 listings
25% of total
3 Nights
1 listings
5% of total
30+ Nights
1 listings
5% of total
Key Insights
- The most prevalent minimum stay requirement in Wrington is 1 Night, adopted by 65% of listings. This highlights the market's preference for shorter, flexible bookings.
- A strong majority (90.0%) of the Wrington Airbnb data shows acceptance of very short stays (1-2 nights), indicating a dynamic, high-turnover market.
Recommendations
- Align with the market by considering a 1 Night minimum stay, as 65% of Wrington hosts use this setting.
- Adjust minimum nights based on seasonality – potentially shorter during low season and longer during peak demand periods in Wrington.
Wrington Airbnb Cancellation Policy Trends Analysis (2026)
Super Strict 60 Days
1 listings
5% of total
Flexible
6 listings
30% of total
Moderate
8 listings
40% of total
Firm
3 listings
15% of total
Strict
2 listings
10% of total
Cancellation Policy Insights for Wrington
- The prevailing Airbnb cancellation policy trend in Wrington is Moderate, used by 40% of listings.
- There's a relatively balanced mix between guest-friendly (70.0%) and stricter (25.0%) policies, offering choices for different guest needs.
Recommendations for Hosts
- Consider adopting a Moderate policy to align with the 40% market standard in Wrington.
- Using a Strict policy might deter some guests, as only 10% of listings use it. Evaluate if potential revenue protection outweighs possible lower booking rates.
- Regularly review your cancellation policy against competitors and market demand shifts in Wrington.
Wrington STR Booking Lead Time Analysis (2026)
Average Booking Lead Time by Month
Booking Lead Time Insights for Wrington
- The overall average booking lead time for vacation rentals in Wrington is 67 days.
- Guests book furthest in advance for stays during November (average 115 days), likely coinciding with peak travel demand or local events.
- The shortest booking windows occur for stays in August (average 58 days), indicating more last-minute travel plans during this time.
- Seasonally, Fall (85 days avg.) sees the longest lead times, while Summer (60 days avg.) has the shortest, reflecting typical travel planning cycles.
Recommendations for Hosts
- Use the overall average lead time (67 days) as a baseline for your pricing and availability strategy in Wrington.
- For November stays, consider implementing length-of-stay discounts or slightly higher rates for bookings made less than 115 days out to capitalize on advance planning.
- Target marketing efforts for the Fall season well in advance (at least 85 days) to capture early planners.
- Monitor your own booking lead times against these Wrington averages to identify opportunities for dynamic pricing adjustments.
Popular & Essential Airbnb Amenities in Wrington (2026)
Amenity Prevalence
Amenity Insights for Wrington
- Essential amenities in Wrington that guests expect include: TV, Wifi. Lacking these (any) could significantly impact bookings.
- Popular amenities like Free parking on premises, Smoke alarm, Heating are common but not universal. Offering these can provide a competitive edge.
Recommendations for Hosts
- Ensure your listing includes all essential amenities for Wrington: TV, Wifi.
- Consider adding popular differentiators like Free parking on premises or Smoke alarm to increase appeal.
- Highlight unique or less common amenities you offer (e.g., hot tub, dedicated workspace, EV charger) in your listing description and photos.
- Regularly check competitor amenities in Wrington to stay competitive.
Wrington Airbnb Guest Demographics & Profile Analysis (2026)
Guest Profile Summary for Wrington
- The typical guest profile for Airbnb in Wrington consists of primarily domestic travelers (84%), often arriving from nearby England, typically belonging to the Post-2000s (Gen Z/Alpha) group (50%), primarily speaking English or French.
- Domestic travelers account for 83.9% of guests.
- Key international markets include United Kingdom (83.9%) and Ireland (2.2%).
- Top languages spoken are English (66.1%) followed by French (6.8%).
- A significant demographic segment is the Post-2000s (Gen Z/Alpha) group, representing 50% of guests.
Recommendations for Hosts
- Target domestic marketing efforts towards travelers from England and London.
- Tailor amenities and listing descriptions to appeal to the dominant Post-2000s (Gen Z/Alpha) demographic (e.g., highlight fast WiFi, smart home features, local guides).
- Highlight unique local experiences or amenities relevant to the primary guest profile.
- Consider seasonal promotions aligned with peak travel times for key origin markets.
Nearby Short-Term Rental Market Comparison
How does the Wrington Airbnb market stack up against its neighbors? Compare key performance metrics like average monthly revenue, ADR, and occupancy rates in surrounding areas to understand the broader regional STR landscape.
| Market | Active Properties | Monthly Revenue | Daily Rate | Avg. Occupancy |
|---|---|---|---|---|
| Chew Magna | 13 | $7,041 | $430.65 | 44% |
| Englishcombe | 15 | $6,734 | $511.35 | 53% |
| Lambourn | 11 | $6,499 | $723.41 | 31% |
| East Knoyle | 10 | $6,300 | $407.06 | 44% |
| Long Sutton | 18 | $6,029 | $383.58 | 46% |
| Withington | 10 | $5,690 | $499.79 | 44% |
| Ashley | 13 | $5,497 | $364.68 | 54% |
| Bont-dolgadfan | 10 | $5,458 | $293.24 | 58% |
| Freshford | 12 | $5,333 | $317.81 | 58% |
| Grosmont | 11 | $5,211 | $459.67 | 55% |