Comber Airbnb Market Analysis 2026: Short Term Rental Data & Vacation Rental Statistics in Northern Ireland, United Kingdom
Is Airbnb profitable in Comber in 2026? Explore comprehensive Airbnb analytics for Comber, Northern Ireland, United Kingdom to uncover income potential. This 2026 STR market report for Comber, based on AirROI data from February 2025 to January 2026, reveals key trends in the niche market of 22 active listings.
Whether you're considering an Airbnb investment in Comber, optimizing your existing vacation rental, or exploring rental arbitrage opportunities, understanding the Comber Airbnb data is crucial. Leveraging the low regulation environment is key to maximizing your short term rental income potential. Let's dive into the specifics.
Key Comber Airbnb Performance Metrics Overview
Monthly Airbnb Revenue Variations & Income Potential in Comber (2026)
Understanding the monthly revenue variations for Airbnb listings in Comber is key to maximizing your short term rental income potential. Seasonality significantly impacts earnings. Our analysis, based on data from the past 12 months, shows that the peak revenue month for STRs in Comber is typically August, while January often presents the lowest earnings, highlighting opportunities for strategic pricing adjustments during shoulder and low seasons. Explore the typical Airbnb income in Comber across different performance tiers:
- Best-in-class properties (Top 10%) achieve $3,437+ monthly, often utilizing dynamic pricing and superior guest experiences.
- Strong performing properties (Top 25%) earn $2,427 or more, indicating effective management and desirable locations/amenities.
- Typical properties (Median) generate around $1,063 per month, representing the average market performance.
- Entry-level properties (Bottom 25%) see earnings around $458, often with potential for optimization.
Average Monthly Airbnb Earnings Trend in Comber
Comber Airbnb Occupancy Rate Trends (2026)
Maximize your bookings by understanding the Comber STR occupancy trends. Seasonal demand shifts significantly influence how often properties are booked. Typically, Augustsees the highest demand (peak season occupancy), while September experiences the lowest (low season). Effective strategies, like adjusting minimum stays or offering promotions, can boost occupancy during slower periods. Here's how different property tiers perform in Comber:
- Best-in-class properties (Top 10%) achieve 58%+ occupancy, indicating high desirability and potentially optimized availability.
- Strong performing properties (Top 25%) maintain 42% or higher occupancy, suggesting good market fit and guest satisfaction.
- Typical properties (Median) have an occupancy rate around 25%.
- Entry-level properties (Bottom 25%) average 11% occupancy, potentially facing higher vacancy.
Average Monthly Occupancy Rate Trend in Comber
Average Daily Rate (ADR) Airbnb Trends in Comber (2026)
Effective short term rental pricing strategy in Comber involves understanding monthly ADR fluctuations. The Average Daily Rate (ADR) for Airbnb in Comber typically peaks in December and dips lowest during February. Leveraging Airbnb dynamic pricing tools or strategies based on this seasonality can significantly boost revenue. Here's a look at the typical nightly rates achieved:
- Best-in-class properties (Top 10%) command rates of $264+ per night, often due to premium features or locations.
- Strong performing properties (Top 25%) achieve nightly rates of $211 or more.
- Typical properties (Median) charge around $139 per night.
- Entry-level properties (Bottom 25%) earn around $120 per night.
Average Daily Rate (ADR) Trend by Month in Comber
Get Live Comber Market Intelligence 👇

Explore Real-time Analytics
Airbnb Seasonality Analysis & Trends in Comber (2026)
Peak Season (August, July, May)
- Revenue averages $1,999 per month
- Occupancy rates average 34.5%
- Daily rates average $168
Shoulder Season
- Revenue averages $1,506 per month
- Occupancy maintains around 29.2%
- Daily rates hold near $157
Low Season (January, June, September)
- Revenue drops to average $1,080 per month
- Occupancy decreases to average 23.6%
- Daily rates adjust to average $166
Seasonality Insights for Comber
- The Airbnb seasonality in Comber shows highly seasonal trends requiring careful strategy. While the sections above show seasonal averages, it's also insightful to look at the extremes:
- During the high season, the absolute peak month showcases Comber's highest earning potential, with monthly revenues capable of climbing to $2,223, occupancy reaching a high of 37.7%, and ADRs peaking at $175.
- Conversely, the slowest single month of the year, typically falling within the low season, marks the market's lowest point. In this month, revenue might dip to $896, occupancy could drop to 22.2%, and ADRs may adjust down to $140.
- Understanding both the seasonal averages and these monthly peaks and troughs in revenue, occupancy, and ADR is crucial for maximizing your Airbnb profit potential in Comber.
Seasonal Strategies for Maximizing Profit
- Peak Season: Maximize revenue through premium pricing and potentially longer minimum stays. Ensure high availability.
- Low Season: Offer competitive pricing, special promotions (e.g., extended stay discounts), and flexible cancellation policies. Target off-season travelers like remote workers or budget-conscious guests.
- Shoulder Seasons: Implement dynamic pricing that balances peak and low rates. Target weekend travelers or specific events. Offer slightly more flexible terms than peak season.
- Regularly analyze your own performance against these Comber seasonality benchmarks and adjust your pricing and availability strategy accordingly.
Best Areas for Airbnb Investment in Comber (2026)
Exploring the top neighborhoods for short-term rentals in Comber? This section highlights key areas, outlining why they are attractive for hosts and guests, along with notable local attractions. Consider these locations based on your target guest profile and investment strategy.
| Neighborhood / Area | Why Host Here? (Target Guests & Appeal) | Key Attractions & Landmarks |
|---|---|---|
| Comber Town Center | The heart of Comber, known for its charming shops, cafes, and local amenities. Attracts visitors looking for a quaint village experience with easy access to Belfast and surroundings. | Comber Market, Local shops and cafes, Comber Greenway, Mount Stewart House and Gardens, Scrabo Tower |
| Strangford Lough | Beautifully scenic area known for its natural beauty and wildlife. Ideal for those seeking outdoor activities like walking, cycling and boating. | Strangford Lough, Exploris Aquarium, Castle Ward, Mount Stewart, Seaforde Gardens |
| Ballydrain | A quieter countryside area attracting those who want a rural escape. Close to nature and with a friendly community feel. | Countryside walks, Local farms, Historic ruins, Nature trails, Ballydrain Church |
| Newtownards | A nearby town that offers more amenities and attractions. Good for visitors wanting to explore both Comber and Newtownards. | Ards Shopping Centre, Newtownards Market, Castlescreen Road, Movilla Abbey, Local pubs and restaurants |
| Scrabo | Famous for Scrabo Tower and its panoramic views. Popular with hikers and photographers. | Scrabo Tower, Scrabo Country Park, Hill walking trails, Golf courses, Panoramic views of Strangford Lough |
| Saintfield Road | A main route connecting Comber with larger cities. Offers various lodging options for travelers passing through. | Roadside attractions, Quick access to Belfast, Local restaurants, Convenience stores, Scenic views |
| Killyleagh | A historic village on the shores of Strangford Lough known for its picturesque views and fairy-tale castle. Great for romantic getaways. | Killyleagh Castle, Strangford Lough Shore, Local pubs, Village shops, Walking paths along the water |
| Ballygowan | A small picturesque village that offers a peaceful stay away from the city hustle. Good for weekend retreats. | Countryside walks, Ballygowan Golf Club, Local eateries, Nature reserves, Community events |
Understanding Airbnb License Requirements & STR Laws in Comber (2026)
While Comber, Northern Ireland, United Kingdom currently shows low STR regulations, specific Airbnb license requirements might still exist or change. Always verify the latest short term rental regulations and Airbnb license requirements directly with local government authorities for Comber to ensure full compliance before hosting.
(Source: AirROI data, 2026, finding no licensed listings among those analyzed)
Top Performing Airbnb Properties in Comber (2026)
Benchmark your potential! Explore examples of top-performing Airbnb properties in Comberbased on Trailing Twelve Month (TTM) revenue. Analyze their characteristics, revenue, occupancy rate, and ADR to understand what drives success in this market.

Serene & Cozy Getaway ~ Steps to Beach ~ Hot Tub!
Entire Place • 1 bedroom
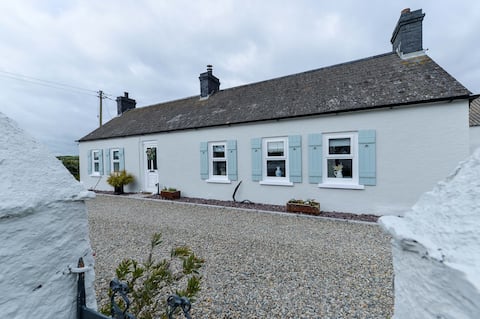
Drumhill Cottage, Comber, Co. Down
Entire Place • 2 bedrooms
Luxe & Unique Haven ~ 5* Beach Location ~ Hot Tub!
Entire Place • 1 bedroom
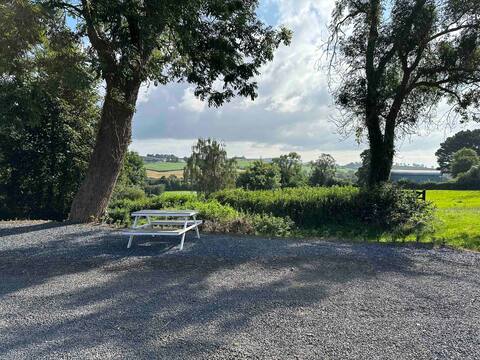
Picturesque Lakeside Oasis: Hot Tub ~ Scenic Views
Entire Place • 1 bedroom
The Wee House at Ballystockart Cottages
Entire Place • 2 bedrooms

Charming & Comfy Gem: Beach ~ Lake Views ~ Hot Tub
Entire Place • 1 bedroom
Note: Performance varies based on location, size, amenities, seasonality, and management quality. Data reflects the past 12 months.
Top Performing Airbnb Hosts in Comber (2026)
Learn from the best! This table showcases top-performing Airbnb hosts in Comber based on the number of properties managed and estimated total revenue over the past year. Analyze their scale and performance metrics.
| Host Name | Properties | Grossing Revenue | Stay Reviews | Avg Rating |
|---|---|---|---|---|
| Kimberly | 5 | $126,769 | 186 | 4.50/5.0 |
| Lindsay | 2 | $31,572 | 91 | 4.97/5.0 |
| Paula | 1 | $31,278 | 82 | 5.00/5.0 |
| Martin | 2 | $20,217 | 167 | 4.64/5.0 |
| Thembi | 1 | $18,479 | 6 | 5.00/5.0 |
| Winnie | 1 | $16,950 | 18 | 5.00/5.0 |
| Claire | 4 | $15,353 | 162 | 4.93/5.0 |
| Jenny | 1 | $14,207 | 168 | 4.99/5.0 |
| Robert | 1 | $13,070 | 25 | 4.96/5.0 |
| David | 1 | $10,689 | 36 | 4.89/5.0 |
Analyzing the strategies of top hosts, such as their property selection, pricing, and guest communication, can offer valuable lessons for optimizing your own Airbnb operations in Comber.
Dive Deeper: Advanced Comber STR Market Data (2026)
Ready to unlock more insights? AirROI provides access to advanced metrics and comprehensive Airbnb data for Comber. Explore detailed analytics beyond this report to refine your investment strategy, optimize pricing, and maximize your vacation rental profits.
Explore Advanced MetricsComber Short-Term Rental Market Composition (2026): Property & Room Types
Room Type Distribution
Property Type Distribution
Market Composition Insights for Comber
- The Comber Airbnb market composition is heavily skewed towards Entire Home/Apt listings, which make up 81.8% of the 22 active rentals. This indicates strong guest preference for privacy and space.
- Looking at the property type distribution in Comber, House properties are the most common (40.9%), reflecting the local real estate landscape.
- Houses represent a significant 40.9% portion, catering likely to families or larger groups.
- Smaller segments like others (combined 4.5%) offer potential for unique stay experiences.
Comber Airbnb Room Capacity Analysis (2026): Bedroom Distribution
Distribution of Listings by Number of Bedrooms
Room Capacity Insights for Comber
- The dominant room capacity in Comber is 1 bedroom listings, making up 40.9% of the market. This suggests a strong demand for properties suitable for couples or solo travelers.
- Together, 1 bedroom and 2 bedrooms properties represent 77.3% of the active Airbnb listings in Comber, indicating a high concentration in these sizes.
- Listings with 3+ bedrooms (4.5%) represent a smaller niche, potentially indicating an underserved market for larger group accommodations in Comber.
Comber Vacation Rental Guest Capacity Trends (2026)
Distribution of Listings by Guest Capacity
Guest Capacity Insights for Comber
- The most common guest capacity trend in Comber vacation rentals is listings accommodating 2 guests (40.9%). This suggests the primary traveler segment is likely couples or solo travelers.
- Properties designed for 2 guests and 4 guests dominate the Comber STR market, accounting for 63.6% of listings.
- A significant 40.9% of listings cater specifically to 1-2 guests, highlighting strong demand from couples and solo travelers in Comber.
- On average, properties in Comber are equipped to host 2.8 guests.
Comber Airbnb Booking Patterns (2026): Available vs. Booked Days
Available Days Distribution
Booked Days Distribution
Booking Pattern Insights for Comber
- The most common availability pattern in Comber falls within the 271-366 days range, representing 68.2% of listings. This suggests many properties have significant open periods on their calendars.
- Approximately 95.5% of listings show high availability (181+ days open annually), indicating potential for increased bookings or specific owner usage patterns.
- For booked days, the 31-90 days range is most frequent in Comber (59.1%), reflecting common guest stay durations or potential owner blocking patterns.
- A notable 4.5% of properties secure long booking periods (181+ days booked per year), highlighting successful long-term rental strategies or significant owner usage.
Comber Airbnb Minimum Stay Requirements Analysis
Distribution of Listings by Minimum Night Requirement
1 Night
11 listings
50% of total
2 Nights
5 listings
22.7% of total
3 Nights
2 listings
9.1% of total
30+ Nights
4 listings
18.2% of total
Key Insights
- The most prevalent minimum stay requirement in Comber is 1 Night, adopted by 50% of listings. This highlights the market's preference for shorter, flexible bookings.
- A strong majority (72.7%) of the Comber Airbnb data shows acceptance of very short stays (1-2 nights), indicating a dynamic, high-turnover market.
- A significant segment (18.2%) caters to monthly stays (30+ nights) in Comber, pointing to opportunities in the extended-stay market.
Recommendations
- Align with the market by considering a 1 Night minimum stay, as 50% of Comber hosts use this setting.
- Explore offering discounts for stays of 30+ nights to attract the 18.2% of the market seeking extended stays.
- Adjust minimum nights based on seasonality – potentially shorter during low season and longer during peak demand periods in Comber.
Comber Airbnb Cancellation Policy Trends Analysis (2026)
Flexible
6 listings
27.3% of total
Moderate
3 listings
13.6% of total
Firm
8 listings
36.4% of total
Strict
5 listings
22.7% of total
Cancellation Policy Insights for Comber
- The prevailing Airbnb cancellation policy trend in Comber is Firm, used by 36.4% of listings.
- A majority (59.1%) of hosts in Comber utilize Firm or Strict policies, indicating a market where hosts prioritize booking security.
Recommendations for Hosts
- Consider adopting a Firm policy to align with the 36.4% market standard in Comber.
- Regularly review your cancellation policy against competitors and market demand shifts in Comber.
Comber STR Booking Lead Time Analysis (2026)
Average Booking Lead Time by Month
Booking Lead Time Insights for Comber
- The overall average booking lead time for vacation rentals in Comber is 47 days.
- Guests book furthest in advance for stays during December (average 139 days), likely coinciding with peak travel demand or local events.
- The shortest booking windows occur for stays in March (average 17 days), indicating more last-minute travel plans during this time.
- Seasonally, Winter (63 days avg.) sees the longest lead times, while Spring (29 days avg.) has the shortest, reflecting typical travel planning cycles.
Recommendations for Hosts
- Use the overall average lead time (47 days) as a baseline for your pricing and availability strategy in Comber.
- For December stays, consider implementing length-of-stay discounts or slightly higher rates for bookings made less than 139 days out to capitalize on advance planning.
- Target marketing efforts for the Winter season well in advance (at least 63 days) to capture early planners.
- Monitor your own booking lead times against these Comber averages to identify opportunities for dynamic pricing adjustments.
Popular & Essential Airbnb Amenities in Comber (2026)
Amenity Prevalence
Amenity Insights for Comber
- Essential amenities in Comber that guests expect include: Dishes and silverware, TV, Heating, Wifi, Free parking on premises, Smoke alarm. Lacking these (any) could significantly impact bookings.
- Popular amenities like Essentials, Hair dryer, Hot water are common but not universal. Offering these can provide a competitive edge.
Recommendations for Hosts
- Ensure your listing includes all essential amenities for Comber: Dishes and silverware, TV, Heating, Wifi, Free parking on premises, Smoke alarm.
- Prioritize adding missing essentials: Heating, Wifi, Free parking on premises, Smoke alarm.
- Consider adding popular differentiators like Essentials or Hair dryer to increase appeal.
- Highlight unique or less common amenities you offer (e.g., hot tub, dedicated workspace, EV charger) in your listing description and photos.
- Regularly check competitor amenities in Comber to stay competitive.
Comber Airbnb Guest Demographics & Profile Analysis (2026)
Guest Profile Summary for Comber
- The typical guest profile for Airbnb in Comber consists of primarily domestic travelers (75%), often arriving from nearby Belfast, typically belonging to the Post-2000s (Gen Z/Alpha) group (50%), primarily speaking English or French.
- Domestic travelers account for 75.0% of guests.
- Key international markets include United Kingdom (75%) and Ireland (15%).
- Top languages spoken are English (66.7%) followed by French (11.1%).
- A significant demographic segment is the Post-2000s (Gen Z/Alpha) group, representing 50% of guests.
Recommendations for Hosts
- Target domestic marketing efforts towards travelers from Belfast and Northern Ireland.
- Tailor amenities and listing descriptions to appeal to the dominant Post-2000s (Gen Z/Alpha) demographic (e.g., highlight fast WiFi, smart home features, local guides).
- Highlight unique local experiences or amenities relevant to the primary guest profile.
- Consider seasonal promotions aligned with peak travel times for key origin markets.
Nearby Short-Term Rental Market Comparison
How does the Comber Airbnb market stack up against its neighbors? Compare key performance metrics like average monthly revenue, ADR, and occupancy rates in surrounding areas to understand the broader regional STR landscape.
| Market | Active Properties | Monthly Revenue | Daily Rate | Avg. Occupancy |
|---|---|---|---|---|
| Langbank | 11 | $4,447 | $385.29 | 53% |
| Bruichladdich | 17 | $4,237 | $319.79 | 55% |
| Valley | 18 | $4,101 | $295.91 | 45% |
| Kilchattan Bay | 10 | $4,080 | $328.91 | 54% |
| Cardross | 11 | $4,049 | $378.91 | 44% |
| Bontnewydd | 27 | $3,960 | $383.00 | 46% |
| Bull Bay | 14 | $3,925 | $392.30 | 46% |
| Dublin 2 | 15 | $3,771 | $317.51 | 54% |
| Port Ellen | 30 | $3,689 | $201.39 | 66% |
| Nant Peris | 14 | $3,668 | $260.50 | 49% |