Rostrevor Airbnb Market Analysis 2026: Short Term Rental Data & Vacation Rental Statistics in Northern Ireland, United Kingdom
Is Airbnb profitable in Rostrevor in 2026? Explore comprehensive Airbnb analytics for Rostrevor, Northern Ireland, United Kingdom to uncover income potential. This 2026 STR market report for Rostrevor, based on AirROI data from February 2025 to January 2026, reveals key trends in the niche market of 40 active listings.
Whether you're considering an Airbnb investment in Rostrevor, optimizing your existing vacation rental, or exploring rental arbitrage opportunities, understanding the Rostrevor Airbnb data is crucial. Leveraging the low regulation environment is key to maximizing your short term rental income potential. Let's dive into the specifics.
Key Rostrevor Airbnb Performance Metrics Overview
Monthly Airbnb Revenue Variations & Income Potential in Rostrevor (2026)
Understanding the monthly revenue variations for Airbnb listings in Rostrevor is key to maximizing your short term rental income potential. Seasonality significantly impacts earnings. Our analysis, based on data from the past 12 months, shows that the peak revenue month for STRs in Rostrevor is typically July, while February often presents the lowest earnings, highlighting opportunities for strategic pricing adjustments during shoulder and low seasons. Explore the typical Airbnb income in Rostrevor across different performance tiers:
- Best-in-class properties (Top 10%) achieve $5,017+ monthly, often utilizing dynamic pricing and superior guest experiences.
- Strong performing properties (Top 25%) earn $2,927 or more, indicating effective management and desirable locations/amenities.
- Typical properties (Median) generate around $1,638 per month, representing the average market performance.
- Entry-level properties (Bottom 25%) see earnings around $909, often with potential for optimization.
Average Monthly Airbnb Earnings Trend in Rostrevor
Rostrevor Airbnb Occupancy Rate Trends (2026)
Maximize your bookings by understanding the Rostrevor STR occupancy trends. Seasonal demand shifts significantly influence how often properties are booked. Typically, Julysees the highest demand (peak season occupancy), while January experiences the lowest (low season). Effective strategies, like adjusting minimum stays or offering promotions, can boost occupancy during slower periods. Here's how different property tiers perform in Rostrevor:
- Best-in-class properties (Top 10%) achieve 63%+ occupancy, indicating high desirability and potentially optimized availability.
- Strong performing properties (Top 25%) maintain 46% or higher occupancy, suggesting good market fit and guest satisfaction.
- Typical properties (Median) have an occupancy rate around 28%.
- Entry-level properties (Bottom 25%) average 17% occupancy, potentially facing higher vacancy.
Average Monthly Occupancy Rate Trend in Rostrevor
Average Daily Rate (ADR) Airbnb Trends in Rostrevor (2026)
Effective short term rental pricing strategy in Rostrevor involves understanding monthly ADR fluctuations. The Average Daily Rate (ADR) for Airbnb in Rostrevor typically peaks in July and dips lowest during February. Leveraging Airbnb dynamic pricing tools or strategies based on this seasonality can significantly boost revenue. Here's a look at the typical nightly rates achieved:
- Best-in-class properties (Top 10%) command rates of $392+ per night, often due to premium features or locations.
- Strong performing properties (Top 25%) achieve nightly rates of $277 or more.
- Typical properties (Median) charge around $193 per night.
- Entry-level properties (Bottom 25%) earn around $140 per night.
Average Daily Rate (ADR) Trend by Month in Rostrevor
Get Live Rostrevor Market Intelligence 👇

Explore Real-time Analytics
Airbnb Seasonality Analysis & Trends in Rostrevor (2026)
Peak Season (July, August, June)
- Revenue averages $3,259 per month
- Occupancy rates average 46.1%
- Daily rates average $233
Shoulder Season
- Revenue averages $2,109 per month
- Occupancy maintains around 30.8%
- Daily rates hold near $227
Low Season (January, February, March)
- Revenue drops to average $1,448 per month
- Occupancy decreases to average 21.5%
- Daily rates adjust to average $218
Seasonality Insights for Rostrevor
- The Airbnb seasonality in Rostrevor shows highly seasonal trends requiring careful strategy. While the sections above show seasonal averages, it's also insightful to look at the extremes:
- During the high season, the absolute peak month showcases Rostrevor's highest earning potential, with monthly revenues capable of climbing to $3,734, occupancy reaching a high of 51.8%, and ADRs peaking at $237.
- Conversely, the slowest single month of the year, typically falling within the low season, marks the market's lowest point. In this month, revenue might dip to $1,371, occupancy could drop to 17.4%, and ADRs may adjust down to $213.
- Understanding both the seasonal averages and these monthly peaks and troughs in revenue, occupancy, and ADR is crucial for maximizing your Airbnb profit potential in Rostrevor.
Seasonal Strategies for Maximizing Profit
- Peak Season: Maximize revenue through premium pricing and potentially longer minimum stays. Ensure high availability.
- Low Season: Offer competitive pricing, special promotions (e.g., extended stay discounts), and flexible cancellation policies. Target off-season travelers like remote workers or budget-conscious guests.
- Shoulder Seasons: Implement dynamic pricing that balances peak and low rates. Target weekend travelers or specific events. Offer slightly more flexible terms than peak season.
- Regularly analyze your own performance against these Rostrevor seasonality benchmarks and adjust your pricing and availability strategy accordingly.
Best Areas for Airbnb Investment in Rostrevor (2026)
Exploring the top neighborhoods for short-term rentals in Rostrevor? This section highlights key areas, outlining why they are attractive for hosts and guests, along with notable local attractions. Consider these locations based on your target guest profile and investment strategy.
| Neighborhood / Area | Why Host Here? (Target Guests & Appeal) | Key Attractions & Landmarks |
|---|---|---|
| Cloughmore Falls | A stunning natural waterfall offering breathtaking landscapes and hiking opportunities, perfect for nature lovers wanting a peaceful retreat. | Cloughmore Falls, The Mourne Mountains, Silent Valley Reservoir, Local hiking trails |
| Rostrevor Village | A picturesque village with charming local shops, pubs, and restaurants, ideal for tourists looking for an authentic Northern Irish experience. | Local pubs, Rostrevor village square, Historical sites, Walking trails in the area |
| Kilbroney Park | Spanning around 100 acres, this park offers recreational facilities and is great for family outings, attracting visitors who enjoy outdoor activities. | Park trails, Scenic views, Picnic areas, Children’s playground, Kilbroney Church |
| Greenway Trail | A scenic bicycle and walking trail that appeals to outdoor enthusiasts, promoting eco-tourism and healthy lifestyles. | Cycling routes, Walking paths, Nature viewing, Picnic spots |
| Carlingford Lough | A picturesque lough offering various water activities and stunning views, popular among adventure travelers and nature photographers. | Water sports, Fishing, Scenic boat tours, Photography spots |
| Mourne Coastal Route | A tourist-friendly coastal drive that attracts travelers looking for scenic views, unique local culture, and various attractions along the way. | Coastal views, Castle Ward, Beaches, Local seafood restaurants |
| The Mourne Mountains | A popular destination for hiking and stunning vistas, ideal for adventure seekers and nature lovers looking to explore the outdoors. | Slieve Donard, Hiking routes, Mountain biking, Stunning landscapes |
| Greencastle | A charming coastal village that invites guests to explore its historic sites and enjoy beach-related activities, perfect for families and history enthusiasts. | Greencastle Castle, Beaches, Local seafood eateries, Coastal walks |
Understanding Airbnb License Requirements & STR Laws in Rostrevor (2026)
While Rostrevor, Northern Ireland, United Kingdom currently shows low STR regulations, specific Airbnb license requirements might still exist or change. Always verify the latest short term rental regulations and Airbnb license requirements directly with local government authorities for Rostrevor to ensure full compliance before hosting.
(Source: AirROI data, 2026, finding no licensed listings among those analyzed)
Top Performing Airbnb Properties in Rostrevor (2026)
Benchmark your potential! Explore examples of top-performing Airbnb properties in Rostrevorbased on Trailing Twelve Month (TTM) revenue. Analyze their characteristics, revenue, occupancy rate, and ADR to understand what drives success in this market.
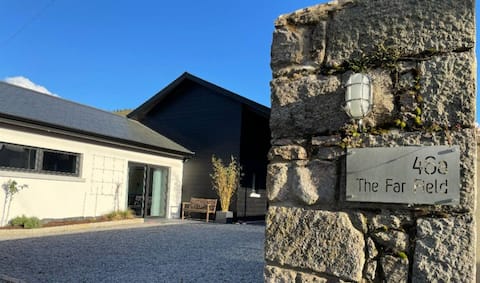
a luxury new build eco house in a walled garden
Entire Place • 3 bedrooms
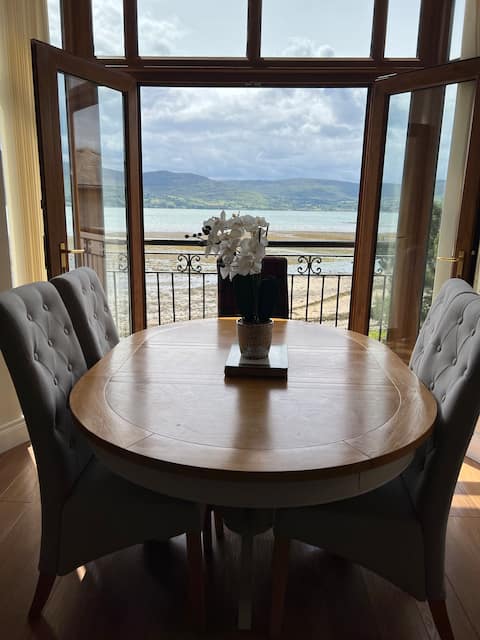
Waterfront Apartment overlooking Carlingford Lough
Entire Place • 3 bedrooms
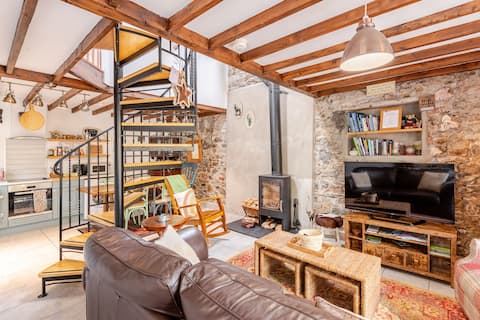
Hillside Lodge
Entire Place • 2 bedrooms

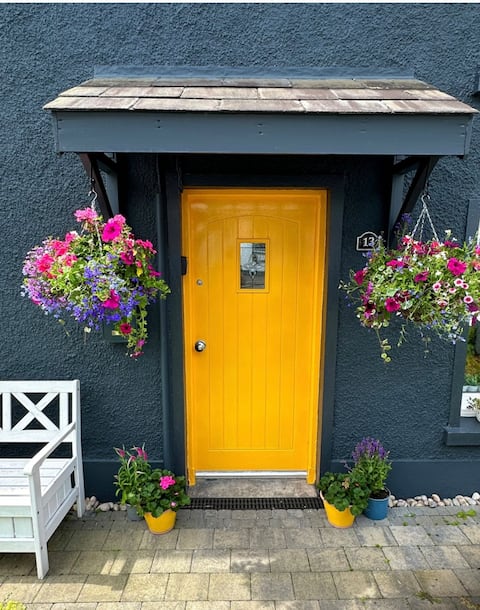
Yellow Water Cottage, Rostrevor - Sleeps 10
Entire Place • 4 bedrooms

Hillside Holiday Home
Entire Place • 4 bedrooms
Yellow Water Cottage Rostrevor NITB Approved
Entire Place • 4 bedrooms
Note: Performance varies based on location, size, amenities, seasonality, and management quality. Data reflects the past 12 months.
Top Performing Airbnb Hosts in Rostrevor (2026)
Learn from the best! This table showcases top-performing Airbnb hosts in Rostrevor based on the number of properties managed and estimated total revenue over the past year. Analyze their scale and performance metrics.
| Host Name | Properties | Grossing Revenue | Stay Reviews | Avg Rating |
|---|---|---|---|---|
| Toni | 2 | $83,613 | 230 | 4.98/5.0 |
| Henry And Liz | 1 | $81,375 | 44 | 5.00/5.0 |
| Tracey | 1 | $48,632 | 16 | 4.94/5.0 |
| Stay Belfast | 1 | $41,892 | 3 | 5.00/5.0 |
| Paul | 1 | $41,131 | 206 | 4.93/5.0 |
| Sharon | 1 | $39,585 | 29 | 5.00/5.0 |
| Eamonn | 3 | $35,852 | 188 | 4.85/5.0 |
| Sean & Niall | 1 | $35,813 | 28 | 5.00/5.0 |
| Peter | 1 | $35,647 | 37 | 4.95/5.0 |
| Colette | 1 | $34,014 | 43 | 5.00/5.0 |
Analyzing the strategies of top hosts, such as their property selection, pricing, and guest communication, can offer valuable lessons for optimizing your own Airbnb operations in Rostrevor.
Dive Deeper: Advanced Rostrevor STR Market Data (2026)
Ready to unlock more insights? AirROI provides access to advanced metrics and comprehensive Airbnb data for Rostrevor. Explore detailed analytics beyond this report to refine your investment strategy, optimize pricing, and maximize your vacation rental profits.
Explore Advanced MetricsRostrevor Short-Term Rental Market Composition (2026): Property & Room Types
Room Type Distribution
Property Type Distribution
Market Composition Insights for Rostrevor
- The Rostrevor Airbnb market composition is heavily skewed towards Entire Home/Apt listings, which make up 80% of the 40 active rentals. This indicates strong guest preference for privacy and space.
- Looking at the property type distribution in Rostrevor, House properties are the most common (57.5%), reflecting the local real estate landscape.
- Houses represent a significant 57.5% portion, catering likely to families or larger groups.
- The presence of 15% Hotel/Boutique listings indicates integration with traditional hospitality.
- Smaller segments like unique stays (combined 2.5%) offer potential for unique stay experiences.
Rostrevor Airbnb Room Capacity Analysis (2026): Bedroom Distribution
Distribution of Listings by Number of Bedrooms
Room Capacity Insights for Rostrevor
- The dominant room capacity in Rostrevor is 2 bedrooms listings, making up 35% of the market. This suggests a strong demand for properties suitable for couples or solo travelers.
- Together, 2 bedrooms and 1 bedroom properties represent 52.5% of the active Airbnb listings in Rostrevor, indicating a high concentration in these sizes.
- A significant 30.0% of listings offer 3+ bedrooms, catering to larger groups and families seeking more space in Rostrevor.
Rostrevor Vacation Rental Guest Capacity Trends (2026)
Distribution of Listings by Guest Capacity
Guest Capacity Insights for Rostrevor
- The most common guest capacity trend in Rostrevor vacation rentals is listings accommodating 4 guests (30%). This suggests the primary traveler segment is likely small families or groups.
- Properties designed for 4 guests and 6 guests dominate the Rostrevor STR market, accounting for 47.5% of listings.
- 32.5% of properties accommodate 6+ guests, serving the market segment for larger families or group travel in Rostrevor.
- On average, properties in Rostrevor are equipped to host 4.1 guests.
Rostrevor Airbnb Booking Patterns (2026): Available vs. Booked Days
Available Days Distribution
Booked Days Distribution
Booking Pattern Insights for Rostrevor
- The most common availability pattern in Rostrevor falls within the 271-366 days range, representing 57.5% of listings. This suggests many properties have significant open periods on their calendars.
- Approximately 87.5% of listings show high availability (181+ days open annually), indicating potential for increased bookings or specific owner usage patterns.
- For booked days, the 31-90 days range is most frequent in Rostrevor (47.5%), reflecting common guest stay durations or potential owner blocking patterns.
- A notable 12.5% of properties secure long booking periods (181+ days booked per year), highlighting successful long-term rental strategies or significant owner usage.
Rostrevor Airbnb Minimum Stay Requirements Analysis
Distribution of Listings by Minimum Night Requirement
1 Night
16 listings
40% of total
2 Nights
11 listings
27.5% of total
3 Nights
1 listings
2.5% of total
4-6 Nights
2 listings
5% of total
30+ Nights
10 listings
25% of total
Key Insights
- The most prevalent minimum stay requirement in Rostrevor is 1 Night, adopted by 40% of listings. This highlights the market's preference for shorter, flexible bookings.
- A strong majority (67.5%) of the Rostrevor Airbnb data shows acceptance of very short stays (1-2 nights), indicating a dynamic, high-turnover market.
- A significant segment (25%) caters to monthly stays (30+ nights) in Rostrevor, pointing to opportunities in the extended-stay market.
Recommendations
- Align with the market by considering a 1 Night minimum stay, as 40% of Rostrevor hosts use this setting.
- Explore offering discounts for stays of 30+ nights to attract the 25% of the market seeking extended stays.
- Adjust minimum nights based on seasonality – potentially shorter during low season and longer during peak demand periods in Rostrevor.
Rostrevor Airbnb Cancellation Policy Trends Analysis (2026)
Super Strict 30 Days
1 listings
2.5% of total
Flexible
13 listings
32.5% of total
Moderate
13 listings
32.5% of total
Firm
9 listings
22.5% of total
Strict
4 listings
10% of total
Cancellation Policy Insights for Rostrevor
- The prevailing Airbnb cancellation policy trend in Rostrevor is Flexible, used by 32.5% of listings.
- There's a relatively balanced mix between guest-friendly (65.0%) and stricter (32.5%) policies, offering choices for different guest needs.
Recommendations for Hosts
- Consider adopting a Flexible policy to align with the 32.5% market standard in Rostrevor.
- Using a Strict policy might deter some guests, as only 10% of listings use it. Evaluate if potential revenue protection outweighs possible lower booking rates.
- Regularly review your cancellation policy against competitors and market demand shifts in Rostrevor.
Rostrevor STR Booking Lead Time Analysis (2026)
Average Booking Lead Time by Month
Booking Lead Time Insights for Rostrevor
- The overall average booking lead time for vacation rentals in Rostrevor is 57 days.
- Guests book furthest in advance for stays during December (average 87 days), likely coinciding with peak travel demand or local events.
- The shortest booking windows occur for stays in February (average 28 days), indicating more last-minute travel plans during this time.
- Seasonally, Summer (72 days avg.) sees the longest lead times, while Winter (49 days avg.) has the shortest, reflecting typical travel planning cycles.
Recommendations for Hosts
- Use the overall average lead time (57 days) as a baseline for your pricing and availability strategy in Rostrevor.
- For December stays, consider implementing length-of-stay discounts or slightly higher rates for bookings made less than 87 days out to capitalize on advance planning.
- Target marketing efforts for the Summer season well in advance (at least 72 days) to capture early planners.
- Monitor your own booking lead times against these Rostrevor averages to identify opportunities for dynamic pricing adjustments.
Popular & Essential Airbnb Amenities in Rostrevor (2026)
Amenity Prevalence
Amenity Insights for Rostrevor
- Essential amenities in Rostrevor that guests expect include: Smoke alarm. Lacking these (this) could significantly impact bookings.
- Popular amenities like Wifi, Heating, Hair dryer are common but not universal. Offering these can provide a competitive edge.
- Warning: Wifi is not universally provided but is considered essential globally. Ensure reliable Wifi is offered.
Recommendations for Hosts
- Ensure your listing includes all essential amenities for Rostrevor: Smoke alarm.
- Prioritize adding missing essentials: Smoke alarm.
- Consider adding popular differentiators like Wifi or Heating to increase appeal.
- Highlight unique or less common amenities you offer (e.g., hot tub, dedicated workspace, EV charger) in your listing description and photos.
- Regularly check competitor amenities in Rostrevor to stay competitive.
Rostrevor Airbnb Guest Demographics & Profile Analysis (2026)
Guest Profile Summary for Rostrevor
- The typical guest profile for Airbnb in Rostrevor consists of a mix of domestic (60%) and international guests, often arriving from nearby Belfast, typically belonging to the Post-2000s (Gen Z/Alpha) group (50%), primarily speaking English or French.
- Domestic travelers account for 60.2% of guests.
- Key international markets include United Kingdom (60.2%) and Ireland (20.4%).
- Top languages spoken are English (63.4%) followed by French (9.9%).
- A significant demographic segment is the Post-2000s (Gen Z/Alpha) group, representing 50% of guests.
Recommendations for Hosts
- Target domestic marketing efforts towards travelers from Belfast and Dublin.
- Tailor amenities and listing descriptions to appeal to the dominant Post-2000s (Gen Z/Alpha) demographic (e.g., highlight fast WiFi, smart home features, local guides).
- Highlight unique local experiences or amenities relevant to the primary guest profile.
- Consider seasonal promotions aligned with peak travel times for key origin markets.
Nearby Short-Term Rental Market Comparison
How does the Rostrevor Airbnb market stack up against its neighbors? Compare key performance metrics like average monthly revenue, ADR, and occupancy rates in surrounding areas to understand the broader regional STR landscape.
| Market | Active Properties | Monthly Revenue | Daily Rate | Avg. Occupancy |
|---|---|---|---|---|
| Bruichladdich | 17 | $4,237 | $319.79 | 55% |
| Irvinestown | 10 | $4,091 | $352.70 | 41% |
| Kilchattan Bay | 10 | $4,080 | $328.91 | 54% |
| Dublin 2 | 15 | $3,771 | $317.51 | 54% |
| Port Ellen | 30 | $3,689 | $201.39 | 66% |
| Bowmore | 23 | $3,641 | $239.89 | 61% |
| Kilcoo | 10 | $3,520 | $216.82 | 54% |
| Howth | 38 | $3,401 | $371.91 | 45% |
| Dalkey | 19 | $3,311 | $358.14 | 52% |
| Mullartown | 15 | $3,219 | $395.00 | 33% |