Balloch Airbnb Market Analysis 2026: Short Term Rental Data & Vacation Rental Statistics in Scotland, United Kingdom
Is Airbnb profitable in Balloch in 2026? Explore comprehensive Airbnb analytics for Balloch, Scotland, United Kingdom to uncover income potential. This 2026 STR market report for Balloch, based on AirROI data from February 2025 to January 2026, reveals key trends in the niche market of 69 active listings.
Whether you're considering an Airbnb investment in Balloch, optimizing your existing vacation rental, or exploring rental arbitrage opportunities, understanding the Balloch Airbnb data is crucial. Navigating the high regulation landscape is key to maximizing your short term rental income potential. Let's dive into the specifics.
Key Balloch Airbnb Performance Metrics Overview
Monthly Airbnb Revenue Variations & Income Potential in Balloch (2026)
Understanding the monthly revenue variations for Airbnb listings in Balloch is key to maximizing your short term rental income potential. Seasonality significantly impacts earnings. Our analysis, based on data from the past 12 months, shows that the peak revenue month for STRs in Balloch is typically August, while February often presents the lowest earnings, highlighting opportunities for strategic pricing adjustments during shoulder and low seasons. Explore the typical Airbnb income in Balloch across different performance tiers:
- Best-in-class properties (Top 10%) achieve $6,246+ monthly, often utilizing dynamic pricing and superior guest experiences.
- Strong performing properties (Top 25%) earn $3,977 or more, indicating effective management and desirable locations/amenities.
- Typical properties (Median) generate around $2,652 per month, representing the average market performance.
- Entry-level properties (Bottom 25%) see earnings around $1,652, often with potential for optimization.
Average Monthly Airbnb Earnings Trend in Balloch
Balloch Airbnb Occupancy Rate Trends (2026)
Maximize your bookings by understanding the Balloch STR occupancy trends. Seasonal demand shifts significantly influence how often properties are booked. Typically, Augustsees the highest demand (peak season occupancy), while January experiences the lowest (low season). Effective strategies, like adjusting minimum stays or offering promotions, can boost occupancy during slower periods. Here's how different property tiers perform in Balloch:
- Best-in-class properties (Top 10%) achieve 78%+ occupancy, indicating high desirability and potentially optimized availability.
- Strong performing properties (Top 25%) maintain 63% or higher occupancy, suggesting good market fit and guest satisfaction.
- Typical properties (Median) have an occupancy rate around 45%.
- Entry-level properties (Bottom 25%) average 24% occupancy, potentially facing higher vacancy.
Average Monthly Occupancy Rate Trend in Balloch
Average Daily Rate (ADR) Airbnb Trends in Balloch (2026)
Effective short term rental pricing strategy in Balloch involves understanding monthly ADR fluctuations. The Average Daily Rate (ADR) for Airbnb in Balloch typically peaks in August and dips lowest during February. Leveraging Airbnb dynamic pricing tools or strategies based on this seasonality can significantly boost revenue. Here's a look at the typical nightly rates achieved:
- Best-in-class properties (Top 10%) command rates of $457+ per night, often due to premium features or locations.
- Strong performing properties (Top 25%) achieve nightly rates of $266 or more.
- Typical properties (Median) charge around $181 per night.
- Entry-level properties (Bottom 25%) earn around $142 per night.
Average Daily Rate (ADR) Trend by Month in Balloch
Get Live Balloch Market Intelligence 👇

Explore Real-time Analytics
Airbnb Seasonality Analysis & Trends in Balloch (2026)
Peak Season (August, July, June)
- Revenue averages $4,837 per month
- Occupancy rates average 63.0%
- Daily rates average $268
Shoulder Season
- Revenue averages $3,382 per month
- Occupancy maintains around 44.6%
- Daily rates hold near $255
Low Season (January, February, March)
- Revenue drops to average $2,116 per month
- Occupancy decreases to average 28.1%
- Daily rates adjust to average $233
Seasonality Insights for Balloch
- The Airbnb seasonality in Balloch shows highly seasonal trends requiring careful strategy. While the sections above show seasonal averages, it's also insightful to look at the extremes:
- During the high season, the absolute peak month showcases Balloch's highest earning potential, with monthly revenues capable of climbing to $5,452, occupancy reaching a high of 69.9%, and ADRs peaking at $273.
- Conversely, the slowest single month of the year, typically falling within the low season, marks the market's lowest point. In this month, revenue might dip to $1,935, occupancy could drop to 21.9%, and ADRs may adjust down to $226.
- Understanding both the seasonal averages and these monthly peaks and troughs in revenue, occupancy, and ADR is crucial for maximizing your Airbnb profit potential in Balloch.
Seasonal Strategies for Maximizing Profit
- Peak Season: Maximize revenue through premium pricing and potentially longer minimum stays. Ensure high availability.
- Low Season: Offer competitive pricing, special promotions (e.g., extended stay discounts), and flexible cancellation policies. Target off-season travelers like remote workers or budget-conscious guests.
- Shoulder Seasons: Implement dynamic pricing that balances peak and low rates. Target weekend travelers or specific events. Offer slightly more flexible terms than peak season.
- Regularly analyze your own performance against these Balloch seasonality benchmarks and adjust your pricing and availability strategy accordingly.
Best Areas for Airbnb Investment in Balloch (2026)
Exploring the top neighborhoods for short-term rentals in Balloch? This section highlights key areas, outlining why they are attractive for hosts and guests, along with notable local attractions. Consider these locations based on your target guest profile and investment strategy.
| Neighborhood / Area | Why Host Here? (Target Guests & Appeal) | Key Attractions & Landmarks |
|---|---|---|
| Balloch Country Park | A picturesque park at the edge of Loch Lomond, ideal for outdoor activities and family fun. Attracts nature lovers and tourists looking for scenic walks and views of the loch. | Loch Lomond, Balloch Castle, Nature trails, Water activities, Picnic areas |
| Loch Lomond Shores | Popular shopping and leisure destination with stunning views of Loch Lomond. Offers a mix of retail, dining, and outdoor activities, appealing to visitors year-round. | The Sea Life Centre, Shopping outlets, Restaurants, Loch cruises, Walking trails |
| Duck Bay Marina | A beautiful marina area located at the northern end of Loch Lomond. Attracts boating enthusiasts and those looking for waterfront dining and relaxation. | Marina facilities, Water sports, Dining options, Scenic boat trips, Picnic areas |
| Clyde Muirshiel Regional Park | Scotland's largest regional park with numerous walking and cycling paths, as well as opportunities for wildlife watching. Popular among adventurous tourists. | Walking and biking trails, Wildlife viewing, Scenic landscapes, Visitor centre, Outdoor activities |
| Balloch train station area | Conveniently located for access to public transportation, making it easy for tourists to travel to Glasgow and surrounding areas. Appeals to travelers looking for convenience. | Train connections to Glasgow, Local shops and eateries, Parks nearby, Proximity to Loch Lomond |
| Local pubs and restaurants | Balloch boasts a variety of traditional Scottish pubs and eateries that attract both locals and tourists looking for authentic dining experiences. | McMonagles, The Ship Inn, Local fish and chips, Scenic views, Live music |
| Balloch Castle | A historical landmark that draws visitors interested in Scottish history and architecture. The surrounding parkland is great for walks and events. | Castle ruins, Events and weddings, Historical tours, Garden areas, Loch views |
| Helensburgh | Nearby coastal town with beautiful Victorian architecture and access to coastal walks. Offers a charming experience for those visiting Loch Lomond. | Victorian seafront, Hill House, Coastal paths, Local shops, Cafes and restaurants |
Understanding Airbnb License Requirements & STR Laws in Balloch (2026)
Yes, Balloch, Scotland, United Kingdom enforces high STR regulations. Obtaining a license and ensuring compliance is almost certainly required according to current 2026 STR laws. Always verify the latest short term rental regulations and Airbnb license requirements directly with local government authorities for Balloch to ensure full compliance before hosting.
(Source: AirROI data, 2026, based on 30% licensed listings)
Top Performing Airbnb Properties in Balloch (2026)
Benchmark your potential! Explore examples of top-performing Airbnb properties in Ballochbased on Trailing Twelve Month (TTM) revenue. Analyze their characteristics, revenue, occupancy rate, and ADR to understand what drives success in this market.
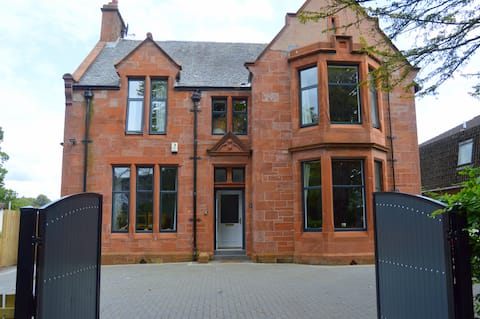
Cheerful 5 bedroom home on Loch Lomond
Entire Place • 5 bedrooms

Bonnie Banks Guesthouse - Loch Lomond
Entire Place • 7 bedrooms
The Loch Lomond Townhouse In The Centre of Balloch
Entire Place • 4 bedrooms

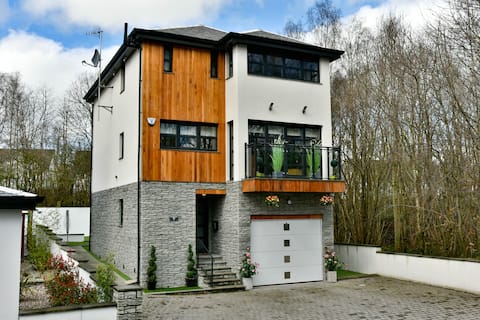
Riverside Penthouse in Balloch, Loch Lomond
Entire Place • 3 bedrooms
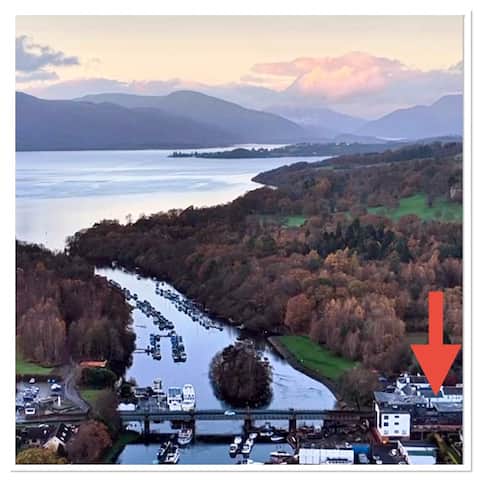
Riverside View Apartment in Balloch, Loch Lomond
Entire Place • 2 bedrooms

Cameron North Lodge
Entire Place • 3 bedrooms
Note: Performance varies based on location, size, amenities, seasonality, and management quality. Data reflects the past 12 months.
Top Performing Airbnb Hosts in Balloch (2026)
Learn from the best! This table showcases top-performing Airbnb hosts in Balloch based on the number of properties managed and estimated total revenue over the past year. Analyze their scale and performance metrics.
| Host Name | Properties | Grossing Revenue | Stay Reviews | Avg Rating |
|---|---|---|---|---|
| James | 5 | $290,424 | 112 | 4.86/5.0 |
| Colin | 1 | $227,425 | 63 | 5.00/5.0 |
| Anne | 5 | $220,199 | 643 | 4.89/5.0 |
| C G | 2 | $166,755 | 144 | 4.99/5.0 |
| Tommy | 1 | $156,742 | 187 | 4.93/5.0 |
| June | 4 | $131,571 | 420 | 4.93/5.0 |
| Rhonda | 5 | $119,325 | 248 | 4.75/5.0 |
| James | 3 | $112,364 | 46 | 4.89/5.0 |
| Moya | 3 | $96,990 | 250 | 4.87/5.0 |
| Sheila | 4 | $89,087 | 1033 | 4.95/5.0 |
Analyzing the strategies of top hosts, such as their property selection, pricing, and guest communication, can offer valuable lessons for optimizing your own Airbnb operations in Balloch.
Dive Deeper: Advanced Balloch STR Market Data (2026)
Ready to unlock more insights? AirROI provides access to advanced metrics and comprehensive Airbnb data for Balloch. Explore detailed analytics beyond this report to refine your investment strategy, optimize pricing, and maximize your vacation rental profits.
Explore Advanced MetricsBalloch Short-Term Rental Market Composition (2026): Property & Room Types
Room Type Distribution
Property Type Distribution
Market Composition Insights for Balloch
- The Balloch Airbnb market composition is heavily skewed towards Entire Home/Apt listings, which make up 84.1% of the 69 active rentals. This indicates strong guest preference for privacy and space.
- Looking at the property type distribution in Balloch, Apartment/Condo properties are the most common (47.8%), reflecting the local real estate landscape.
- Houses represent a significant 36.2% portion, catering likely to families or larger groups.
- The presence of 8.7% Hotel/Boutique listings indicates integration with traditional hospitality.
- Smaller segments like others, unique stays, outdoor/unique (combined 7.1%) offer potential for unique stay experiences.
Balloch Airbnb Room Capacity Analysis (2026): Bedroom Distribution
Distribution of Listings by Number of Bedrooms
Room Capacity Insights for Balloch
- The dominant room capacity in Balloch is 2 bedrooms listings, making up 37.7% of the market. This suggests a strong demand for properties suitable for couples or solo travelers.
- Together, 2 bedrooms and 1 bedroom properties represent 71.0% of the active Airbnb listings in Balloch, indicating a high concentration in these sizes.
- A significant 21.7% of listings offer 3+ bedrooms, catering to larger groups and families seeking more space in Balloch.
Balloch Vacation Rental Guest Capacity Trends (2026)
Distribution of Listings by Guest Capacity
Guest Capacity Insights for Balloch
- The most common guest capacity trend in Balloch vacation rentals is listings accommodating 4 guests (33.3%). This suggests the primary traveler segment is likely small families or groups.
- Properties designed for 4 guests and 2 guests dominate the Balloch STR market, accounting for 59.4% of listings.
- 21.7% of properties accommodate 6+ guests, serving the market segment for larger families or group travel in Balloch.
- On average, properties in Balloch are equipped to host 3.9 guests.
Balloch Airbnb Booking Patterns (2026): Available vs. Booked Days
Available Days Distribution
Booked Days Distribution
Booking Pattern Insights for Balloch
- The most common availability pattern in Balloch falls within the 181-270 days range, representing 43.5% of listings. This suggests many properties have significant open periods on their calendars.
- Approximately 65.2% of listings show high availability (181+ days open annually), indicating potential for increased bookings or specific owner usage patterns.
- For booked days, the 91-180 days range is most frequent in Balloch (42%), reflecting common guest stay durations or potential owner blocking patterns.
- A notable 37.6% of properties secure long booking periods (181+ days booked per year), highlighting successful long-term rental strategies or significant owner usage.
Balloch Airbnb Minimum Stay Requirements Analysis
Distribution of Listings by Minimum Night Requirement
1 Night
26 listings
37.7% of total
2 Nights
22 listings
31.9% of total
3 Nights
4 listings
5.8% of total
7-29 Nights
1 listings
1.4% of total
30+ Nights
16 listings
23.2% of total
Key Insights
- The most prevalent minimum stay requirement in Balloch is 1 Night, adopted by 37.7% of listings. This highlights the market's preference for shorter, flexible bookings.
- A strong majority (69.6%) of the Balloch Airbnb data shows acceptance of very short stays (1-2 nights), indicating a dynamic, high-turnover market.
- A significant segment (23.2%) caters to monthly stays (30+ nights) in Balloch, pointing to opportunities in the extended-stay market.
Recommendations
- Align with the market by considering a 1 Night minimum stay, as 37.7% of Balloch hosts use this setting.
- Explore offering discounts for stays of 30+ nights to attract the 23.2% of the market seeking extended stays.
- Adjust minimum nights based on seasonality – potentially shorter during low season and longer during peak demand periods in Balloch.
Balloch Airbnb Cancellation Policy Trends Analysis (2026)
Super Strict 30 Days
2 listings
2.9% of total
Super Strict 60 Days
2 listings
2.9% of total
Flexible
10 listings
14.5% of total
Moderate
22 listings
31.9% of total
Firm
23 listings
33.3% of total
Strict
10 listings
14.5% of total
Cancellation Policy Insights for Balloch
- The prevailing Airbnb cancellation policy trend in Balloch is Firm, used by 33.3% of listings.
- There's a relatively balanced mix between guest-friendly (46.4%) and stricter (47.8%) policies, offering choices for different guest needs.
Recommendations for Hosts
- Consider adopting a Firm policy to align with the 33.3% market standard in Balloch.
- Using a Strict policy might deter some guests, as only 14.5% of listings use it. Evaluate if potential revenue protection outweighs possible lower booking rates.
- Regularly review your cancellation policy against competitors and market demand shifts in Balloch.
Balloch STR Booking Lead Time Analysis (2026)
Average Booking Lead Time by Month
Booking Lead Time Insights for Balloch
- The overall average booking lead time for vacation rentals in Balloch is 71 days.
- Guests book furthest in advance for stays during August (average 122 days), likely coinciding with peak travel demand or local events.
- The shortest booking windows occur for stays in March (average 40 days), indicating more last-minute travel plans during this time.
- Seasonally, Summer (100 days avg.) sees the longest lead times, while Fall (64 days avg.) has the shortest, reflecting typical travel planning cycles.
Recommendations for Hosts
- Use the overall average lead time (71 days) as a baseline for your pricing and availability strategy in Balloch.
- For August stays, consider implementing length-of-stay discounts or slightly higher rates for bookings made less than 122 days out to capitalize on advance planning.
- Target marketing efforts for the Summer season well in advance (at least 100 days) to capture early planners.
- Monitor your own booking lead times against these Balloch averages to identify opportunities for dynamic pricing adjustments.
Popular & Essential Airbnb Amenities in Balloch (2026)
Amenity Prevalence
Amenity Insights for Balloch
- Essential amenities in Balloch that guests expect include: Heating. Lacking these (this) could significantly impact bookings.
- Popular amenities like Smoke alarm, Carbon monoxide alarm, Free parking on premises are common but not universal. Offering these can provide a competitive edge.
- Warning: Wifi is not universally provided but is considered essential globally. Ensure reliable Wifi is offered.
Recommendations for Hosts
- Ensure your listing includes all essential amenities for Balloch: Heating.
- Prioritize adding missing essentials: Heating.
- Consider adding popular differentiators like Smoke alarm or Carbon monoxide alarm to increase appeal.
- Highlight unique or less common amenities you offer (e.g., hot tub, dedicated workspace, EV charger) in your listing description and photos.
- Regularly check competitor amenities in Balloch to stay competitive.
Balloch Airbnb Guest Demographics & Profile Analysis (2026)
Guest Profile Summary for Balloch
- The typical guest profile for Airbnb in Balloch consists of a mix of domestic (58%) and international guests, often arriving from nearby England, typically belonging to the Post-2000s (Gen Z/Alpha) group (50%), primarily speaking English or French.
- Domestic travelers account for 58.0% of guests.
- Key international markets include United Kingdom (58%) and United States (15%).
- Top languages spoken are English (58.5%) followed by French (10.1%).
- A significant demographic segment is the Post-2000s (Gen Z/Alpha) group, representing 50% of guests.
Recommendations for Hosts
- Balance marketing efforts between domestic and international channels based on the guest mix.
- Tailor amenities and listing descriptions to appeal to the dominant Post-2000s (Gen Z/Alpha) demographic (e.g., highlight fast WiFi, smart home features, local guides).
- Highlight unique local experiences or amenities relevant to the primary guest profile.
- Consider seasonal promotions aligned with peak travel times for key origin markets.
Nearby Short-Term Rental Market Comparison
How does the Balloch Airbnb market stack up against its neighbors? Compare key performance metrics like average monthly revenue, ADR, and occupancy rates in surrounding areas to understand the broader regional STR landscape.
| Market | Active Properties | Monthly Revenue | Daily Rate | Avg. Occupancy |
|---|---|---|---|---|
| Ardlui | 10 | $6,556 | $714.77 | 30% |
| Bridge of Cally | 18 | $6,245 | $629.64 | 46% |
| Foyers | 18 | $5,824 | $354.91 | 57% |
| Dalkeith | 10 | $5,775 | $478.16 | 55% |
| Larbert | 10 | $5,686 | $322.43 | 56% |
| Camuscross | 13 | $5,401 | $356.08 | 60% |
| Gartocharn | 16 | $5,313 | $437.25 | 47% |
| Acharn | 11 | $5,066 | $284.21 | 61% |
| Luss | 18 | $5,059 | $381.65 | 49% |
| Kirkhill | 10 | $4,909 | $727.25 | 43% |