Carrbridge Airbnb Market Analysis 2026: Short Term Rental Data & Vacation Rental Statistics in Scotland, United Kingdom
Is Airbnb profitable in Carrbridge in 2026? Explore comprehensive Airbnb analytics for Carrbridge, Scotland, United Kingdom to uncover income potential. This 2026 STR market report for Carrbridge, based on AirROI data from February 2025 to January 2026, reveals key trends in the niche market of 32 active listings.
Whether you're considering an Airbnb investment in Carrbridge, optimizing your existing vacation rental, or exploring rental arbitrage opportunities, understanding the Carrbridge Airbnb data is crucial. Understanding the local regulations is key to maximizing your short term rental income potential. Let's dive into the specifics.
Key Carrbridge Airbnb Performance Metrics Overview
Monthly Airbnb Revenue Variations & Income Potential in Carrbridge (2026)
Understanding the monthly revenue variations for Airbnb listings in Carrbridge is key to maximizing your short term rental income potential. Seasonality significantly impacts earnings. Our analysis, based on data from the past 12 months, shows that the peak revenue month for STRs in Carrbridge is typically August, while January often presents the lowest earnings, highlighting opportunities for strategic pricing adjustments during shoulder and low seasons. Explore the typical Airbnb income in Carrbridge across different performance tiers:
- Best-in-class properties (Top 10%) achieve $5,096+ monthly, often utilizing dynamic pricing and superior guest experiences.
- Strong performing properties (Top 25%) earn $3,828 or more, indicating effective management and desirable locations/amenities.
- Typical properties (Median) generate around $2,242 per month, representing the average market performance.
- Entry-level properties (Bottom 25%) see earnings around $1,285, often with potential for optimization.
Average Monthly Airbnb Earnings Trend in Carrbridge
Carrbridge Airbnb Occupancy Rate Trends (2026)
Maximize your bookings by understanding the Carrbridge STR occupancy trends. Seasonal demand shifts significantly influence how often properties are booked. Typically, Augustsees the highest demand (peak season occupancy), while January experiences the lowest (low season). Effective strategies, like adjusting minimum stays or offering promotions, can boost occupancy during slower periods. Here's how different property tiers perform in Carrbridge:
- Best-in-class properties (Top 10%) achieve 78%+ occupancy, indicating high desirability and potentially optimized availability.
- Strong performing properties (Top 25%) maintain 61% or higher occupancy, suggesting good market fit and guest satisfaction.
- Typical properties (Median) have an occupancy rate around 43%.
- Entry-level properties (Bottom 25%) average 27% occupancy, potentially facing higher vacancy.
Average Monthly Occupancy Rate Trend in Carrbridge
Average Daily Rate (ADR) Airbnb Trends in Carrbridge (2026)
Effective short term rental pricing strategy in Carrbridge involves understanding monthly ADR fluctuations. The Average Daily Rate (ADR) for Airbnb in Carrbridge typically peaks in August and dips lowest during March. Leveraging Airbnb dynamic pricing tools or strategies based on this seasonality can significantly boost revenue. Here's a look at the typical nightly rates achieved:
- Best-in-class properties (Top 10%) command rates of $367+ per night, often due to premium features or locations.
- Strong performing properties (Top 25%) achieve nightly rates of $248 or more.
- Typical properties (Median) charge around $197 per night.
- Entry-level properties (Bottom 25%) earn around $120 per night.
Average Daily Rate (ADR) Trend by Month in Carrbridge
Get Live Carrbridge Market Intelligence 👇

Explore Real-time Analytics
Airbnb Seasonality Analysis & Trends in Carrbridge (2026)
Peak Season (August, July, May)
- Revenue averages $4,330 per month
- Occupancy rates average 65.6%
- Daily rates average $236
Shoulder Season
- Revenue averages $2,601 per month
- Occupancy maintains around 44.1%
- Daily rates hold near $226
Low Season (January, March, November)
- Revenue drops to average $1,534 per month
- Occupancy decreases to average 26.6%
- Daily rates adjust to average $219
Seasonality Insights for Carrbridge
- The Airbnb seasonality in Carrbridge shows highly seasonal trends requiring careful strategy. While the sections above show seasonal averages, it's also insightful to look at the extremes:
- During the high season, the absolute peak month showcases Carrbridge's highest earning potential, with monthly revenues capable of climbing to $4,773, occupancy reaching a high of 71.4%, and ADRs peaking at $239.
- Conversely, the slowest single month of the year, typically falling within the low season, marks the market's lowest point. In this month, revenue might dip to $1,367, occupancy could drop to 21.9%, and ADRs may adjust down to $215.
- Understanding both the seasonal averages and these monthly peaks and troughs in revenue, occupancy, and ADR is crucial for maximizing your Airbnb profit potential in Carrbridge.
Seasonal Strategies for Maximizing Profit
- Peak Season: Maximize revenue through premium pricing and potentially longer minimum stays. Ensure high availability.
- Low Season: Offer competitive pricing, special promotions (e.g., extended stay discounts), and flexible cancellation policies. Target off-season travelers like remote workers or budget-conscious guests.
- Shoulder Seasons: Implement dynamic pricing that balances peak and low rates. Target weekend travelers or specific events. Offer slightly more flexible terms than peak season.
- Regularly analyze your own performance against these Carrbridge seasonality benchmarks and adjust your pricing and availability strategy accordingly.
Best Areas for Airbnb Investment in Carrbridge (2026)
Exploring the top neighborhoods for short-term rentals in Carrbridge? This section highlights key areas, outlining why they are attractive for hosts and guests, along with notable local attractions. Consider these locations based on your target guest profile and investment strategy.
| Neighborhood / Area | Why Host Here? (Target Guests & Appeal) | Key Attractions & Landmarks |
|---|---|---|
| Carrbridge Village | A charming Scottish village known for its picturesque scenery and proximity to outdoor activities. It's ideal for tourists seeking a peaceful retreat in the Highlands, making it a popular destination for families and nature lovers. | Carrbridge Packhorse Bridge, Landmark Forest Adventure Park, Pwalk Highland Wildlife Park, Fishing and hiking in the Spey Valley, Nearby Cairngorms National Park |
| Grantown-on-Spey | Just a short drive from Carrbridge, this town offers beautiful architecture and access to the scenic Spey River. A great base for exploring the surrounding natural beauty and whisky distilleries. | Grantown Museum, Speyside Distillery, Cragganmore Distillery, Cairngorms National Park, Rothiemurchus Estate |
| Aviemore | A major tourist hub in the Cairngorms, known for skiing and outdoor sports. Attracts a large number of visitors year-round, making it an excellent spot for Airbnb investments. | Aviemore Ski Resort, Cairngorm Mountain Railway, Rothiemurchus Forest, Outdoor adventure activities, Highland Wildlife Park |
| Nethy Bridge | A quaint village located near the River Nethy, known for its tranquility and access to walking routes. It's appealing to those seeking a serene getaway. | Nethy Bridge Golf Club, Cairngorms National Park, Forest walks, RSPB Abernethy Nature Reserve |
| Tomintoul | This scenic village is known for its whisky production and stunning views. It attracts visitors looking for a taste of Scottish culture and outdoor activities. | Tomintoul Distillery, The Old Church, Walking and cycling routes, Banffshire Coast |
| Kingussie | A small town that serves as a gateway to the Cairngorms, it offers access to a variety of outdoors activities and historical sites. Popular with hikers and nature enthusiasts. | Ruthven Barracks, Highland Folk Museum, Kincraig, Boat of Garten |
| Inverness | Although a bit farther away, the capital of the Highlands offers a vibrant city experience and is a focal point for tourists exploring the northern region of Scotland. Strong demand for short-term rentals. | Inverness Castle, Loch Ness, Culloden Battlefield, Inverness Museum and Art Gallery |
| Forres | A historic market town not too far from Carrbridge, known for its beautiful parks and gardens. It attracts visitors seeking a quieter character while still close to major attractions. | Grant Park, Forres High Street, Historic ruins, Nearby Moray Coast |
Understanding Airbnb License Requirements & STR Laws in Carrbridge (2026)
With 25% of listings showing registration in 2026, understanding potential Airbnb license requirements is crucial in Carrbridge. Always verify the latest short term rental regulations and Airbnb license requirements directly with local government authorities for Carrbridge to ensure full compliance before hosting.
(Source: AirROI data, 2026, based on 25% licensed listings)
Top Performing Airbnb Properties in Carrbridge (2026)
Benchmark your potential! Explore examples of top-performing Airbnb properties in Carrbridgebased on Trailing Twelve Month (TTM) revenue. Analyze their characteristics, revenue, occupancy rate, and ADR to understand what drives success in this market.

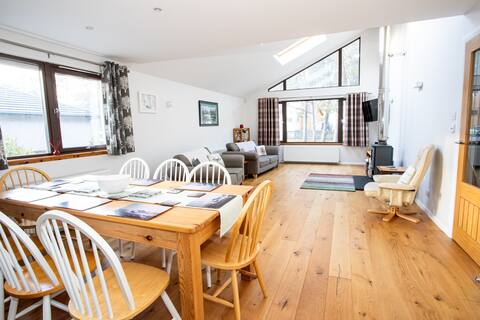
Lovely 4 bedroom home in Cairngorms National Park
Entire Place • 4 bedrooms
Birchtree Cottage
Entire Place • 4 bedrooms

Resaurie - a tranquil retreat
Entire Place • 3 bedrooms

Mole Catcher's Cottage, Carrbridge, Cairngorm
Entire Place • 2 bedrooms
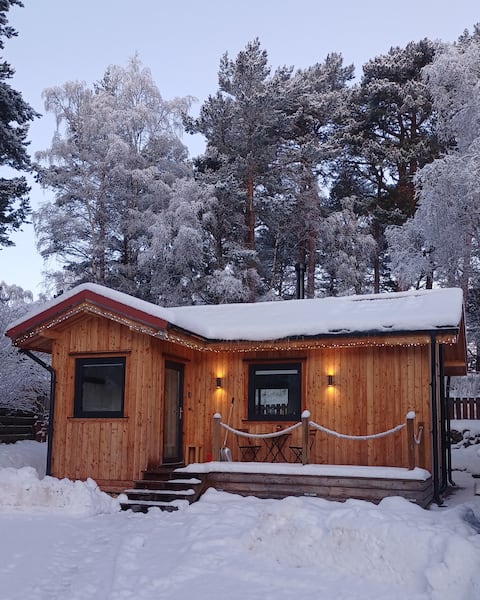
Cosy modern cabin- Carrbridge, near Aviemore
Entire Place • 1 bedroom

Mrs Clarks' Classroom, The Old School Carrbridge
Entire Place • 2 bedrooms
Note: Performance varies based on location, size, amenities, seasonality, and management quality. Data reflects the past 12 months.
Top Performing Airbnb Hosts in Carrbridge (2026)
Learn from the best! This table showcases top-performing Airbnb hosts in Carrbridge based on the number of properties managed and estimated total revenue over the past year. Analyze their scale and performance metrics.
| Host Name | Properties | Grossing Revenue | Stay Reviews | Avg Rating |
|---|---|---|---|---|
| Kate | 3 | $109,922 | 196 | 4.89/5.0 |
| Gareth | 9 | $88,570 | 70 | 4.97/5.0 |
| Karen | 1 | $76,873 | 72 | 5.00/5.0 |
| Douglas | 1 | $59,437 | 79 | 4.94/5.0 |
| Cawdor Estate Holiday Cottages | 1 | $49,121 | 35 | 4.97/5.0 |
| The Norton Family | 1 | $44,230 | 125 | 4.98/5.0 |
| Laura | 1 | $43,894 | 115 | 4.97/5.0 |
| Susan Jane | 1 | $38,943 | 101 | 4.85/5.0 |
| Cat | 1 | $37,409 | 91 | 4.95/5.0 |
| Cottages | 3 | $36,368 | 13 | 4.40/5.0 |
Analyzing the strategies of top hosts, such as their property selection, pricing, and guest communication, can offer valuable lessons for optimizing your own Airbnb operations in Carrbridge.
Dive Deeper: Advanced Carrbridge STR Market Data (2026)
Ready to unlock more insights? AirROI provides access to advanced metrics and comprehensive Airbnb data for Carrbridge. Explore detailed analytics beyond this report to refine your investment strategy, optimize pricing, and maximize your vacation rental profits.
Explore Advanced MetricsCarrbridge Short-Term Rental Market Composition (2026): Property & Room Types
Room Type Distribution
Property Type Distribution
Market Composition Insights for Carrbridge
- The Carrbridge Airbnb market composition is heavily skewed towards Entire Home/Apt listings, which make up 68.8% of the 32 active rentals. This indicates strong guest preference for privacy and space.
- However, a notable 31.3% share for Private Rooms suggests opportunities for budget-conscious travelers or hosts renting out spare rooms.
- Looking at the property type distribution in Carrbridge, House properties are the most common (59.4%), reflecting the local real estate landscape.
- Houses represent a significant 59.4% portion, catering likely to families or larger groups.
- The presence of 28.1% Hotel/Boutique listings indicates integration with traditional hospitality.
- Smaller segments like others, outdoor/unique (combined 6.2%) offer potential for unique stay experiences.
Carrbridge Airbnb Room Capacity Analysis (2026): Bedroom Distribution
Distribution of Listings by Number of Bedrooms
Room Capacity Insights for Carrbridge
- The dominant room capacity in Carrbridge is 1 bedroom listings, making up 50% of the market. This suggests a strong demand for properties suitable for couples or solo travelers.
- Together, 1 bedroom and 2 bedrooms properties represent 68.8% of the active Airbnb listings in Carrbridge, indicating a high concentration in these sizes.
- A significant 31.3% of listings offer 3+ bedrooms, catering to larger groups and families seeking more space in Carrbridge.
Carrbridge Vacation Rental Guest Capacity Trends (2026)
Distribution of Listings by Guest Capacity
Guest Capacity Insights for Carrbridge
- The most common guest capacity trend in Carrbridge vacation rentals is listings accommodating 2 guests (25%). This suggests the primary traveler segment is likely couples or solo travelers.
- Properties designed for 2 guests and 4 guests dominate the Carrbridge STR market, accounting for 46.9% of listings.
- A significant 40.6% of listings cater specifically to 1-2 guests, highlighting strong demand from couples and solo travelers in Carrbridge.
- 28.2% of properties accommodate 6+ guests, serving the market segment for larger families or group travel in Carrbridge.
- On average, properties in Carrbridge are equipped to host 3.8 guests.
Carrbridge Airbnb Booking Patterns (2026): Available vs. Booked Days
Available Days Distribution
Booked Days Distribution
Booking Pattern Insights for Carrbridge
- The most common availability pattern in Carrbridge falls within the 181-270 days range, representing 40.6% of listings. This suggests many properties have significant open periods on their calendars.
- Approximately 78.1% of listings show high availability (181+ days open annually), indicating potential for increased bookings or specific owner usage patterns.
- For booked days, the 91-180 days range is most frequent in Carrbridge (40.6%), reflecting common guest stay durations or potential owner blocking patterns.
- A notable 21.9% of properties secure long booking periods (181+ days booked per year), highlighting successful long-term rental strategies or significant owner usage.
Carrbridge Airbnb Minimum Stay Requirements Analysis
Distribution of Listings by Minimum Night Requirement
1 Night
11 listings
34.4% of total
2 Nights
3 listings
9.4% of total
3 Nights
4 listings
12.5% of total
4-6 Nights
2 listings
6.3% of total
30+ Nights
12 listings
37.5% of total
Key Insights
- The most prevalent minimum stay requirement in Carrbridge is 30+ Nights, adopted by 37.5% of listings. This highlights the market's preference for longer commitments.
- A significant segment (37.5%) caters to monthly stays (30+ nights) in Carrbridge, pointing to opportunities in the extended-stay market.
Recommendations
- Align with the market by considering a 30+ Nights minimum stay, as 37.5% of Carrbridge hosts use this setting.
- Explore offering discounts for stays of 30+ nights to attract the 37.5% of the market seeking extended stays.
- Adjust minimum nights based on seasonality – potentially shorter during low season and longer during peak demand periods in Carrbridge.
Carrbridge Airbnb Cancellation Policy Trends Analysis (2026)
Super Strict 60 Days
4 listings
12.5% of total
Flexible
9 listings
28.1% of total
Firm
14 listings
43.8% of total
Strict
5 listings
15.6% of total
Cancellation Policy Insights for Carrbridge
- The prevailing Airbnb cancellation policy trend in Carrbridge is Firm, used by 43.8% of listings.
- A majority (59.4%) of hosts in Carrbridge utilize Firm or Strict policies, indicating a market where hosts prioritize booking security.
Recommendations for Hosts
- Consider adopting a Firm policy to align with the 43.8% market standard in Carrbridge.
- Regularly review your cancellation policy against competitors and market demand shifts in Carrbridge.
Carrbridge STR Booking Lead Time Analysis (2026)
Average Booking Lead Time by Month
Booking Lead Time Insights for Carrbridge
- The overall average booking lead time for vacation rentals in Carrbridge is 92 days.
- Guests book furthest in advance for stays during May (average 105 days), likely coinciding with peak travel demand or local events.
- The shortest booking windows occur for stays in February (average 41 days), indicating more last-minute travel plans during this time.
- Seasonally, Summer (100 days avg.) sees the longest lead times, while Winter (63 days avg.) has the shortest, reflecting typical travel planning cycles.
Recommendations for Hosts
- Use the overall average lead time (92 days) as a baseline for your pricing and availability strategy in Carrbridge.
- For May stays, consider implementing length-of-stay discounts or slightly higher rates for bookings made less than 105 days out to capitalize on advance planning.
- Target marketing efforts for the Summer season well in advance (at least 100 days) to capture early planners.
- Monitor your own booking lead times against these Carrbridge averages to identify opportunities for dynamic pricing adjustments.
Popular & Essential Airbnb Amenities in Carrbridge (2026)
Amenity Prevalence
Amenity Insights for Carrbridge
- Essential amenities in Carrbridge that guests expect include: Wifi, Free parking on premises. Lacking these (any) could significantly impact bookings.
- Popular amenities like Heating, Bed linens, TV are common but not universal. Offering these can provide a competitive edge.
Recommendations for Hosts
- Ensure your listing includes all essential amenities for Carrbridge: Wifi, Free parking on premises.
- Prioritize adding missing essentials: Free parking on premises.
- Consider adding popular differentiators like Heating or Bed linens to increase appeal.
- Highlight unique or less common amenities you offer (e.g., hot tub, dedicated workspace, EV charger) in your listing description and photos.
- Regularly check competitor amenities in Carrbridge to stay competitive.
Carrbridge Airbnb Guest Demographics & Profile Analysis (2026)
Guest Profile Summary for Carrbridge
- The typical guest profile for Airbnb in Carrbridge consists of a mix of domestic (60%) and international guests, often arriving from nearby England, typically belonging to the Post-2000s (Gen Z/Alpha) group (50%), primarily speaking English or Spanish.
- Domestic travelers account for 59.7% of guests.
- Key international markets include United Kingdom (59.7%) and United States (11.8%).
- Top languages spoken are English (56%) followed by Spanish (9.2%).
- A significant demographic segment is the Post-2000s (Gen Z/Alpha) group, representing 50% of guests.
Recommendations for Hosts
- Balance marketing efforts between domestic and international channels based on the guest mix.
- Tailor amenities and listing descriptions to appeal to the dominant Post-2000s (Gen Z/Alpha) demographic (e.g., highlight fast WiFi, smart home features, local guides).
- Highlight unique local experiences or amenities relevant to the primary guest profile.
- Consider seasonal promotions aligned with peak travel times for key origin markets.
Nearby Short-Term Rental Market Comparison
How does the Carrbridge Airbnb market stack up against its neighbors? Compare key performance metrics like average monthly revenue, ADR, and occupancy rates in surrounding areas to understand the broader regional STR landscape.
| Market | Active Properties | Monthly Revenue | Daily Rate | Avg. Occupancy |
|---|---|---|---|---|
| Ardlui | 10 | $6,556 | $714.77 | 30% |
| Bridge of Cally | 18 | $6,245 | $629.64 | 46% |
| Foyers | 18 | $5,824 | $354.91 | 57% |
| Larbert | 10 | $5,686 | $322.43 | 56% |
| Gartocharn | 16 | $5,313 | $437.25 | 47% |
| Acharn | 11 | $5,066 | $284.21 | 61% |
| Luss | 18 | $5,059 | $381.65 | 49% |
| Kirkhill | 10 | $4,909 | $727.25 | 43% |
| Arrochar | 34 | $4,898 | $344.76 | 53% |
| Fearnan | 22 | $4,850 | $439.88 | 41% |