Foyers Airbnb Market Analysis 2026: Short Term Rental Data & Vacation Rental Statistics in Scotland, United Kingdom
Is Airbnb profitable in Foyers in 2026? Explore comprehensive Airbnb analytics for Foyers, Scotland, United Kingdom to uncover income potential. This 2026 STR market report for Foyers, based on AirROI data from February 2025 to January 2026, reveals key trends in the niche market of 18 active listings.
Whether you're considering an Airbnb investment in Foyers, optimizing your existing vacation rental, or exploring rental arbitrage opportunities, understanding the Foyers Airbnb data is crucial. Navigating the high regulation landscape is key to maximizing your short term rental income potential. Let's dive into the specifics.
Key Foyers Airbnb Performance Metrics Overview
Monthly Airbnb Revenue Variations & Income Potential in Foyers (2026)
Understanding the monthly revenue variations for Airbnb listings in Foyers is key to maximizing your short term rental income potential. Seasonality significantly impacts earnings. Our analysis, based on data from the past 12 months, shows that the peak revenue month for STRs in Foyers is typically December, while January often presents the lowest earnings, highlighting opportunities for strategic pricing adjustments during shoulder and low seasons. Explore the typical Airbnb income in Foyers across different performance tiers:
- Best-in-class properties (Top 10%) achieve $15,428+ monthly, often utilizing dynamic pricing and superior guest experiences.
- Strong performing properties (Top 25%) earn $12,903 or more, indicating effective management and desirable locations/amenities.
- Typical properties (Median) generate around $5,503 per month, representing the average market performance.
- Entry-level properties (Bottom 25%) see earnings around $2,484, often with potential for optimization.
Average Monthly Airbnb Earnings Trend in Foyers
Foyers Airbnb Occupancy Rate Trends (2026)
Maximize your bookings by understanding the Foyers STR occupancy trends. Seasonal demand shifts significantly influence how often properties are booked. Typically, Septembersees the highest demand (peak season occupancy), while January experiences the lowest (low season). Effective strategies, like adjusting minimum stays or offering promotions, can boost occupancy during slower periods. Here's how different property tiers perform in Foyers:
- Best-in-class properties (Top 10%) achieve 94%+ occupancy, indicating high desirability and potentially optimized availability.
- Strong performing properties (Top 25%) maintain 92% or higher occupancy, suggesting good market fit and guest satisfaction.
- Typical properties (Median) have an occupancy rate around 66%.
- Entry-level properties (Bottom 25%) average 26% occupancy, potentially facing higher vacancy.
Average Monthly Occupancy Rate Trend in Foyers
Average Daily Rate (ADR) Airbnb Trends in Foyers (2026)
Effective short term rental pricing strategy in Foyers involves understanding monthly ADR fluctuations. The Average Daily Rate (ADR) for Airbnb in Foyers typically peaks in December and dips lowest during March. Leveraging Airbnb dynamic pricing tools or strategies based on this seasonality can significantly boost revenue. Here's a look at the typical nightly rates achieved:
- Best-in-class properties (Top 10%) command rates of $544+ per night, often due to premium features or locations.
- Strong performing properties (Top 25%) achieve nightly rates of $448 or more.
- Typical properties (Median) charge around $322 per night.
- Entry-level properties (Bottom 25%) earn around $156 per night.
Average Daily Rate (ADR) Trend by Month in Foyers
Get Live Foyers Market Intelligence 👇
Explore Real-time Analytics
Airbnb Seasonality Analysis & Trends in Foyers (2026)
Peak Season (December, July, June)
- Revenue averages $8,858 per month
- Occupancy rates average 59.6%
- Daily rates average $352
Shoulder Season
- Revenue averages $8,122 per month
- Occupancy maintains around 64.6%
- Daily rates hold near $335
Low Season (January, March, October)
- Revenue drops to average $6,519 per month
- Occupancy decreases to average 53.9%
- Daily rates adjust to average $351
Seasonality Insights for Foyers
- The Airbnb seasonality in Foyers shows moderate seasonality with distinct peak and low periods. While the sections above show seasonal averages, it's also insightful to look at the extremes:
- During the high season, the absolute peak month showcases Foyers's highest earning potential, with monthly revenues capable of climbing to $9,217, occupancy reaching a high of 74.2%, and ADRs peaking at $388.
- Conversely, the slowest single month of the year, typically falling within the low season, marks the market's lowest point. In this month, revenue might dip to $4,844, occupancy could drop to 38.4%, and ADRs may adjust down to $312.
- Understanding both the seasonal averages and these monthly peaks and troughs in revenue, occupancy, and ADR is crucial for maximizing your Airbnb profit potential in Foyers.
Seasonal Strategies for Maximizing Profit
- Peak Season: Maximize revenue through premium pricing and potentially longer minimum stays. Ensure high availability.
- Low Season: Offer competitive pricing, special promotions (e.g., extended stay discounts), and flexible cancellation policies. Target off-season travelers like remote workers or budget-conscious guests.
- Shoulder Seasons: Implement dynamic pricing that balances peak and low rates. Target weekend travelers or specific events. Offer slightly more flexible terms than peak season.
- Regularly analyze your own performance against these Foyers seasonality benchmarks and adjust your pricing and availability strategy accordingly.
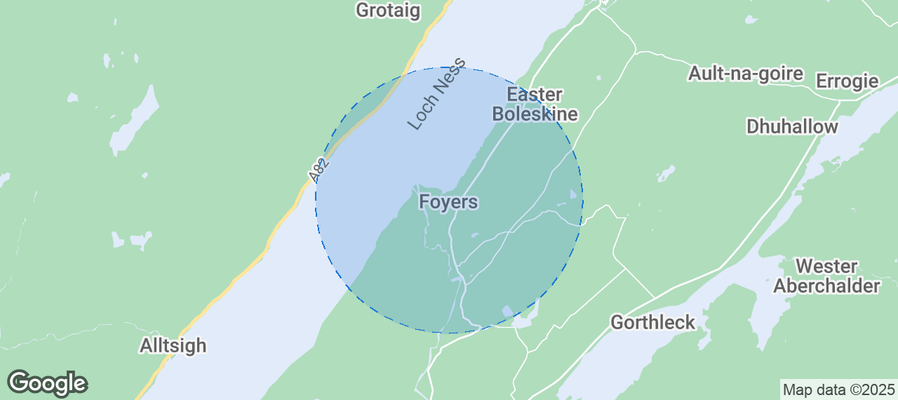
Best Areas for Airbnb Investment in Foyers (2026)
Exploring the top neighborhoods for short-term rentals in Foyers? This section highlights key areas, outlining why they are attractive for hosts and guests, along with notable local attractions. Consider these locations based on your target guest profile and investment strategy.
| Neighborhood / Area | Why Host Here? (Target Guests & Appeal) | Key Attractions & Landmarks |
|---|---|---|
| Foyers Village | A picturesque village on the south side of Loch Ness, offering stunning views and a peaceful atmosphere. Ideal for those looking to escape the city and enjoy nature and outdoor activities. | Loch Ness, Foyers Waterfall, The Great Glen Way, Urquhart Castle, Falls of Foyers |
| Inverness | The nearby city of Inverness is the administrative center of the Highlands and offers a range of amenities and attractions. It's a great base for tourists exploring the Loch Ness area. | Inverness Castle, Culloden Battlefield, Loch Ness Centre and Exhibition, Inverness Museum and Art Gallery, River Ness |
| Fort Augustus | Located at the southern end of Loch Ness, this charming village is known for its scenic beauty and the Caledonian Canal. It attracts visitors interested in boating and hiking. | Fort Augustus Abbey, The Caledonian Canal, Loch Ness Cruises, Invergarry Castle, The Great Glen |
| Drumnadrochit | A key location for Loch Ness tourism, this village has several shops and attractions related to the Loch Ness Monster. It's a popular spot for tourists. | Loch Ness Monster Exhibition Centre, Urquhart Castle, River Coiltie, Nessieland, The Old Mill |
| Dores | A small village located on the eastern shore of Loch Ness, Dores offers beautiful views of the loch and is a favored spot for local recreation. | Dores Beach, The Dores Inn, Loch Ness Views, Hiking Trails, Wildlife Watching |
| Whitebridge | A tranquil village near Loch Ness, Whitebridge is perfect for those seeking quiet retreats and access to nature. | Loch Ness, Great Glen Way, Highland Wildlife Park, Fishing Spots, Nature Trails |
| Culbokie | A small village with scenic views of the Black Isle, Culbokie appeals to those looking for rural escapes with easy access to both Loch Ness and the coastline. | Black Isle Views, Nearby Beaches, Culbokie Woods, Nature Walks, Local Farms |
| Laggan | A scenic village located near the western end of Loch Ness, Laggan is a great base for outdoor activities such as hiking and fishing. | Loch Laggan, Outdoor Adventure Sports, Scenic Walks, Glen Choose, Nature Reserves |
Understanding Airbnb License Requirements & STR Laws in Foyers (2026)
Yes, Foyers, Scotland, United Kingdom enforces high STR regulations. Obtaining a license and ensuring compliance is almost certainly required according to current 2026 STR laws. Always verify the latest short term rental regulations and Airbnb license requirements directly with local government authorities for Foyers to ensure full compliance before hosting.
(Source: AirROI data, 2026, based on 44% licensed listings)
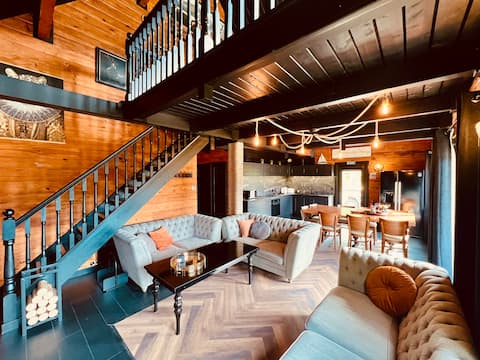
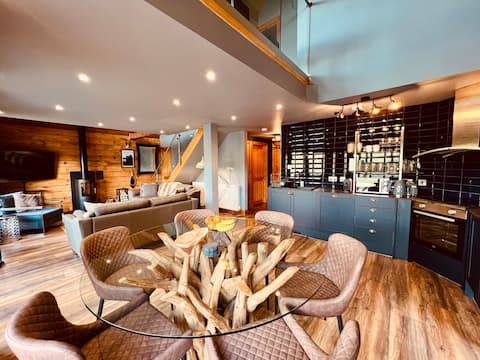
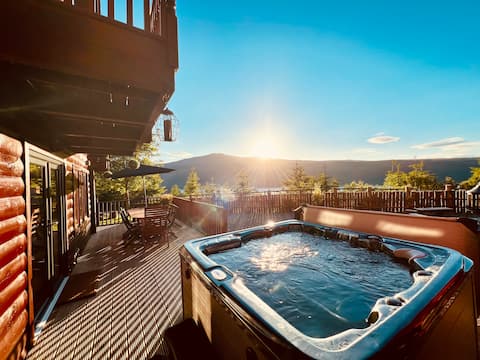
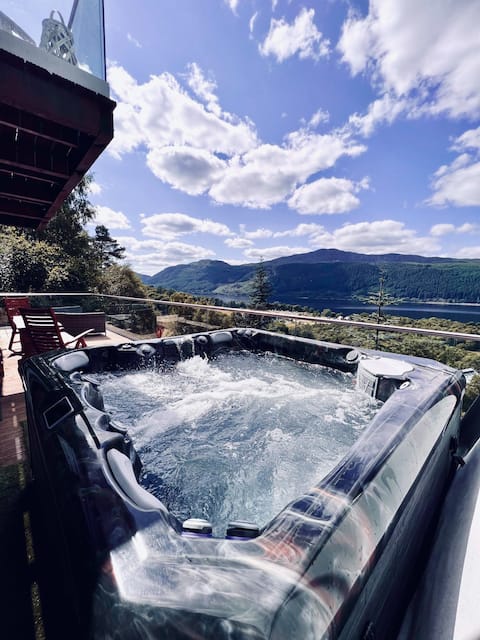
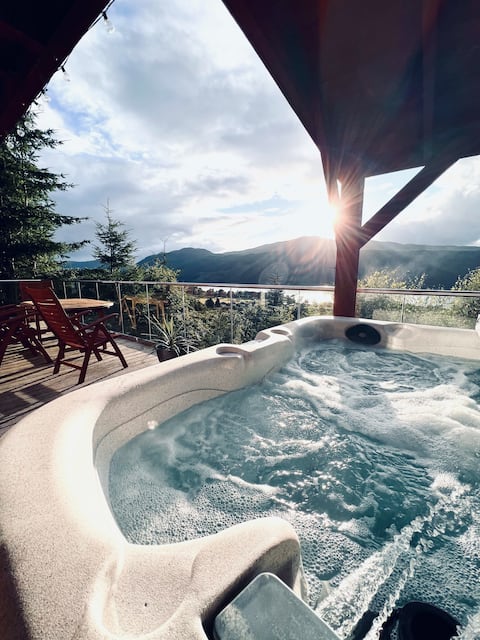
Top Performing Airbnb Properties in Foyers (2026)
Benchmark your potential! Explore examples of top-performing Airbnb properties in Foyersbased on Trailing Twelve Month (TTM) revenue. Analyze their characteristics, revenue, occupancy rate, and ADR to understand what drives success in this market.
Stunning Loch Ness lodge with hot tub and sauna
Entire Place • 3 bedrooms
Luxury Loch Ness lodge with hot tub & sauna
Entire Place • 3 bedrooms
Group lodge with hot tub and fire pit
Entire Place • 3 bedrooms
Luxury lodge on Loch Ness + hot tub & sauna
Entire Place • 3 bedrooms

Sealladh an Loch - stunning views
Entire Place • 6 bedrooms
Lochnagar: luxury Loch Ness lodge, hot tub & sauna
Entire Place • 3 bedrooms
Note: Performance varies based on location, size, amenities, seasonality, and management quality. Data reflects the past 12 months.
Top Performing Airbnb Hosts in Foyers (2026)
Learn from the best! This table showcases top-performing Airbnb hosts in Foyers based on the number of properties managed and estimated total revenue over the past year. Analyze their scale and performance metrics.
| Host Name | Properties | Grossing Revenue | Stay Reviews | Avg Rating |
|---|---|---|---|---|
| Phoebe | 6 | $901,631 | 195 | 4.95/5.0 |
| Susan | 1 | $140,242 | 71 | 4.94/5.0 |
| Gary | 1 | $50,680 | 113 | 4.93/5.0 |
| Robert | 1 | $34,668 | 150 | 4.99/5.0 |
| Lorna | 1 | $30,529 | 422 | 5.00/5.0 |
| Michael | 1 | $27,512 | 391 | 4.99/5.0 |
| Sian | 1 | $22,037 | 6 | 5.00/5.0 |
| Ali | 1 | $19,701 | 3 | 5.00/5.0 |
| Lindsey | 1 | $12,116 | 428 | 4.84/5.0 |
| Sykes Holiday Cottages Limited | 1 | $11,868 | 12 | 4.83/5.0 |
Analyzing the strategies of top hosts, such as their property selection, pricing, and guest communication, can offer valuable lessons for optimizing your own Airbnb operations in Foyers.
Dive Deeper: Advanced Foyers STR Market Data (2026)
Ready to unlock more insights? AirROI provides access to advanced metrics and comprehensive Airbnb data for Foyers. Explore detailed analytics beyond this report to refine your investment strategy, optimize pricing, and maximize your vacation rental profits.
Explore Advanced MetricsFoyers Short-Term Rental Market Composition (2026): Property & Room Types
Room Type Distribution
Property Type Distribution
Market Composition Insights for Foyers
- The Foyers Airbnb market composition is heavily skewed towards Entire Home/Apt listings, which make up 72.2% of the 18 active rentals. This indicates strong guest preference for privacy and space.
- Looking at the property type distribution in Foyers, House properties are the most common (50%), reflecting the local real estate landscape.
- Houses represent a significant 50% portion, catering likely to families or larger groups.
- The presence of 11.1% Hotel/Boutique listings indicates integration with traditional hospitality.
Foyers Airbnb Room Capacity Analysis (2026): Bedroom Distribution
Distribution of Listings by Number of Bedrooms
Room Capacity Insights for Foyers
- The dominant room capacity in Foyers is 3 bedrooms listings, making up 38.9% of the market. This suggests a strong demand for properties suitable for families or small groups.
- Together, 3 bedrooms and 1 bedroom properties represent 77.8% of the active Airbnb listings in Foyers, indicating a high concentration in these sizes.
- A significant 44.5% of listings offer 3+ bedrooms, catering to larger groups and families seeking more space in Foyers.
Foyers Vacation Rental Guest Capacity Trends (2026)
Distribution of Listings by Guest Capacity
Guest Capacity Insights for Foyers
- The most common guest capacity trend in Foyers vacation rentals is listings accommodating 2 guests (33.3%). This suggests the primary traveler segment is likely couples or solo travelers.
- Properties designed for 2 guests and 6 guests dominate the Foyers STR market, accounting for 61.1% of listings.
- 44.5% of properties accommodate 6+ guests, serving the market segment for larger families or group travel in Foyers.
- On average, properties in Foyers are equipped to host 3.9 guests.
Foyers Airbnb Booking Patterns (2026): Available vs. Booked Days
Available Days Distribution
Booked Days Distribution
Booking Pattern Insights for Foyers
- The most common availability pattern in Foyers falls within the 271-366 days range, representing 33.3% of listings. This suggests many properties have significant open periods on their calendars.
- Approximately 44.4% of listings show high availability (181+ days open annually), indicating potential for increased bookings or specific owner usage patterns.
- For booked days, the 271-366 days range is most frequent in Foyers (33.3%), reflecting common guest stay durations or potential owner blocking patterns.
- A notable 55.5% of properties secure long booking periods (181+ days booked per year), highlighting successful long-term rental strategies or significant owner usage.
Foyers Airbnb Minimum Stay Requirements Analysis
Distribution of Listings by Minimum Night Requirement
1 Night
5 listings
27.8% of total
2 Nights
1 listings
5.6% of total
3 Nights
3 listings
16.7% of total
30+ Nights
9 listings
50% of total
Key Insights
- The most prevalent minimum stay requirement in Foyers is 30+ Nights, adopted by 50% of listings. This highlights the market's preference for longer commitments.
- A significant segment (50%) caters to monthly stays (30+ nights) in Foyers, pointing to opportunities in the extended-stay market.
Recommendations
- Align with the market by considering a 30+ Nights minimum stay, as 50% of Foyers hosts use this setting.
- If feasible, allowing 1-night stays, especially midweek or during low season, could capture last-minute bookings, as only 27.8% currently do.
- Explore offering discounts for stays of 30+ nights to attract the 50% of the market seeking extended stays.
- Adjust minimum nights based on seasonality – potentially shorter during low season and longer during peak demand periods in Foyers.
Foyers Airbnb Cancellation Policy Trends Analysis (2026)
Super Strict 60 Days
1 listings
5.6% of total
Flexible
1 listings
5.6% of total
Moderate
3 listings
16.7% of total
Firm
8 listings
44.4% of total
Strict
5 listings
27.8% of total
Cancellation Policy Insights for Foyers
- The prevailing Airbnb cancellation policy trend in Foyers is Firm, used by 44.4% of listings.
- A majority (72.2%) of hosts in Foyers utilize Firm or Strict policies, indicating a market where hosts prioritize booking security.
Recommendations for Hosts
- Consider adopting a Firm policy to align with the 44.4% market standard in Foyers.
- Regularly review your cancellation policy against competitors and market demand shifts in Foyers.
Foyers STR Booking Lead Time Analysis (2026)
Average Booking Lead Time by Month
Booking Lead Time Insights for Foyers
- The overall average booking lead time for vacation rentals in Foyers is 92 days.
- Guests book furthest in advance for stays during October (average 146 days), likely coinciding with peak travel demand or local events.
- The shortest booking windows occur for stays in February (average 42 days), indicating more last-minute travel plans during this time.
- Seasonally, Fall (118 days avg.) sees the longest lead times, while Winter (70 days avg.) has the shortest, reflecting typical travel planning cycles.
Recommendations for Hosts
- Use the overall average lead time (92 days) as a baseline for your pricing and availability strategy in Foyers.
- For October stays, consider implementing length-of-stay discounts or slightly higher rates for bookings made less than 146 days out to capitalize on advance planning.
- Target marketing efforts for the Fall season well in advance (at least 118 days) to capture early planners.
- Monitor your own booking lead times against these Foyers averages to identify opportunities for dynamic pricing adjustments.
Popular & Essential Airbnb Amenities in Foyers (2026)
Amenity Prevalence
Amenity Insights for Foyers
- Essential amenities in Foyers that guests expect include: Wifi, Smoke alarm. Lacking these (any) could significantly impact bookings.
- Popular amenities like Bed linens, Heating, Free parking on premises are common but not universal. Offering these can provide a competitive edge.
Recommendations for Hosts
- Ensure your listing includes all essential amenities for Foyers: Wifi, Smoke alarm.
- Consider adding popular differentiators like Bed linens or Heating to increase appeal.
- Highlight unique or less common amenities you offer (e.g., hot tub, dedicated workspace, EV charger) in your listing description and photos.
- Regularly check competitor amenities in Foyers to stay competitive.
Foyers Airbnb Guest Demographics & Profile Analysis (2026)
Guest Profile Summary for Foyers
- The typical guest profile for Airbnb in Foyers consists of a mix of domestic (54%) and international guests, often arriving from nearby England, typically belonging to the Post-2000s (Gen Z/Alpha) group (50%), primarily speaking English or French.
- Domestic travelers account for 54.2% of guests.
- Key international markets include United Kingdom (54.2%) and United States (17.2%).
- Top languages spoken are English (56.2%) followed by French (13.8%).
- A significant demographic segment is the Post-2000s (Gen Z/Alpha) group, representing 50% of guests.
Recommendations for Hosts
- Balance marketing efforts between domestic and international channels based on the guest mix.
- Tailor amenities and listing descriptions to appeal to the dominant Post-2000s (Gen Z/Alpha) demographic (e.g., highlight fast WiFi, smart home features, local guides).
- Highlight unique local experiences or amenities relevant to the primary guest profile.
- Consider seasonal promotions aligned with peak travel times for key origin markets.
Nearby Short-Term Rental Market Comparison
How does the Foyers Airbnb market stack up against its neighbors? Compare key performance metrics like average monthly revenue, ADR, and occupancy rates in surrounding areas to understand the broader regional STR landscape.
| Market | Active Properties | Monthly Revenue | Daily Rate | Avg. Occupancy |
|---|---|---|---|---|
| Ardlui | 10 | $6,556 | $714.77 | 30% |
| Bridge of Cally | 18 | $6,245 | $629.64 | 46% |
| Larbert | 10 | $5,686 | $322.43 | 56% |
| Camuscross | 13 | $5,401 | $356.08 | 60% |
| Gartocharn | 16 | $5,313 | $437.25 | 47% |
| Acharn | 11 | $5,066 | $284.21 | 61% |
| Luss | 18 | $5,059 | $381.65 | 49% |
| Kirkhill | 10 | $4,909 | $727.25 | 43% |
| Arrochar | 34 | $4,898 | $344.76 | 53% |
| Fearnan | 22 | $4,850 | $439.88 | 41% |