Gardenstown Airbnb Market Analysis 2025: Short Term Rental Data & Vacation Rental Statistics in Scotland, United Kingdom
Is Airbnb profitable in Gardenstown in 2025? Explore comprehensive Airbnb analytics for Gardenstown, Scotland, United Kingdom to uncover income potential. This 2025 STR market report for Gardenstown, based on AirROI data from July 2024 to June 2025, reveals key trends in the niche market of 18 active listings.
Whether you're considering an Airbnb investment in Gardenstown, optimizing your existing vacation rental, or exploring rental arbitrage opportunities, understanding the Gardenstown Airbnb data is crucial. Leveraging the low regulation environment is key to maximizing your short term rental income potential. Let's dive into the specifics.
Key Gardenstown Airbnb Performance Metrics Overview
Monthly Airbnb Revenue Variations & Income Potential in Gardenstown (2025)
Understanding the monthly revenue variations for Airbnb listings in Gardenstown is key to maximizing your short term rental income potential. Seasonality significantly impacts earnings. Our analysis, based on data from the past 12 months, shows that the peak revenue month for STRs in Gardenstown is typically July, while March often presents the lowest earnings, highlighting opportunities for strategic pricing adjustments during shoulder and low seasons. Explore the typical Airbnb income in Gardenstown across different performance tiers:
- Best-in-class properties (Top 10%) achieve $3,781+ monthly, often utilizing dynamic pricing and superior guest experiences.
- Strong performing properties (Top 25%) earn $2,637 or more, indicating effective management and desirable locations/amenities.
- Typical properties (Median) generate around $1,713 per month, representing the average market performance.
- Entry-level properties (Bottom 25%) see earnings around $1,149, often with potential for optimization.
Average Monthly Airbnb Earnings Trend in Gardenstown
Gardenstown Airbnb Occupancy Rate Trends (2025)
Maximize your bookings by understanding the Gardenstown STR occupancy trends. Seasonal demand shifts significantly influence how often properties are booked. Typically, Augustsees the highest demand (peak season occupancy), while March experiences the lowest (low season). Effective strategies, like adjusting minimum stays or offering promotions, can boost occupancy during slower periods. Here's how different property tiers perform in Gardenstown:
- Best-in-class properties (Top 10%) achieve 71%+ occupancy, indicating high desirability and potentially optimized availability.
- Strong performing properties (Top 25%) maintain 56% or higher occupancy, suggesting good market fit and guest satisfaction.
- Typical properties (Median) have an occupancy rate around 38%.
- Entry-level properties (Bottom 25%) average 23% occupancy, potentially facing higher vacancy.
Average Monthly Occupancy Rate Trend in Gardenstown
Average Daily Rate (ADR) Airbnb Trends in Gardenstown (2025)
Effective short term rental pricing strategy in Gardenstown involves understanding monthly ADR fluctuations. The Average Daily Rate (ADR) for Airbnb in Gardenstown typically peaks in August and dips lowest during January. Leveraging Airbnb dynamic pricing tools or strategies based on this seasonality can significantly boost revenue. Here's a look at the typical nightly rates achieved:
- Best-in-class properties (Top 10%) command rates of $262+ per night, often due to premium features or locations.
- Strong performing properties (Top 25%) achieve nightly rates of $174 or more.
- Typical properties (Median) charge around $140 per night.
- Entry-level properties (Bottom 25%) earn around $114 per night.
Average Daily Rate (ADR) Trend by Month in Gardenstown
Get Live Gardenstown Market Intelligence 👇

Explore Real-time Analytics
Airbnb Seasonality Analysis & Trends in Gardenstown (2025)
Peak Season (July, August, September)
- Revenue averages $3,641 per month
- Occupancy rates average 64.4%
- Daily rates average $168
Shoulder Season
- Revenue averages $1,897 per month
- Occupancy maintains around 40.3%
- Daily rates hold near $155
Low Season (January, February, March)
- Revenue drops to average $936 per month
- Occupancy decreases to average 21.1%
- Daily rates adjust to average $152
Seasonality Insights for Gardenstown
- The Airbnb seasonality in Gardenstown shows highly seasonal trends requiring careful strategy. While the sections above show seasonal averages, it's also insightful to look at the extremes:
- During the high season, the absolute peak month showcases Gardenstown's highest earning potential, with monthly revenues capable of climbing to $4,256, occupancy reaching a high of 71.0%, and ADRs peaking at $175.
- Conversely, the slowest single month of the year, typically falling within the low season, marks the market's lowest point. In this month, revenue might dip to $481, occupancy could drop to 13.4%, and ADRs may adjust down to $146.
- Understanding both the seasonal averages and these monthly peaks and troughs in revenue, occupancy, and ADR is crucial for maximizing your Airbnb profit potential in Gardenstown.
Seasonal Strategies for Maximizing Profit
- Peak Season: Maximize revenue through premium pricing and potentially longer minimum stays. Ensure high availability.
- Low Season: Offer competitive pricing, special promotions (e.g., extended stay discounts), and flexible cancellation policies. Target off-season travelers like remote workers or budget-conscious guests.
- Shoulder Seasons: Implement dynamic pricing that balances peak and low rates. Target weekend travelers or specific events. Offer slightly more flexible terms than peak season.
- Regularly analyze your own performance against these Gardenstown seasonality benchmarks and adjust your pricing and availability strategy accordingly.
Best Areas for Airbnb Investment in Gardenstown (2025)
Exploring the top neighborhoods for short-term rentals in Gardenstown? This section highlights key areas, outlining why they are attractive for hosts and guests, along with notable local attractions. Consider these locations based on your target guest profile and investment strategy.
| Neighborhood / Area | Why Host Here? (Target Guests & Appeal) | Key Attractions & Landmarks |
|---|---|---|
| Gardenstown Harbour | A picturesque harbor area with stunning sea views, popular among tourists for relaxing and enjoying local seafood. It provides a charming seaside ambiance and easy access to coastal walks and activities. | Gardenstown Harbor, Fisherman's Path, Local seafood restaurants, Scenic coastal walks, Beach access |
| Gamrie Bay | Beautiful bay area known for its natural beauty and tranquil atmosphere. It's a great location for those seeking outdoor activities such as hiking and wildlife watching while enjoying coastal scenery. | Gamrie Bay beach, Wildlife watching, Hiking trails, Scenic viewpoints |
| Crovie | A quaint coastal village with traditional Scottish architecture and stunning views of the Moray Firth. It attracts visitors looking for a peaceful retreat and unique landscapes. | Crovie beach, Historic village charm, Local walking paths, Incredible coastal views |
| Banff | Nearby town with rich history and cultural sites, popular for those wanting to explore the Scottish coast. It offers a range of amenities and is close to various attractions. | Macduff Marine Aquarium, Banff Castle, Banff's coastal walks, Local shops and cafes |
| Troup Head | Famous for its seabird populations and dramatic cliffs, this area is ideal for nature lovers and those interested in photography and wildlife. A less commercialized spot that offers adventure and exploration. | Troup Head Nature Reserve, Seabird Watching, Cliff Walks, Stunning coastal views |
| Pennan | A charming village renowned for its iconic red phone box and scenic vistas. It appeals to film enthusiasts and tourists looking for classic Scottish coastal charm. | Pennan phone box, Seaside views, Local pubs, Film locations |
| Whitehills | A small fishing village with a friendly community and lovely harbor. Great for tourists who appreciate the slower pace of life and exploring local fishing culture. | Whitehills Harbor, Fishing activity, Local seafood, Walking trails along the coast |
| Macduff | Adjacent to Banff, Macduff offers amenities, attractions, and access to the coast. It serves as a convenient base for exploring the surrounding areas and is popular with families. | Macduff Marine Aquarium, Local shops, Coastal paths, Parks for families |
Understanding Airbnb License Requirements & STR Laws in Gardenstown (2025)
While Gardenstown, Scotland, United Kingdom currently shows low STR regulations, specific Airbnb license requirements might still exist or change. Always verify the latest short term rental regulations and Airbnb license requirements directly with local government authorities for Gardenstown to ensure full compliance before hosting.
(Source: AirROI data, 2025, based on 6% licensed listings)
Top Performing Airbnb Properties in Gardenstown (2025)
Benchmark your potential! Explore examples of top-performing Airbnb properties in Gardenstownbased on Trailing Twelve Month (TTM) revenue. Analyze their characteristics, revenue, occupancy rate, and ADR to understand what drives success in this market.
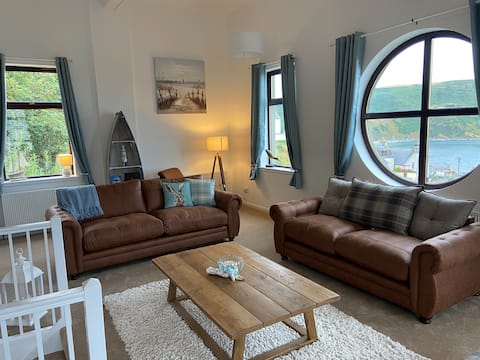
High Green Hall - converted church, sleeps 8
Entire Place • 4 bedrooms

Finest Retreats | Ellie-Jo Cottage
Entire Place • 2 bedrooms
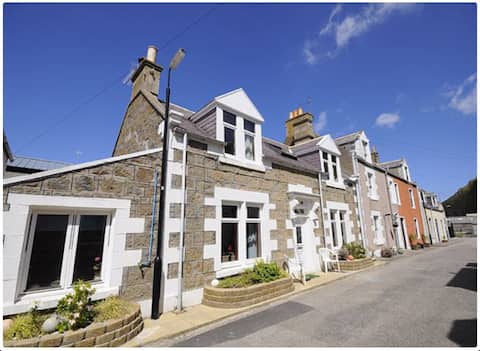
Pebles Cottage (number 3/pink door)
Entire Place • 2 bedrooms
Seahorse Cottage, Gardenstown
Entire Place • 2 bedrooms

The Conners - a modernised fisherman's cottage
Entire Place • 2 bedrooms

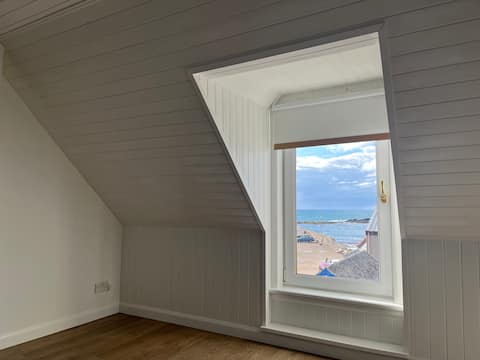
Stunning family apartment with superb sea views
Entire Place • 2 bedrooms
Note: Performance varies based on location, size, amenities, seasonality, and management quality. Data reflects the past 12 months.
Top Performing Airbnb Hosts in Gardenstown (2025)
Learn from the best! This table showcases top-performing Airbnb hosts in Gardenstown based on the number of properties managed and estimated total revenue over the past year. Analyze their scale and performance metrics.
| Host Name | Properties | Grossing Revenue | Stay Reviews | Avg Rating |
|---|---|---|---|---|
| Simon | 2 | $65,537 | 168 | 4.81/5.0 |
| Laura | 2 | $40,934 | 151 | 4.79/5.0 |
| Finest Retreats | 1 | $31,352 | 15 | 4.13/5.0 |
| Pamela | 1 | $24,760 | 92 | 4.79/5.0 |
| Jaco And Leial | 1 | $22,134 | 40 | 4.88/5.0 |
| Linda | 1 | $20,748 | 108 | 4.87/5.0 |
| Lisa | 1 | $20,395 | 166 | 4.78/5.0 |
| Georgina | 1 | $17,941 | 217 | 4.96/5.0 |
| Matthew | 1 | $15,237 | 45 | 5.00/5.0 |
| Claire | 1 | $14,407 | 24 | 4.79/5.0 |
Analyzing the strategies of top hosts, such as their property selection, pricing, and guest communication, can offer valuable lessons for optimizing your own Airbnb operations in Gardenstown.
Dive Deeper: Advanced Gardenstown STR Market Data (2025)
Ready to unlock more insights? AirROI provides access to advanced metrics and comprehensive Airbnb data for Gardenstown. Explore detailed analytics beyond this report to refine your investment strategy, optimize pricing, and maximize your vacation rental profits.
Explore Advanced MetricsGardenstown Short-Term Rental Market Composition (2025): Property & Room Types
Room Type Distribution
Property Type Distribution
Market Composition Insights for Gardenstown
- The Gardenstown Airbnb market composition is heavily skewed towards Entire Home/Apt listings, which make up 100% of the 18 active rentals. This indicates strong guest preference for privacy and space.
- Looking at the property type distribution in Gardenstown, House properties are the most common (83.3%), reflecting the local real estate landscape.
- Houses represent a significant 83.3% portion, catering likely to families or larger groups.
Gardenstown Airbnb Room Capacity Analysis (2025): Bedroom Distribution
Distribution of Listings by Number of Bedrooms
Room Capacity Insights for Gardenstown
- The dominant room capacity in Gardenstown is 2 bedrooms listings, making up 50% of the market. This suggests a strong demand for properties suitable for couples or solo travelers.
- Together, 2 bedrooms and 3 bedrooms properties represent 72.2% of the active Airbnb listings in Gardenstown, indicating a high concentration in these sizes.
- A significant 38.9% of listings offer 3+ bedrooms, catering to larger groups and families seeking more space in Gardenstown.
Gardenstown Vacation Rental Guest Capacity Trends (2025)
Distribution of Listings by Guest Capacity
Guest Capacity Insights for Gardenstown
- The most common guest capacity trend in Gardenstown vacation rentals is listings accommodating 4 guests (33.3%). This suggests the primary traveler segment is likely small families or groups.
- Properties designed for 4 guests and 5 guests dominate the Gardenstown STR market, accounting for 61.1% of listings.
- 33.4% of properties accommodate 6+ guests, serving the market segment for larger families or group travel in Gardenstown.
- On average, properties in Gardenstown are equipped to host 5.2 guests.
Gardenstown Airbnb Booking Patterns (2025): Available vs. Booked Days
Available Days Distribution
Booked Days Distribution
Booking Pattern Insights for Gardenstown
- The most common availability pattern in Gardenstown falls within the 181-270 days range, representing 55.6% of listings. This suggests many properties have significant open periods on their calendars.
- Approximately 94.5% of listings show high availability (181+ days open annually), indicating potential for increased bookings or specific owner usage patterns.
- For booked days, the 91-180 days range is most frequent in Gardenstown (61.1%), reflecting common guest stay durations or potential owner blocking patterns.
- A notable 5.6% of properties secure long booking periods (181+ days booked per year), highlighting successful long-term rental strategies or significant owner usage.
Gardenstown Airbnb Minimum Stay Requirements Analysis
Distribution of Listings by Minimum Night Requirement
1 Night
1 listings
6.3% of total
2 Nights
1 listings
6.3% of total
3 Nights
2 listings
12.5% of total
4-6 Nights
6 listings
37.5% of total
30+ Nights
6 listings
37.5% of total
Key Insights
- The most prevalent minimum stay requirement in Gardenstown is 4-6 Nights, adopted by 37.5% of listings. This highlights the market's preference for longer commitments.
- Very short stays (1-2 nights) are less common (12.6%), suggesting hosts prefer slightly longer bookings to optimize turnover.
- A significant segment (37.5%) caters to monthly stays (30+ nights) in Gardenstown, pointing to opportunities in the extended-stay market.
Recommendations
- Align with the market by considering a 4-6 Nights minimum stay, as 37.5% of Gardenstown hosts use this setting.
- If feasible, allowing 1-night stays, especially midweek or during low season, could capture last-minute bookings, as only 6.3% currently do.
- Explore offering discounts for stays of 30+ nights to attract the 37.5% of the market seeking extended stays.
- Adjust minimum nights based on seasonality – potentially shorter during low season and longer during peak demand periods in Gardenstown.
Gardenstown Airbnb Cancellation Policy Trends Analysis (2025)
Super Strict 60 Days
1 listings
5.6% of total
Flexible
4 listings
22.2% of total
Moderate
5 listings
27.8% of total
Firm
1 listings
5.6% of total
Strict
7 listings
38.9% of total
Cancellation Policy Insights for Gardenstown
- The prevailing Airbnb cancellation policy trend in Gardenstown is Strict, used by 38.9% of listings.
- There's a relatively balanced mix between guest-friendly (50.0%) and stricter (44.5%) policies, offering choices for different guest needs.
Recommendations for Hosts
- Consider adopting a Strict policy to align with the 38.9% market standard in Gardenstown.
- With 38.9% using Strict terms, this is a viable option in Gardenstown, particularly for high-value properties or during peak demand periods.
- Regularly review your cancellation policy against competitors and market demand shifts in Gardenstown.
Gardenstown STR Booking Lead Time Analysis (2025)
Average Booking Lead Time by Month
Booking Lead Time Insights for Gardenstown
- The overall average booking lead time for vacation rentals in Gardenstown is 75 days.
- Guests book furthest in advance for stays during July (average 108 days), likely coinciding with peak travel demand or local events.
- The shortest booking windows occur for stays in February (average 29 days), indicating more last-minute travel plans during this time.
- Seasonally, Fall (91 days avg.) sees the longest lead times, while Spring (70 days avg.) has the shortest, reflecting typical travel planning cycles.
Recommendations for Hosts
- Use the overall average lead time (75 days) as a baseline for your pricing and availability strategy in Gardenstown.
- For July stays, consider implementing length-of-stay discounts or slightly higher rates for bookings made less than 108 days out to capitalize on advance planning.
- Target marketing efforts for the Fall season well in advance (at least 91 days) to capture early planners.
- Monitor your own booking lead times against these Gardenstown averages to identify opportunities for dynamic pricing adjustments.
Popular & Essential Airbnb Amenities in Gardenstown (2025)
Amenity data is currently unavailable for Gardenstown.
Gardenstown Airbnb Guest Demographics & Profile Analysis (2025)
Guest Profile Summary for Gardenstown
- The typical guest profile for Airbnb in Gardenstown consists of primarily domestic travelers (74%), often arriving from nearby Edinburgh, typically belonging to the Post-2000s (Gen Z/Alpha) group (50%), primarily speaking English or French.
- Domestic travelers account for 73.5% of guests.
- Key international markets include United Kingdom (73.5%) and United States (10.2%).
- Top languages spoken are English (62.1%) followed by French (15.5%).
- A significant demographic segment is the Post-2000s (Gen Z/Alpha) group, representing 50% of guests.
Recommendations for Hosts
- Target domestic marketing efforts towards travelers from Edinburgh and England.
- Tailor amenities and listing descriptions to appeal to the dominant Post-2000s (Gen Z/Alpha) demographic (e.g., highlight fast WiFi, smart home features, local guides).
- Highlight unique local experiences or amenities relevant to the primary guest profile.
- Consider seasonal promotions aligned with peak travel times for key origin markets.
Nearby Short-Term Rental Market Comparison
How does the Gardenstown Airbnb market stack up against its neighbors? Compare key performance metrics like average monthly revenue, ADR, and occupancy rates in surrounding areas to understand the broader regional STR landscape.
| Market | Active Properties | Monthly Revenue | Daily Rate | Avg. Occupancy |
|---|---|---|---|---|
| Bridge of Cally | 16 | $5,348 | $607.39 | 47% |
| Insh | 13 | $4,951 | $271.67 | 61% |
| Auchtermuchty | 10 | $4,372 | $387.24 | 52% |
| Kenmore | 10 | $4,278 | $439.77 | 40% |
| Leuchars | 16 | $4,118 | $418.18 | 43% |
| Dulnain Bridge | 15 | $3,917 | $310.01 | 48% |
| Gullane | 27 | $3,749 | $290.24 | 53% |
| Gilmerton | 10 | $3,680 | $461.39 | 36% |
| Nethy Bridge | 52 | $3,622 | $259.31 | 51% |
| Culross | 12 | $3,620 | $226.35 | 54% |