Invergordon Airbnb Market Analysis 2026: Short Term Rental Data & Vacation Rental Statistics in Scotland, United Kingdom
Is Airbnb profitable in Invergordon in 2026? Explore comprehensive Airbnb analytics for Invergordon, Scotland, United Kingdom to uncover income potential. This 2026 STR market report for Invergordon, based on AirROI data from February 2025 to January 2026, reveals key trends in the niche market of 28 active listings.
Whether you're considering an Airbnb investment in Invergordon, optimizing your existing vacation rental, or exploring rental arbitrage opportunities, understanding the Invergordon Airbnb data is crucial. Understanding the local regulations is key to maximizing your short term rental income potential. Let's dive into the specifics.
Key Invergordon Airbnb Performance Metrics Overview
Monthly Airbnb Revenue Variations & Income Potential in Invergordon (2026)
Understanding the monthly revenue variations for Airbnb listings in Invergordon is key to maximizing your short term rental income potential. Seasonality significantly impacts earnings. Our analysis, based on data from the past 12 months, shows that the peak revenue month for STRs in Invergordon is typically August, while February often presents the lowest earnings, highlighting opportunities for strategic pricing adjustments during shoulder and low seasons. Explore the typical Airbnb income in Invergordon across different performance tiers:
- Best-in-class properties (Top 10%) achieve $3,412+ monthly, often utilizing dynamic pricing and superior guest experiences.
- Strong performing properties (Top 25%) earn $2,501 or more, indicating effective management and desirable locations/amenities.
- Typical properties (Median) generate around $1,133 per month, representing the average market performance.
- Entry-level properties (Bottom 25%) see earnings around $425, often with potential for optimization.
Average Monthly Airbnb Earnings Trend in Invergordon
Invergordon Airbnb Occupancy Rate Trends (2026)
Maximize your bookings by understanding the Invergordon STR occupancy trends. Seasonal demand shifts significantly influence how often properties are booked. Typically, Augustsees the highest demand (peak season occupancy), while January experiences the lowest (low season). Effective strategies, like adjusting minimum stays or offering promotions, can boost occupancy during slower periods. Here's how different property tiers perform in Invergordon:
- Best-in-class properties (Top 10%) achieve 76%+ occupancy, indicating high desirability and potentially optimized availability.
- Strong performing properties (Top 25%) maintain 54% or higher occupancy, suggesting good market fit and guest satisfaction.
- Typical properties (Median) have an occupancy rate around 28%.
- Entry-level properties (Bottom 25%) average 16% occupancy, potentially facing higher vacancy.
Average Monthly Occupancy Rate Trend in Invergordon
Average Daily Rate (ADR) Airbnb Trends in Invergordon (2026)
Effective short term rental pricing strategy in Invergordon involves understanding monthly ADR fluctuations. The Average Daily Rate (ADR) for Airbnb in Invergordon typically peaks in August and dips lowest during February. Leveraging Airbnb dynamic pricing tools or strategies based on this seasonality can significantly boost revenue. Here's a look at the typical nightly rates achieved:
- Best-in-class properties (Top 10%) command rates of $184+ per night, often due to premium features or locations.
- Strong performing properties (Top 25%) achieve nightly rates of $148 or more.
- Typical properties (Median) charge around $116 per night.
- Entry-level properties (Bottom 25%) earn around $60 per night.
Average Daily Rate (ADR) Trend by Month in Invergordon
Get Live Invergordon Market Intelligence 👇

Explore Real-time Analytics
Airbnb Seasonality Analysis & Trends in Invergordon (2026)
Peak Season (August, July, October)
- Revenue averages $2,292 per month
- Occupancy rates average 50.5%
- Daily rates average $119
Shoulder Season
- Revenue averages $1,490 per month
- Occupancy maintains around 36.7%
- Daily rates hold near $113
Low Season (January, February, May)
- Revenue drops to average $955 per month
- Occupancy decreases to average 26.7%
- Daily rates adjust to average $113
Seasonality Insights for Invergordon
- The Airbnb seasonality in Invergordon shows highly seasonal trends requiring careful strategy. While the sections above show seasonal averages, it's also insightful to look at the extremes:
- During the high season, the absolute peak month showcases Invergordon's highest earning potential, with monthly revenues capable of climbing to $2,762, occupancy reaching a high of 61.7%, and ADRs peaking at $123.
- Conversely, the slowest single month of the year, typically falling within the low season, marks the market's lowest point. In this month, revenue might dip to $796, occupancy could drop to 24.7%, and ADRs may adjust down to $109.
- Understanding both the seasonal averages and these monthly peaks and troughs in revenue, occupancy, and ADR is crucial for maximizing your Airbnb profit potential in Invergordon.
Seasonal Strategies for Maximizing Profit
- Peak Season: Maximize revenue through premium pricing and potentially longer minimum stays. Ensure high availability.
- Low Season: Offer competitive pricing, special promotions (e.g., extended stay discounts), and flexible cancellation policies. Target off-season travelers like remote workers or budget-conscious guests.
- Shoulder Seasons: Implement dynamic pricing that balances peak and low rates. Target weekend travelers or specific events. Offer slightly more flexible terms than peak season.
- Regularly analyze your own performance against these Invergordon seasonality benchmarks and adjust your pricing and availability strategy accordingly.
Best Areas for Airbnb Investment in Invergordon (2026)
Exploring the top neighborhoods for short-term rentals in Invergordon? This section highlights key areas, outlining why they are attractive for hosts and guests, along with notable local attractions. Consider these locations based on your target guest profile and investment strategy.
| Neighborhood / Area | Why Host Here? (Target Guests & Appeal) | Key Attractions & Landmarks |
|---|---|---|
| Invergordon Town Centre | The town centre is bustling with local shops, eateries, and bars, making it a convenient spot for visitors. It serves as a hub for exploration of the surrounding Highlands. | Invergordon's Coastal Walks, Local Historic Sites, Nearby Cromarty Firth, Dining Options, Shops and Cafes |
| Cromarty Firth | This area is known for its stunning waterside views, and it's a hotspot for tourists interested in nature walks and marine life, including dolphin watching. | Dolphin Watching Tours, Stunning Views, Nature Trails, Fishing Opportunities, Beaches |
| Dornoch | A picturesque town just a short drive away, Dornoch is famous for its beautiful sandy beach and historic sites, attracting more visitors to the region. | Dornoch Cathedral, Dornoch Beach, Royal Dornoch Golf Club, Local Shops, Dining Venues |
| Alness | Nearby Alness offers a charming small-town feel with local amenities, parks, and access to Loch Ness and other Highland attractions. | Local Parks, Loch Ness Nearby, Community Events, Walking Trails, Local Cafes |
| Evanton | A small village that serves as a quiet retreat for those visiting nearby attractions, offering a true taste of Highland life. | Nature Walks, Local History, Community Activities, Scenic Views, Relaxed Atmosphere |
| Tain | Tain is one of the oldest towns in Scotland, rich in history and culture, drawing visitors to its heritage sites and local whisky distilleries. | Tain Through Time Museum, Local Distilleries, Historic Buildings, Gardens and Parks, Arts and Crafts Shops |
| Nigg | Nigg offers beautiful coastal views and is close to the Nigg Ferry, providing easy access to other attractions across the water, ideal for day trips. | Coastal Paths, Nigg Ferry, Scenic Views, Local Wildlife, Quiet Beaches |
| Fearn | A quiet rural area close to the Black Isle, Fearn appeals to those looking for a peaceful getaway with great access to the Highlands and local attractions. | Rural Scenery, Hiking Trails, Local farms, Cultural Experiences, Historic Sites |
Understanding Airbnb License Requirements & STR Laws in Invergordon (2026)
With 11% of listings showing registration in 2026, understanding potential Airbnb license requirements is crucial in Invergordon. Always verify the latest short term rental regulations and Airbnb license requirements directly with local government authorities for Invergordon to ensure full compliance before hosting.
(Source: AirROI data, 2026, based on 11% licensed listings)
Top Performing Airbnb Properties in Invergordon (2026)
Benchmark your potential! Explore examples of top-performing Airbnb properties in Invergordonbased on Trailing Twelve Month (TTM) revenue. Analyze their characteristics, revenue, occupancy rate, and ADR to understand what drives success in this market.
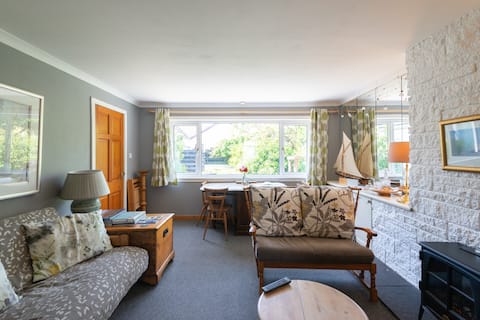
Seaside house in Highlands.
Entire Place • 2 bedrooms
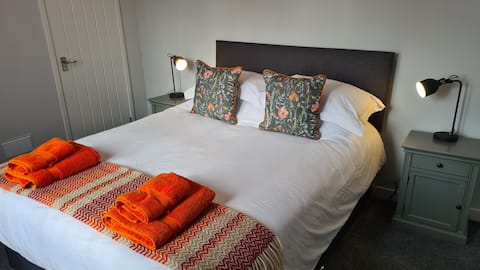
Invergordon Family Home
Entire Place • 3 bedrooms

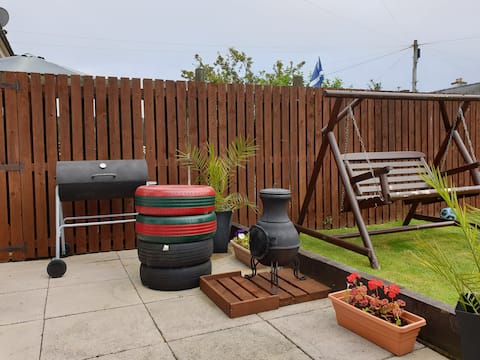
Stunning sea view at Saltburn, Invergordon
Entire Place • 3 bedrooms

Smiddy Pod Invergordon IV180PL
Entire Place • 1 bedroom

Contemporary Highland Cottage
Entire Place • 2 bedrooms
Comfortable home from home
Entire Place • 3 bedrooms
Note: Performance varies based on location, size, amenities, seasonality, and management quality. Data reflects the past 12 months.
Top Performing Airbnb Hosts in Invergordon (2026)
Learn from the best! This table showcases top-performing Airbnb hosts in Invergordon based on the number of properties managed and estimated total revenue over the past year. Analyze their scale and performance metrics.
| Host Name | Properties | Grossing Revenue | Stay Reviews | Avg Rating |
|---|---|---|---|---|
| Carolyn | 2 | $37,166 | 33 | 4.90/5.0 |
| Sonny | 1 | $34,499 | 312 | 4.88/5.0 |
| Noreen | 1 | $32,065 | 132 | 4.92/5.0 |
| Donald | 4 | $29,832 | 53 | 4.50/5.0 |
| Shirley | 1 | $28,493 | 111 | 4.98/5.0 |
| Kelly | 1 | $25,632 | 24 | 4.92/5.0 |
| Ernst | 11 | $25,112 | 74 | 4.75/5.0 |
| Sheila | 1 | $20,280 | 143 | 4.97/5.0 |
| Wils | 1 | $12,400 | 22 | 4.95/5.0 |
| Neil | 1 | $8,982 | 11 | 5.00/5.0 |
Analyzing the strategies of top hosts, such as their property selection, pricing, and guest communication, can offer valuable lessons for optimizing your own Airbnb operations in Invergordon.
Dive Deeper: Advanced Invergordon STR Market Data (2026)
Ready to unlock more insights? AirROI provides access to advanced metrics and comprehensive Airbnb data for Invergordon. Explore detailed analytics beyond this report to refine your investment strategy, optimize pricing, and maximize your vacation rental profits.
Explore Advanced MetricsInvergordon Short-Term Rental Market Composition (2026): Property & Room Types
Room Type Distribution
Property Type Distribution
Market Composition Insights for Invergordon
- The Invergordon Airbnb market composition is heavily skewed towards Private Room listings, which make up 53.6% of the 28 active rentals. This indicates strong guest preference for privacy and space.
- Looking at the property type distribution in Invergordon, House properties are the most common (53.6%), reflecting the local real estate landscape.
- Houses represent a significant 53.6% portion, catering likely to families or larger groups.
- The presence of 21.4% Hotel/Boutique listings indicates integration with traditional hospitality.
Invergordon Airbnb Room Capacity Analysis (2026): Bedroom Distribution
Distribution of Listings by Number of Bedrooms
Room Capacity Insights for Invergordon
- The dominant room capacity in Invergordon is 1 bedroom listings, making up 42.9% of the market. This suggests a strong demand for properties suitable for couples or solo travelers.
- Together, 1 bedroom and 2 bedrooms properties represent 57.2% of the active Airbnb listings in Invergordon, indicating a high concentration in these sizes.
Invergordon Vacation Rental Guest Capacity Trends (2026)
Distribution of Listings by Guest Capacity
Guest Capacity Insights for Invergordon
- The most common guest capacity trend in Invergordon vacation rentals is listings accommodating 2 guests (35.7%). This suggests the primary traveler segment is likely couples or solo travelers.
- Properties designed for 2 guests and 5 guests dominate the Invergordon STR market, accounting for 42.8% of listings.
- 10.7% of properties accommodate 6+ guests, serving the market segment for larger families or group travel in Invergordon.
- On average, properties in Invergordon are equipped to host 2.3 guests.
Invergordon Airbnb Booking Patterns (2026): Available vs. Booked Days
Available Days Distribution
Booked Days Distribution
Booking Pattern Insights for Invergordon
- The most common availability pattern in Invergordon falls within the 271-366 days range, representing 75% of listings. This suggests many properties have significant open periods on their calendars.
- Approximately 85.7% of listings show high availability (181+ days open annually), indicating potential for increased bookings or specific owner usage patterns.
- For booked days, the 31-90 days range is most frequent in Invergordon (53.6%), reflecting common guest stay durations or potential owner blocking patterns.
- A notable 14.3% of properties secure long booking periods (181+ days booked per year), highlighting successful long-term rental strategies or significant owner usage.
Invergordon Airbnb Minimum Stay Requirements Analysis
Distribution of Listings by Minimum Night Requirement
1 Night
5 listings
17.9% of total
2 Nights
4 listings
14.3% of total
3 Nights
9 listings
32.1% of total
4-6 Nights
3 listings
10.7% of total
7-29 Nights
1 listings
3.6% of total
30+ Nights
6 listings
21.4% of total
Key Insights
- The most prevalent minimum stay requirement in Invergordon is 3 Nights, adopted by 32.1% of listings. This highlights the market's preference for longer commitments.
- A significant segment (21.4%) caters to monthly stays (30+ nights) in Invergordon, pointing to opportunities in the extended-stay market.
Recommendations
- Align with the market by considering a 3 Nights minimum stay, as 32.1% of Invergordon hosts use this setting.
- If feasible, allowing 1-night stays, especially midweek or during low season, could capture last-minute bookings, as only 17.9% currently do.
- Explore offering discounts for stays of 30+ nights to attract the 21.4% of the market seeking extended stays.
- Adjust minimum nights based on seasonality – potentially shorter during low season and longer during peak demand periods in Invergordon.
Invergordon Airbnb Cancellation Policy Trends Analysis (2026)
Flexible
12 listings
44.4% of total
Moderate
3 listings
11.1% of total
Firm
3 listings
11.1% of total
Strict
9 listings
33.3% of total
Cancellation Policy Insights for Invergordon
- The prevailing Airbnb cancellation policy trend in Invergordon is Flexible, used by 44.4% of listings.
- There's a relatively balanced mix between guest-friendly (55.5%) and stricter (44.4%) policies, offering choices for different guest needs.
Recommendations for Hosts
- Consider adopting a Flexible policy to align with the 44.4% market standard in Invergordon.
- With 33.3% using Strict terms, this is a viable option in Invergordon, particularly for high-value properties or during peak demand periods.
- Regularly review your cancellation policy against competitors and market demand shifts in Invergordon.
Invergordon STR Booking Lead Time Analysis (2026)
Average Booking Lead Time by Month
Booking Lead Time Insights for Invergordon
- The overall average booking lead time for vacation rentals in Invergordon is 50 days.
- Guests book furthest in advance for stays during December (average 159 days), likely coinciding with peak travel demand or local events.
- The shortest booking windows occur for stays in February (average 12 days), indicating more last-minute travel plans during this time.
- Seasonally, Summer (72 days avg.) sees the longest lead times, while Spring (34 days avg.) has the shortest, reflecting typical travel planning cycles.
Recommendations for Hosts
- Use the overall average lead time (50 days) as a baseline for your pricing and availability strategy in Invergordon.
- For December stays, consider implementing length-of-stay discounts or slightly higher rates for bookings made less than 159 days out to capitalize on advance planning.
- During February, focus on last-minute booking availability and promotions, as guests book with very short notice (12 days avg.).
- Target marketing efforts for the Summer season well in advance (at least 72 days) to capture early planners.
- Monitor your own booking lead times against these Invergordon averages to identify opportunities for dynamic pricing adjustments.
Popular & Essential Airbnb Amenities in Invergordon (2026)
Amenity Prevalence
Amenity Insights for Invergordon
- Essential amenities in Invergordon that guests expect include: Wifi, TV, Smoke alarm, Heating. Lacking these (any) could significantly impact bookings.
- Popular amenities like Hot water, Free parking on premises, Essentials are common but not universal. Offering these can provide a competitive edge.
Recommendations for Hosts
- Ensure your listing includes all essential amenities for Invergordon: Wifi, TV, Smoke alarm, Heating.
- Consider adding popular differentiators like Hot water or Free parking on premises to increase appeal.
- Highlight unique or less common amenities you offer (e.g., hot tub, dedicated workspace, EV charger) in your listing description and photos.
- Regularly check competitor amenities in Invergordon to stay competitive.
Invergordon Airbnb Guest Demographics & Profile Analysis (2026)
Guest Profile Summary for Invergordon
- The typical guest profile for Airbnb in Invergordon consists of a mix of domestic (56%) and international guests, often arriving from nearby England, typically belonging to the Post-2000s (Gen Z/Alpha) group (50%), primarily speaking English or French.
- Domestic travelers account for 55.6% of guests.
- Key international markets include United Kingdom (55.6%) and United States (13.3%).
- Top languages spoken are English (52.2%) followed by French (11.9%).
- A significant demographic segment is the Post-2000s (Gen Z/Alpha) group, representing 50% of guests.
Recommendations for Hosts
- Balance marketing efforts between domestic and international channels based on the guest mix.
- Tailor amenities and listing descriptions to appeal to the dominant Post-2000s (Gen Z/Alpha) demographic (e.g., highlight fast WiFi, smart home features, local guides).
- Highlight unique local experiences or amenities relevant to the primary guest profile.
- Consider seasonal promotions aligned with peak travel times for key origin markets.
Nearby Short-Term Rental Market Comparison
How does the Invergordon Airbnb market stack up against its neighbors? Compare key performance metrics like average monthly revenue, ADR, and occupancy rates in surrounding areas to understand the broader regional STR landscape.
| Market | Active Properties | Monthly Revenue | Daily Rate | Avg. Occupancy |
|---|---|---|---|---|
| Ardlui | 10 | $6,556 | $714.77 | 30% |
| Bridge of Cally | 18 | $6,245 | $629.64 | 46% |
| Foyers | 18 | $5,824 | $354.91 | 57% |
| Larbert | 10 | $5,686 | $322.43 | 56% |
| Camuscross | 13 | $5,401 | $356.08 | 60% |
| Gartocharn | 16 | $5,313 | $437.25 | 47% |
| Acharn | 11 | $5,066 | $284.21 | 61% |
| Luss | 18 | $5,059 | $381.65 | 49% |
| Kirkhill | 10 | $4,909 | $727.25 | 43% |
| Arrochar | 34 | $4,898 | $344.76 | 53% |