St Fillans Airbnb Market Analysis 2026: Short Term Rental Data & Vacation Rental Statistics in Scotland, United Kingdom
Is Airbnb profitable in St Fillans in 2026? Explore comprehensive Airbnb analytics for St Fillans, Scotland, United Kingdom to uncover income potential. This 2026 STR market report for St Fillans, based on AirROI data from February 2025 to January 2026, reveals key trends in the niche market of 19 active listings.
Whether you're considering an Airbnb investment in St Fillans, optimizing your existing vacation rental, or exploring rental arbitrage opportunities, understanding the St Fillans Airbnb data is crucial. Navigating the high regulation landscape is key to maximizing your short term rental income potential. Let's dive into the specifics.
Key St Fillans Airbnb Performance Metrics Overview
Monthly Airbnb Revenue Variations & Income Potential in St Fillans (2026)
Understanding the monthly revenue variations for Airbnb listings in St Fillans is key to maximizing your short term rental income potential. Seasonality significantly impacts earnings. Our analysis, based on data from the past 12 months, shows that the peak revenue month for STRs in St Fillans is typically August, while January often presents the lowest earnings, highlighting opportunities for strategic pricing adjustments during shoulder and low seasons. Explore the typical Airbnb income in St Fillans across different performance tiers:
- Best-in-class properties (Top 10%) achieve $8,222+ monthly, often utilizing dynamic pricing and superior guest experiences.
- Strong performing properties (Top 25%) earn $5,960 or more, indicating effective management and desirable locations/amenities.
- Typical properties (Median) generate around $3,870 per month, representing the average market performance.
- Entry-level properties (Bottom 25%) see earnings around $2,339, often with potential for optimization.
Average Monthly Airbnb Earnings Trend in St Fillans
St Fillans Airbnb Occupancy Rate Trends (2026)
Maximize your bookings by understanding the St Fillans STR occupancy trends. Seasonal demand shifts significantly influence how often properties are booked. Typically, Octobersees the highest demand (peak season occupancy), while January experiences the lowest (low season). Effective strategies, like adjusting minimum stays or offering promotions, can boost occupancy during slower periods. Here's how different property tiers perform in St Fillans:
- Best-in-class properties (Top 10%) achieve 87%+ occupancy, indicating high desirability and potentially optimized availability.
- Strong performing properties (Top 25%) maintain 80% or higher occupancy, suggesting good market fit and guest satisfaction.
- Typical properties (Median) have an occupancy rate around 57%.
- Entry-level properties (Bottom 25%) average 27% occupancy, potentially facing higher vacancy.
Average Monthly Occupancy Rate Trend in St Fillans
Average Daily Rate (ADR) Airbnb Trends in St Fillans (2026)
Effective short term rental pricing strategy in St Fillans involves understanding monthly ADR fluctuations. The Average Daily Rate (ADR) for Airbnb in St Fillans typically peaks in January and dips lowest during May. Leveraging Airbnb dynamic pricing tools or strategies based on this seasonality can significantly boost revenue. Here's a look at the typical nightly rates achieved:
- Best-in-class properties (Top 10%) command rates of $609+ per night, often due to premium features or locations.
- Strong performing properties (Top 25%) achieve nightly rates of $435 or more.
- Typical properties (Median) charge around $231 per night.
- Entry-level properties (Bottom 25%) earn around $184 per night.
Average Daily Rate (ADR) Trend by Month in St Fillans
Get Live St Fillans Market Intelligence 👇
Explore Real-time Analytics
Airbnb Seasonality Analysis & Trends in St Fillans (2026)
Peak Season (August, October, July)
- Revenue averages $5,462 per month
- Occupancy rates average 64.7%
- Daily rates average $335
Shoulder Season
- Revenue averages $4,769 per month
- Occupancy maintains around 54.4%
- Daily rates hold near $333
Low Season (January, November, December)
- Revenue drops to average $3,369 per month
- Occupancy decreases to average 44.4%
- Daily rates adjust to average $350
Seasonality Insights for St Fillans
- The Airbnb seasonality in St Fillans shows moderate seasonality with distinct peak and low periods. While the sections above show seasonal averages, it's also insightful to look at the extremes:
- During the high season, the absolute peak month showcases St Fillans's highest earning potential, with monthly revenues capable of climbing to $5,848, occupancy reaching a high of 67.5%, and ADRs peaking at $351.
- Conversely, the slowest single month of the year, typically falling within the low season, marks the market's lowest point. In this month, revenue might dip to $3,136, occupancy could drop to 36.6%, and ADRs may adjust down to $325.
- Understanding both the seasonal averages and these monthly peaks and troughs in revenue, occupancy, and ADR is crucial for maximizing your Airbnb profit potential in St Fillans.
Seasonal Strategies for Maximizing Profit
- Peak Season: Maximize revenue through premium pricing and potentially longer minimum stays. Ensure high availability.
- Low Season: Offer competitive pricing, special promotions (e.g., extended stay discounts), and flexible cancellation policies. Target off-season travelers like remote workers or budget-conscious guests.
- Shoulder Seasons: Implement dynamic pricing that balances peak and low rates. Target weekend travelers or specific events. Offer slightly more flexible terms than peak season.
- Regularly analyze your own performance against these St Fillans seasonality benchmarks and adjust your pricing and availability strategy accordingly.
Best Areas for Airbnb Investment in St Fillans (2026)
Exploring the top neighborhoods for short-term rentals in St Fillans? This section highlights key areas, outlining why they are attractive for hosts and guests, along with notable local attractions. Consider these locations based on your target guest profile and investment strategy.
| Neighborhood / Area | Why Host Here? (Target Guests & Appeal) | Key Attractions & Landmarks |
|---|---|---|
| Loch Earn | A stunning freshwater loch surrounded by mountains, offering activities such as fishing, boating, and hiking. Very popular with tourists seeking outdoor adventures and relaxation. | Loch Earn, Fishing, Boating, Hiking Trails, Local Pubs |
| St Fillans Village | A picturesque village known for its charming cottages and scenic views. Ideal for tourists looking for a quaint, peaceful retreat. | St Fillans Village, Historic Church, Local Shops, Scenic Views |
| The Trossachs National Park | A vast area of natural beauty with mountains, woods, and lochs. Perfect for nature lovers and outdoor enthusiasts. | Ben Vorlich, Loch Lomond, Hiking Trails, Scenic Drives, Wildlife Watching |
| Aberfeldy | A nearby town that offers a mix of historical sites and modern amenities, making it an appealing option for visitors. | Black Watch Castle, Falls of Acharn, Highland Safaris, Birnam Arts |
| Crieff | Known for its stunning landscapes and historic buildings, Crieff is a popular spot for tourists exploring Perthshire. | Crieff Hydro, Glen Turret Distillery, Macrosty Park, Historical Sites |
| Balquhidder | Famous for its ties to Rob Roy and stunning scenery. Appeals to history buffs and nature lovers alike. | Rob Roy's Grave, Balquhidder Church, Walking Trails, Scenic Views |
| Doune | Home to the famous Doune Castle, this area attracts history enthusiasts and tourists interested in Scottish heritage. | Doune Castle, Stirling River, Local Distilleries |
| Perth | A larger city with ample shopping, dining, and cultural experiences. Serves as a gateway for visitors exploring the wider region. | Perth Museum and Art Gallery, Scone Palace, Riverside Walks, Shopping Areas |
Understanding Airbnb License Requirements & STR Laws in St Fillans (2026)
Yes, St Fillans, Scotland, United Kingdom enforces high STR regulations. Obtaining a license and ensuring compliance is almost certainly required according to current 2026 STR laws. Always verify the latest short term rental regulations and Airbnb license requirements directly with local government authorities for St Fillans to ensure full compliance before hosting.
(Source: AirROI data, 2026, based on 37% licensed listings)
Top Performing Airbnb Properties in St Fillans (2026)
Benchmark your potential! Explore examples of top-performing Airbnb properties in St Fillansbased on Trailing Twelve Month (TTM) revenue. Analyze their characteristics, revenue, occupancy rate, and ADR to understand what drives success in this market.
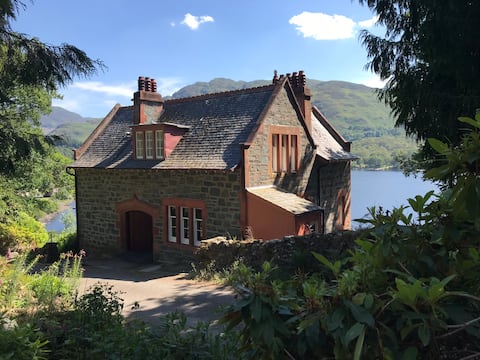
Beautiful period home on loch, wonderful views
Entire Place • 3 bedrooms
Cherrybrae Cottage
Entire Place • 1 bedroom
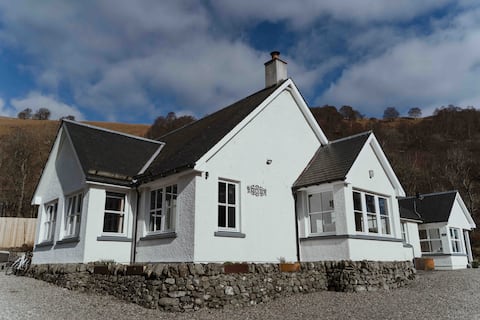
Bright, spacious house with panoramic views
Entire Place • 2 bedrooms
The Lodge at Achray House
Entire Place • 1 bedroom

5 Bed in St. Fillans (oc-t30058)
Entire Place • 5 bedrooms
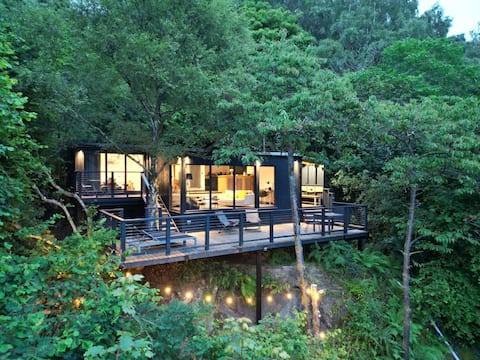
Caban Dubh - dreamy hideaway in Perthshire
Entire Place • 1 bedroom
Note: Performance varies based on location, size, amenities, seasonality, and management quality. Data reflects the past 12 months.
Top Performing Airbnb Hosts in St Fillans (2026)
Learn from the best! This table showcases top-performing Airbnb hosts in St Fillans based on the number of properties managed and estimated total revenue over the past year. Analyze their scale and performance metrics.
| Host Name | Properties | Grossing Revenue | Stay Reviews | Avg Rating |
|---|---|---|---|---|
| Lorna | 3 | $165,740 | 824 | 4.96/5.0 |
| Cottages | 3 | $136,394 | 21 | 4.93/5.0 |
| Duncan | 1 | $105,367 | 162 | 4.99/5.0 |
| Alastair | 1 | $94,405 | 135 | 5.00/5.0 |
| Laura | 2 | $67,464 | 111 | 4.74/5.0 |
| Holidaycottages-Co-Uk | 1 | $60,556 | 1 | Not Rated |
| Grant | 2 | $51,420 | 24 | 4.93/5.0 |
| Pamela | 2 | $45,828 | 701 | 4.97/5.0 |
| Catrina | 1 | $38,770 | 79 | 4.87/5.0 |
| Sean | 1 | $35,963 | 183 | 4.96/5.0 |
Analyzing the strategies of top hosts, such as their property selection, pricing, and guest communication, can offer valuable lessons for optimizing your own Airbnb operations in St Fillans.
Dive Deeper: Advanced St Fillans STR Market Data (2026)
Ready to unlock more insights? AirROI provides access to advanced metrics and comprehensive Airbnb data for St Fillans. Explore detailed analytics beyond this report to refine your investment strategy, optimize pricing, and maximize your vacation rental profits.
Explore Advanced MetricsSt Fillans Short-Term Rental Market Composition (2026): Property & Room Types
Room Type Distribution
Property Type Distribution
Market Composition Insights for St Fillans
- The St Fillans Airbnb market composition is heavily skewed towards Entire Home/Apt listings, which make up 94.7% of the 19 active rentals. This indicates strong guest preference for privacy and space.
- Looking at the property type distribution in St Fillans, House properties are the most common (84.2%), reflecting the local real estate landscape.
- Houses represent a significant 84.2% portion, catering likely to families or larger groups.
- The presence of 15.8% Hotel/Boutique listings indicates integration with traditional hospitality.
St Fillans Airbnb Room Capacity Analysis (2026): Bedroom Distribution
Distribution of Listings by Number of Bedrooms
Room Capacity Insights for St Fillans
- The dominant room capacity in St Fillans is 1 bedroom listings, making up 47.4% of the market. This suggests a strong demand for properties suitable for couples or solo travelers.
- Together, 1 bedroom and 3 bedrooms properties represent 68.5% of the active Airbnb listings in St Fillans, indicating a high concentration in these sizes.
- A significant 31.7% of listings offer 3+ bedrooms, catering to larger groups and families seeking more space in St Fillans.
St Fillans Vacation Rental Guest Capacity Trends (2026)
Distribution of Listings by Guest Capacity
Guest Capacity Insights for St Fillans
- The most common guest capacity trend in St Fillans vacation rentals is listings accommodating 2 guests (47.4%). This suggests the primary traveler segment is likely couples or solo travelers.
- Properties designed for 2 guests and 8+ guests dominate the St Fillans STR market, accounting for 63.2% of listings.
- A significant 47.4% of listings cater specifically to 1-2 guests, highlighting strong demand from couples and solo travelers in St Fillans.
- 36.9% of properties accommodate 6+ guests, serving the market segment for larger families or group travel in St Fillans.
- On average, properties in St Fillans are equipped to host 4.2 guests.
St Fillans Airbnb Booking Patterns (2026): Available vs. Booked Days
Available Days Distribution
Booked Days Distribution
Booking Pattern Insights for St Fillans
- The most common availability pattern in St Fillans falls within the 271-366 days range, representing 31.6% of listings. This suggests many properties have significant open periods on their calendars.
- Approximately 52.7% of listings show high availability (181+ days open annually), indicating potential for increased bookings or specific owner usage patterns.
- For booked days, the 271-366 days range is most frequent in St Fillans (26.3%), reflecting common guest stay durations or potential owner blocking patterns.
- A notable 47.4% of properties secure long booking periods (181+ days booked per year), highlighting successful long-term rental strategies or significant owner usage.
St Fillans Airbnb Minimum Stay Requirements Analysis
Distribution of Listings by Minimum Night Requirement
1 Night
7 listings
36.8% of total
2 Nights
1 listings
5.3% of total
3 Nights
3 listings
15.8% of total
30+ Nights
8 listings
42.1% of total
Key Insights
- The most prevalent minimum stay requirement in St Fillans is 30+ Nights, adopted by 42.1% of listings. This highlights the market's preference for longer commitments.
- A significant segment (42.1%) caters to monthly stays (30+ nights) in St Fillans, pointing to opportunities in the extended-stay market.
Recommendations
- Align with the market by considering a 30+ Nights minimum stay, as 42.1% of St Fillans hosts use this setting.
- Explore offering discounts for stays of 30+ nights to attract the 42.1% of the market seeking extended stays.
- Adjust minimum nights based on seasonality – potentially shorter during low season and longer during peak demand periods in St Fillans.
St Fillans Airbnb Cancellation Policy Trends Analysis (2026)
Limited
2 listings
10.5% of total
Super Strict 30 Days
2 listings
10.5% of total
Super Strict 60 Days
6 listings
31.6% of total
Flexible
4 listings
21.1% of total
Moderate
2 listings
10.5% of total
Firm
2 listings
10.5% of total
Strict
1 listings
5.3% of total
Cancellation Policy Insights for St Fillans
- The prevailing Airbnb cancellation policy trend in St Fillans is Super Strict 60 Days, used by 31.6% of listings.
- There's a relatively balanced mix between guest-friendly (31.6%) and stricter (15.8%) policies, offering choices for different guest needs.
- Strict cancellation policies are quite rare (5.3%), potentially making listings with this policy less competitive unless justified by high demand or property type.
Recommendations for Hosts
- Consider adopting a Super Strict 60 Days policy to align with the 31.6% market standard in St Fillans.
- Using a Strict policy might deter some guests, as only 5.3% of listings use it. Evaluate if potential revenue protection outweighs possible lower booking rates.
- Regularly review your cancellation policy against competitors and market demand shifts in St Fillans.
St Fillans STR Booking Lead Time Analysis (2026)
Average Booking Lead Time by Month
Booking Lead Time Insights for St Fillans
- The overall average booking lead time for vacation rentals in St Fillans is 80 days.
- Guests book furthest in advance for stays during May (average 130 days), likely coinciding with peak travel demand or local events.
- The shortest booking windows occur for stays in March (average 28 days), indicating more last-minute travel plans during this time.
- Seasonally, Summer (84 days avg.) sees the longest lead times, while Winter (51 days avg.) has the shortest, reflecting typical travel planning cycles.
Recommendations for Hosts
- Use the overall average lead time (80 days) as a baseline for your pricing and availability strategy in St Fillans.
- For May stays, consider implementing length-of-stay discounts or slightly higher rates for bookings made less than 130 days out to capitalize on advance planning.
- Target marketing efforts for the Summer season well in advance (at least 84 days) to capture early planners.
- Monitor your own booking lead times against these St Fillans averages to identify opportunities for dynamic pricing adjustments.
Popular & Essential Airbnb Amenities in St Fillans (2026)
Amenity Prevalence
Amenity Insights for St Fillans
- Essential amenities in St Fillans that guests expect include: Heating, Wifi. Lacking these (any) could significantly impact bookings.
- Popular amenities like TV, Free parking on premises, Fire extinguisher are common but not universal. Offering these can provide a competitive edge.
Recommendations for Hosts
- Ensure your listing includes all essential amenities for St Fillans: Heating, Wifi.
- Consider adding popular differentiators like TV or Free parking on premises to increase appeal.
- Highlight unique or less common amenities you offer (e.g., hot tub, dedicated workspace, EV charger) in your listing description and photos.
- Regularly check competitor amenities in St Fillans to stay competitive.
St Fillans Airbnb Guest Demographics & Profile Analysis (2026)
Guest Profile Summary for St Fillans
- The typical guest profile for Airbnb in St Fillans consists of primarily domestic travelers (75%), often arriving from nearby England, typically belonging to the Post-2000s (Gen Z/Alpha) group (50%), primarily speaking English or German.
- Domestic travelers account for 75.2% of guests.
- Key international markets include United Kingdom (75.2%) and United States (8%).
- Top languages spoken are English (53.6%) followed by German (9.3%).
- A significant demographic segment is the Post-2000s (Gen Z/Alpha) group, representing 50% of guests.
Recommendations for Hosts
- Target domestic marketing efforts towards travelers from England and Scotland.
- Tailor amenities and listing descriptions to appeal to the dominant Post-2000s (Gen Z/Alpha) demographic (e.g., highlight fast WiFi, smart home features, local guides).
- Highlight unique local experiences or amenities relevant to the primary guest profile.
- Consider seasonal promotions aligned with peak travel times for key origin markets.
Nearby Short-Term Rental Market Comparison
How does the St Fillans Airbnb market stack up against its neighbors? Compare key performance metrics like average monthly revenue, ADR, and occupancy rates in surrounding areas to understand the broader regional STR landscape.
| Market | Active Properties | Monthly Revenue | Daily Rate | Avg. Occupancy |
|---|---|---|---|---|
| Ardlui | 10 | $6,556 | $714.77 | 30% |
| Bridge of Cally | 18 | $6,245 | $629.64 | 46% |
| Foyers | 18 | $5,824 | $354.91 | 57% |
| Dalkeith | 10 | $5,775 | $478.16 | 55% |
| Larbert | 10 | $5,686 | $322.43 | 56% |
| Camuscross | 13 | $5,401 | $356.08 | 60% |
| Gartocharn | 16 | $5,313 | $437.25 | 47% |
| Acharn | 11 | $5,066 | $284.21 | 61% |
| Luss | 18 | $5,059 | $381.65 | 49% |
| Kirkhill | 10 | $4,909 | $727.25 | 43% |