Strachur Airbnb Market Analysis 2026: Short Term Rental Data & Vacation Rental Statistics in Scotland, United Kingdom
Is Airbnb profitable in Strachur in 2026? Explore comprehensive Airbnb analytics for Strachur, Scotland, United Kingdom to uncover income potential. This 2026 STR market report for Strachur, based on AirROI data from February 2025 to January 2026, reveals key trends in the niche market of 20 active listings.
Whether you're considering an Airbnb investment in Strachur, optimizing your existing vacation rental, or exploring rental arbitrage opportunities, understanding the Strachur Airbnb data is crucial. Navigating the high regulation landscape is key to maximizing your short term rental income potential. Let's dive into the specifics.
Key Strachur Airbnb Performance Metrics Overview
Monthly Airbnb Revenue Variations & Income Potential in Strachur (2026)
Understanding the monthly revenue variations for Airbnb listings in Strachur is key to maximizing your short term rental income potential. Seasonality significantly impacts earnings. Our analysis, based on data from the past 12 months, shows that the peak revenue month for STRs in Strachur is typically July, while February often presents the lowest earnings, highlighting opportunities for strategic pricing adjustments during shoulder and low seasons. Explore the typical Airbnb income in Strachur across different performance tiers:
- Best-in-class properties (Top 10%) achieve $4,446+ monthly, often utilizing dynamic pricing and superior guest experiences.
- Strong performing properties (Top 25%) earn $3,340 or more, indicating effective management and desirable locations/amenities.
- Typical properties (Median) generate around $2,370 per month, representing the average market performance.
- Entry-level properties (Bottom 25%) see earnings around $1,428, often with potential for optimization.
Average Monthly Airbnb Earnings Trend in Strachur
Strachur Airbnb Occupancy Rate Trends (2026)
Maximize your bookings by understanding the Strachur STR occupancy trends. Seasonal demand shifts significantly influence how often properties are booked. Typically, Septembersees the highest demand (peak season occupancy), while February experiences the lowest (low season). Effective strategies, like adjusting minimum stays or offering promotions, can boost occupancy during slower periods. Here's how different property tiers perform in Strachur:
- Best-in-class properties (Top 10%) achieve 89%+ occupancy, indicating high desirability and potentially optimized availability.
- Strong performing properties (Top 25%) maintain 75% or higher occupancy, suggesting good market fit and guest satisfaction.
- Typical properties (Median) have an occupancy rate around 45%.
- Entry-level properties (Bottom 25%) average 20% occupancy, potentially facing higher vacancy.
Average Monthly Occupancy Rate Trend in Strachur
Average Daily Rate (ADR) Airbnb Trends in Strachur (2026)
Effective short term rental pricing strategy in Strachur involves understanding monthly ADR fluctuations. The Average Daily Rate (ADR) for Airbnb in Strachur typically peaks in August and dips lowest during September. Leveraging Airbnb dynamic pricing tools or strategies based on this seasonality can significantly boost revenue. Here's a look at the typical nightly rates achieved:
- Best-in-class properties (Top 10%) command rates of $387+ per night, often due to premium features or locations.
- Strong performing properties (Top 25%) achieve nightly rates of $282 or more.
- Typical properties (Median) charge around $187 per night.
- Entry-level properties (Bottom 25%) earn around $136 per night.
Average Daily Rate (ADR) Trend by Month in Strachur
Get Live Strachur Market Intelligence 👇

Explore Real-time Analytics
Airbnb Seasonality Analysis & Trends in Strachur (2026)
Peak Season (July, August, September)
- Revenue averages $3,654 per month
- Occupancy rates average 59.6%
- Daily rates average $225
Shoulder Season
- Revenue averages $2,671 per month
- Occupancy maintains around 51.5%
- Daily rates hold near $220
Low Season (January, February, December)
- Revenue drops to average $1,553 per month
- Occupancy decreases to average 33.2%
- Daily rates adjust to average $217
Seasonality Insights for Strachur
- The Airbnb seasonality in Strachur shows highly seasonal trends requiring careful strategy. While the sections above show seasonal averages, it's also insightful to look at the extremes:
- During the high season, the absolute peak month showcases Strachur's highest earning potential, with monthly revenues capable of climbing to $4,003, occupancy reaching a high of 63.3%, and ADRs peaking at $238.
- Conversely, the slowest single month of the year, typically falling within the low season, marks the market's lowest point. In this month, revenue might dip to $1,410, occupancy could drop to 30.8%, and ADRs may adjust down to $200.
- Understanding both the seasonal averages and these monthly peaks and troughs in revenue, occupancy, and ADR is crucial for maximizing your Airbnb profit potential in Strachur.
Seasonal Strategies for Maximizing Profit
- Peak Season: Maximize revenue through premium pricing and potentially longer minimum stays. Ensure high availability.
- Low Season: Offer competitive pricing, special promotions (e.g., extended stay discounts), and flexible cancellation policies. Target off-season travelers like remote workers or budget-conscious guests.
- Shoulder Seasons: Implement dynamic pricing that balances peak and low rates. Target weekend travelers or specific events. Offer slightly more flexible terms than peak season.
- Regularly analyze your own performance against these Strachur seasonality benchmarks and adjust your pricing and availability strategy accordingly.
Best Areas for Airbnb Investment in Strachur (2026)
Exploring the top neighborhoods for short-term rentals in Strachur? This section highlights key areas, outlining why they are attractive for hosts and guests, along with notable local attractions. Consider these locations based on your target guest profile and investment strategy.
| Neighborhood / Area | Why Host Here? (Target Guests & Appeal) | Key Attractions & Landmarks |
|---|---|---|
| Strachur Village | A picturesque Scottish village located by the beautiful Loch Fyne, offering stunning views and a tranquil atmosphere. Ideal for tourists looking for a peaceful retreat with opportunities for outdoor activities. | Loch Fyne, Strachur Castle, Benmore Botanic Garden, Kilmartin Glen, Hiking trails in Argyll Forest Park |
| Inveraray | A charming town famous for its historic castle and scenic waterfront. Attracts visitors interested in Scottish history and culture, with plenty of attractions nearby. | Inveraray Castle, Inveraray Jail, The Loch Fyne Gallery, The George Hotel, Scenic walks along Loch Fyne |
| Tarbert | A small fishing village that serves as a gateway to the Isle of Harris and Lewis. Known for its harbor and seafood, making it a great location for coastal tourism. | Tarbert Harbour, Knapdale Forest, The Paper Shop Gallery, Tarbert Castle, Boat trips to nearby islands |
| Lochgilphead | Located at the head of Loch Gilp, this town is a hub for local activities and access to the surrounding countryside. It's popular with families and outdoor enthusiasts. | Lochgilphead Marina, Ardrishaig, Crinan Canal, Nearby hiking and cycling trails, Local shops and cafes |
| Dunoon | Known for its coastal scenery and as a ferry terminal to Gourock. It attracts visitors for its views over the Firth of Clyde and outdoor leisure activities. | Dunoon Castle, Kilcreggan Ferry, Gourock Outdoor Pool, The Cowal Peninsula, Dunoon Pier |
| Oban | Known as the 'Gateway to the Isles', this bustling town attracts tourists for its seafood and ferry services to the Hebrides. Great for exploring Scotland's islands. | Oban Distillery, McCaig's Tower, Oban Harbour, Dunstaffnage Castle, Nearby island tours |
| Campbeltown | A small town that offers a unique glimpse into Scottish life. Renowned for its whisky and coastal beauty, attracting visitors interested in local culture and history. | Springbank Distillery, Campbeltown Heritage Centre, Kintyre Peninsula, Nearby beaches, Local seafood restaurants |
| Argyll Forest Park | A stunning area of natural beauty in Argyll and Bute, offering numerous trails and outdoor activities. Perfect for nature lovers and adventure seekers. | Hiking trails, Wildlife watching, Loch Eck, Picnic spots, Scenic drives |
Understanding Airbnb License Requirements & STR Laws in Strachur (2026)
Yes, Strachur, Scotland, United Kingdom enforces high STR regulations. Obtaining a license and ensuring compliance is almost certainly required according to current 2026 STR laws. Always verify the latest short term rental regulations and Airbnb license requirements directly with local government authorities for Strachur to ensure full compliance before hosting.
(Source: AirROI data, 2026, based on 40% licensed listings)
Top Performing Airbnb Properties in Strachur (2026)
Benchmark your potential! Explore examples of top-performing Airbnb properties in Strachurbased on Trailing Twelve Month (TTM) revenue. Analyze their characteristics, revenue, occupancy rate, and ADR to understand what drives success in this market.

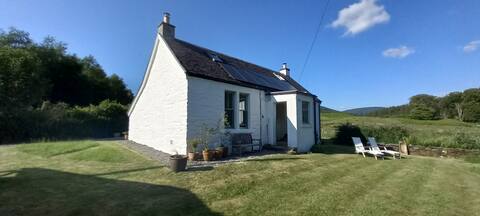
Ardfyne Lodge with stunning sea loch views
Entire Place • 5 bedrooms
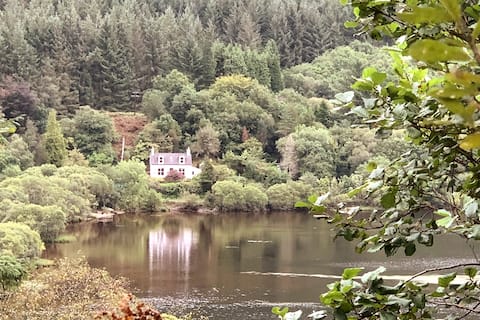
Cottage, Quiet Rural Location near Loch Fyne
Entire Place • 1 bedroom
Stunning 4BD cottage on Loch Eck
Entire Place • 4 bedrooms
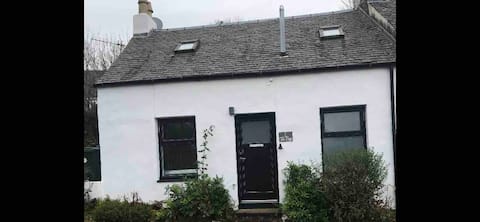
The Bay, Strachur overlooking Loch Fyne
Entire Place • 2 bedrooms

A cosy hideaway in the hills
Entire Place • 2 bedrooms
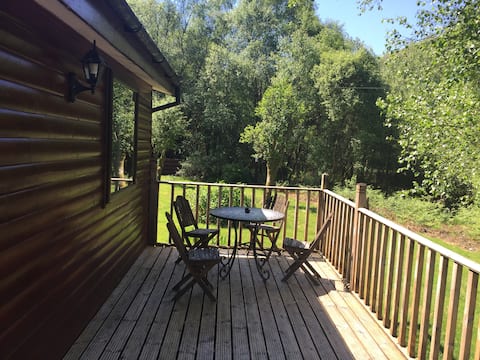
Reivers Retreat, Loch Eck
Entire Place • 2 bedrooms
Note: Performance varies based on location, size, amenities, seasonality, and management quality. Data reflects the past 12 months.
Top Performing Airbnb Hosts in Strachur (2026)
Learn from the best! This table showcases top-performing Airbnb hosts in Strachur based on the number of properties managed and estimated total revenue over the past year. Analyze their scale and performance metrics.
| Host Name | Properties | Grossing Revenue | Stay Reviews | Avg Rating |
|---|---|---|---|---|
| Allison | 2 | $66,535 | 207 | 4.86/5.0 |
| Isabella | 1 | $62,464 | 16 | 4.94/5.0 |
| Donald | 2 | $52,049 | 221 | 4.89/5.0 |
| Fiona | 1 | $40,602 | 180 | 4.96/5.0 |
| Ana | 1 | $40,051 | 33 | 4.76/5.0 |
| Cottages | 4 | $37,325 | 12 | 4.89/5.0 |
| Iain | 2 | $35,001 | 27 | 4.97/5.0 |
| Bethan | 1 | $31,409 | 75 | 4.95/5.0 |
| Argyll | 1 | $26,817 | 215 | 4.89/5.0 |
| Robbie | 1 | $26,407 | 344 | 4.91/5.0 |
Analyzing the strategies of top hosts, such as their property selection, pricing, and guest communication, can offer valuable lessons for optimizing your own Airbnb operations in Strachur.
Dive Deeper: Advanced Strachur STR Market Data (2026)
Ready to unlock more insights? AirROI provides access to advanced metrics and comprehensive Airbnb data for Strachur. Explore detailed analytics beyond this report to refine your investment strategy, optimize pricing, and maximize your vacation rental profits.
Explore Advanced MetricsStrachur Short-Term Rental Market Composition (2026): Property & Room Types
Room Type Distribution
Property Type Distribution
Market Composition Insights for Strachur
- The Strachur Airbnb market composition is heavily skewed towards Entire Home/Apt listings, which make up 100% of the 20 active rentals. This indicates strong guest preference for privacy and space.
- Looking at the property type distribution in Strachur, House properties are the most common (70%), reflecting the local real estate landscape.
- Houses represent a significant 70% portion, catering likely to families or larger groups.
Strachur Airbnb Room Capacity Analysis (2026): Bedroom Distribution
Distribution of Listings by Number of Bedrooms
Room Capacity Insights for Strachur
- The dominant room capacity in Strachur is 2 bedrooms listings, making up 35% of the market. This suggests a strong demand for properties suitable for couples or solo travelers.
- Together, 2 bedrooms and 1 bedroom properties represent 65.0% of the active Airbnb listings in Strachur, indicating a high concentration in these sizes.
- A significant 30.0% of listings offer 3+ bedrooms, catering to larger groups and families seeking more space in Strachur.
Strachur Vacation Rental Guest Capacity Trends (2026)
Distribution of Listings by Guest Capacity
Guest Capacity Insights for Strachur
- The most common guest capacity trend in Strachur vacation rentals is listings accommodating 4 guests (45%). This suggests the primary traveler segment is likely small families or groups.
- Properties designed for 4 guests and 2 guests dominate the Strachur STR market, accounting for 70.0% of listings.
- 25.0% of properties accommodate 6+ guests, serving the market segment for larger families or group travel in Strachur.
- On average, properties in Strachur are equipped to host 4.3 guests.
Strachur Airbnb Booking Patterns (2026): Available vs. Booked Days
Available Days Distribution
Booked Days Distribution
Booking Pattern Insights for Strachur
- The most common availability pattern in Strachur falls within the 271-366 days range, representing 40% of listings. This suggests many properties have significant open periods on their calendars.
- Approximately 60.0% of listings show high availability (181+ days open annually), indicating potential for increased bookings or specific owner usage patterns.
- For booked days, the 31-90 days range is most frequent in Strachur (30%), reflecting common guest stay durations or potential owner blocking patterns.
- A notable 40.0% of properties secure long booking periods (181+ days booked per year), highlighting successful long-term rental strategies or significant owner usage.
Strachur Airbnb Minimum Stay Requirements Analysis
Distribution of Listings by Minimum Night Requirement
1 Night
4 listings
20% of total
2 Nights
2 listings
10% of total
3 Nights
2 listings
10% of total
4-6 Nights
2 listings
10% of total
30+ Nights
10 listings
50% of total
Key Insights
- The most prevalent minimum stay requirement in Strachur is 30+ Nights, adopted by 50% of listings. This highlights the market's preference for longer commitments.
- A significant segment (50%) caters to monthly stays (30+ nights) in Strachur, pointing to opportunities in the extended-stay market.
Recommendations
- Align with the market by considering a 30+ Nights minimum stay, as 50% of Strachur hosts use this setting.
- If feasible, allowing 1-night stays, especially midweek or during low season, could capture last-minute bookings, as only 20% currently do.
- Explore offering discounts for stays of 30+ nights to attract the 50% of the market seeking extended stays.
- Adjust minimum nights based on seasonality – potentially shorter during low season and longer during peak demand periods in Strachur.
Strachur Airbnb Cancellation Policy Trends Analysis (2026)
Super Strict 60 Days
6 listings
30% of total
Flexible
2 listings
10% of total
Moderate
7 listings
35% of total
Firm
4 listings
20% of total
Strict
1 listings
5% of total
Cancellation Policy Insights for Strachur
- The prevailing Airbnb cancellation policy trend in Strachur is Moderate, used by 35% of listings.
- There's a relatively balanced mix between guest-friendly (45.0%) and stricter (25.0%) policies, offering choices for different guest needs.
- Strict cancellation policies are quite rare (5%), potentially making listings with this policy less competitive unless justified by high demand or property type.
Recommendations for Hosts
- Consider adopting a Moderate policy to align with the 35% market standard in Strachur.
- Using a Strict policy might deter some guests, as only 5% of listings use it. Evaluate if potential revenue protection outweighs possible lower booking rates.
- Regularly review your cancellation policy against competitors and market demand shifts in Strachur.
Strachur STR Booking Lead Time Analysis (2026)
Average Booking Lead Time by Month
Booking Lead Time Insights for Strachur
- The overall average booking lead time for vacation rentals in Strachur is 72 days.
- Guests book furthest in advance for stays during August (average 108 days), likely coinciding with peak travel demand or local events.
- The shortest booking windows occur for stays in January (average 37 days), indicating more last-minute travel plans during this time.
- Seasonally, Summer (93 days avg.) sees the longest lead times, while Winter (62 days avg.) has the shortest, reflecting typical travel planning cycles.
Recommendations for Hosts
- Use the overall average lead time (72 days) as a baseline for your pricing and availability strategy in Strachur.
- For August stays, consider implementing length-of-stay discounts or slightly higher rates for bookings made less than 108 days out to capitalize on advance planning.
- Target marketing efforts for the Summer season well in advance (at least 93 days) to capture early planners.
- Monitor your own booking lead times against these Strachur averages to identify opportunities for dynamic pricing adjustments.
Popular & Essential Airbnb Amenities in Strachur (2026)
Amenity Prevalence
Amenity Insights for Strachur
- Essential amenities in Strachur that guests expect include: Smoke alarm, Kitchen, Fire extinguisher, Hangers, Bed linens, Free parking on premises, Private entrance. Lacking these (any) could significantly impact bookings.
- Popular amenities like Wifi, TV, Heating are common but not universal. Offering these can provide a competitive edge.
- Warning: Wifi is not universally provided but is considered essential globally. Ensure reliable Wifi is offered.
Recommendations for Hosts
- Ensure your listing includes all essential amenities for Strachur: Smoke alarm, Kitchen, Fire extinguisher, Hangers, Bed linens, Free parking on premises, Private entrance.
- Prioritize adding missing essentials: Fire extinguisher, Hangers, Bed linens, Free parking on premises, Private entrance.
- Consider adding popular differentiators like Wifi or TV to increase appeal.
- Highlight unique or less common amenities you offer (e.g., hot tub, dedicated workspace, EV charger) in your listing description and photos.
- Regularly check competitor amenities in Strachur to stay competitive.
Strachur Airbnb Guest Demographics & Profile Analysis (2026)
Guest Profile Summary for Strachur
- The typical guest profile for Airbnb in Strachur consists of primarily domestic travelers (79%), often arriving from nearby England, typically belonging to the Post-2000s (Gen Z/Alpha) group (50%), primarily speaking English or German.
- Domestic travelers account for 78.5% of guests.
- Key international markets include United Kingdom (78.5%) and United States (4.5%).
- Top languages spoken are English (57.3%) followed by German (10.1%).
- A significant demographic segment is the Post-2000s (Gen Z/Alpha) group, representing 50% of guests.
Recommendations for Hosts
- Target domestic marketing efforts towards travelers from England and Edinburgh.
- Tailor amenities and listing descriptions to appeal to the dominant Post-2000s (Gen Z/Alpha) demographic (e.g., highlight fast WiFi, smart home features, local guides).
- Highlight unique local experiences or amenities relevant to the primary guest profile.
- Consider seasonal promotions aligned with peak travel times for key origin markets.
Nearby Short-Term Rental Market Comparison
How does the Strachur Airbnb market stack up against its neighbors? Compare key performance metrics like average monthly revenue, ADR, and occupancy rates in surrounding areas to understand the broader regional STR landscape.
| Market | Active Properties | Monthly Revenue | Daily Rate | Avg. Occupancy |
|---|---|---|---|---|
| Ardlui | 10 | $6,556 | $714.77 | 30% |
| Hallin | 11 | $5,844 | $412.15 | 68% |
| Foyers | 18 | $5,824 | $354.91 | 57% |
| Camuscross | 13 | $5,401 | $356.08 | 60% |
| Stein | 14 | $5,384 | $314.74 | 68% |
| Gartocharn | 16 | $5,313 | $437.25 | 47% |
| Port Failthe | 15 | $5,243 | $320.01 | 58% |
| Acharn | 11 | $5,066 | $284.21 | 61% |
| Luss | 18 | $5,059 | $381.65 | 49% |
| Isle of Skye | 12 | $4,994 | $283.34 | 63% |