Ocean City, Maryland Airbnb Market Data 2026: STR Report & Statistics
How much can you earn on Airbnb in Ocean City, Maryland? Based on AirROI's 2026 dataset (July 2025 – June 2026), the short answer is $25,954 per year — at a $354 nightly rate, 33.5% occupancy, and a $138 RevPAR that reflects moderate rate-to-revenue efficiency with room to optimize.
Ocean City's 4,179 active listings and selective demand that rewards strong listing quality and pricing strategy make it a major short-term rental market. Supply grew 13.4% and nightly rates have risen, creating an environment where the most bookable listings stand to capture outsized share. Hosts who pair competitive pricing with strong guest experience are well-positioned to convert the growing traveler base into consistent bookings.
Regulation is high and 97% of listings show active registration — compliance is the cost of entry. For data-driven hosts, the opportunity lies in reading these signals and positioning accordingly.

Table of Contents [hide] [show]
What Are the Key Airbnb Metrics in Ocean City?
In Ocean City, the headline Airbnb metrics are $25,954 in average annual revenue,33.5% occupancy, $354 ADR, and $138 in RevPAR, and guests book about 70 days in advance.
How Much Do Airbnb Hosts Earn Monthly in Ocean City?
Understanding the monthly revenue variations for Airbnb listings in Ocean City is key to maximizing your short term rental income potential. Seasonality significantly impacts earnings. Our analysis, based on data from the past 12 months, shows that the peak revenue month for STRs in Ocean City is typically July, while January often presents the lowest earnings, highlighting opportunities for strategic pricing adjustments during shoulder and low seasons. Explore the typical Airbnb income in Ocean City across different performance tiers:
- Best-in-class properties (Top 10%) achieve $7,023+ monthly, often utilizing dynamic pricing and superior guest experiences.
- Strong performing properties (Top 25%) earn $4,436 or more, indicating effective management and desirable locations/amenities.
- Typical properties (Median) generate around $2,567 per month, representing the average market performance.
- Entry-level properties (Bottom 25%) see earnings around $1,307, often with potential for optimization.
Average Monthly Airbnb Earnings Trend in Ocean City
What Is the Monthly Airbnb Occupancy Rate in Ocean City?
Maximize your bookings by understanding the Ocean City STR occupancy trends. Seasonal demand shifts significantly influence how often properties are booked. Typically, Julysees the highest demand (peak season occupancy), while January experiences the lowest (low season). Effective strategies, like adjusting minimum stays or offering promotions, can boost occupancy during slower periods. Here's how different property tiers perform in Ocean City:
- Best-in-class properties (Top 10%) achieve 59%+ occupancy, indicating high desirability and potentially optimized availability.
- Strong performing properties (Top 25%) maintain 41% or higher occupancy, suggesting good market fit and guest satisfaction.
- Typical properties (Median) have an occupancy rate around 26%.
- Entry-level properties (Bottom 25%) average 12% occupancy, potentially facing higher vacancy.
Average Monthly Occupancy Rate Trend in Ocean City
What Is the Average Airbnb Nightly Rate in Ocean City?
Effective short term rental pricing strategy in Ocean City involves understanding monthly ADR fluctuations. The Average Daily Rate (ADR) for Airbnb in Ocean City typically peaks in June and dips lowest during November. Leveraging Airbnb dynamic pricing tools or strategies based on this seasonality can significantly boost revenue. Here's a look at the typical nightly rates achieved:
- Best-in-class properties (Top 10%) command rates of $554+ per night, often due to premium features or locations.
- Strong performing properties (Top 25%) achieve nightly rates of $411 or more.
- Typical properties (Median) charge around $304 per night.
- Entry-level properties (Bottom 25%) earn around $232 per night.
Average Daily Rate (ADR) Trend by Month in Ocean City
What Is the RevPAR for Airbnb in Ocean City?
RevPAR in Ocean City is currently $138. Because RevPAR combines nightly rates with realized occupancy, it is one of the cleanest ways to compare how efficiently listings turn demand into revenue across the market.
- Entry-level properties (Bottom 25%) see $73 RevPAR.
- Typical properties (Median) generate $116 RevPAR.
- Strong performers (Top 25%) earn $179 RevPAR.
- Best-in-class (Top 10%) achieve $253 RevPAR.
Average Monthly RevPAR Trend in Ocean City
RevPAR Insights for Ocean City
- The average RevPAR in Ocean City is $138. This metric combines nightly rates with realized occupancy, making it one of the best single-number indicators of market efficiency.
- The gap between the top 10% ($253) and bottom 25% ($73) is $179, indicating significant performance disparity driven by property quality, pricing strategy, and location.
- RevPAR peaks in Jul and bottoms out in Jan, mirroring the broader seasonal demand pattern and suggesting opportunities for dynamic pricing.
Recommendations for Hosts
- Track your own RevPAR monthly against these Ocean City benchmarks. If your RevPAR falls below the median of $116, examine whether low occupancy or low ADR is the primary drag.
- Top-quartile listings achieve $179+ RevPAR through a combination of competitive pricing, strong reviews, and strategic amenities. Target this tier through incremental improvements.
- Use RevPAR rather than revenue alone when comparing properties of different sizes — it normalizes for available nights and gives a more accurate picture of performance.
Get Live Ocean City Market Intelligence 👇
Explore Real-time Analytics
When Is the Peak Season for Airbnb in Ocean City?
Ocean City's peak Airbnb season falls in July, August, June, while the softest stretch is January, February, December. Overall, the market shows highly seasonal trends requiring careful strategy, which should guide pricing, minimum stays, and cash-flow planning.
Peak Season (July, August, June)
- Revenue averages $7,235 per month
- Occupancy rates average 49.5%
- Daily rates average $428
Shoulder Season
- Revenue averages $2,384 per month
- Occupancy maintains around 24.7%
- Daily rates hold near $326
Low Season (January, February, December)
- Revenue drops to average $1,497 per month
- Occupancy decreases to average 18.7%
- Daily rates adjust to average $312
Seasonality Insights for Ocean City
- Airbnb seasonality in Ocean City is pronounced. Revenue swings sharply between peak and low months, which means pricing strategy, minimum-stay settings, and cash reserves all need to account for extended slower periods.
- During the high season, the absolute peak month showcases Ocean City's highest earning potential, with monthly revenues climbing to $8,821, occupancy reaching 58.5%, and ADRs peaking at $450.
- Conversely, the slowest single month marks the market's lowest point — revenue may dip to $1,382, occupancy could drop to 17.5%, and ADRs may adjust to $289.
- Lower occupancy paired with meaningful seasonality means hosts in Ocean City need to maximize every peak-season booking and seriously consider whether off-season pricing adjustments or minimum-stay changes can capture incremental revenue.
Seasonal Strategies for Maximizing Profit
- Peak Season: Maximize revenue through premium pricing. In a high-regulation market like Ocean City, ensure your permit covers the number of nights you plan to book — some jurisdictions cap annual rental days.
- Low Season: Offer competitive pricing, extended-stay discounts, and flexible cancellation policies. Target off-season travelers like remote workers, budget-conscious guests, and travelers with flexible schedules.
- Shoulder Seasons: Implement dynamic pricing that bridges peak and low rates. Target weekend travelers, local events, and business visitors. Slightly more flexible terms than peak season can help maintain occupancy without deep discounting.
- In a highly seasonal market like Ocean City, building a cash reserve during the top months is essential for covering fixed costs during the slow period. Automated pricing tools can help capture demand shifts in real time.
Do You Need a License for Airbnb in Ocean City?
Yes, Ocean City, Maryland, United States enforces high STR regulations and 97% of active listings show registration evidence — indicating that enforcement is active and compliance is a prerequisite for operating legally. Hosts entering this market should budget for permit fees, inspections, and potential occupancy tax obligations as part of their startup costs. Always verify the latest short-term rental regulations and Airbnb license requirements directly with local government authorities for Ocean City to ensure full compliance before hosting.
(Source: AirROI data, 2026, based on 97% licensed listings)
What Are the Best Neighborhoods for Airbnb in Ocean City?
In a large, heavily regulated market like Ocean City, neighborhood selection is one of the strongest levers for Airbnb investment performance. Zoning rules, permitting availability, and guest demand patterns can vary block by block. The 8 neighborhoods below represent areas where short-term rental activity concentrates — understanding why each one attracts guests and hosts helps investors evaluate where their property type and budget fit best.
| Neighborhood / Area | Why Host Here? (Target Guests & Appeal) | Key Attractions & Landmarks |
|---|---|---|
| North Ocean City | A quieter area known for its family-friendly atmosphere and proximity to the beach. Great for families and travelers seeking a relaxing vacation away from the hustle. | Northside Park, Fenwick Island State Park, Ocean City Fishing Pier, Miniature Golf Courses, Local Restaurants |
| West Ocean City | This area offers a blend of convenience with access to shopping and dining, along with quick access to the beach without the high congestion of the boardwalk area. | Ocean City Square Shopping Center, Marina activities, Bayside restaurants, Ocean Downs Casino, West Ocean City Dog Park |
| Boardwalk | The historic heart of Ocean City, full of attractions, restaurants, and nightlife. Ideal for those looking to experience the classic beach boardwalk atmosphere. | Ocean City Boardwalk, Jolly Roger Amusement Park, Ripley's Believe It or Not!, Trinidad Lounge, Thrashers French Fries |
| Downtown Ocean City | Offers vibrant nightlife and close proximity to the beach. Popular among young adults and visitors looking for fun activities and events. | Mason Dixon Dog Park, Ocean City Life-Saving Station Museum, Nightclubs and bars, The Beach Market, Local Festivals |
| Midtown Ocean City | A balance of convenience and beach access, suitable for all types of travelers. Known for its less crowded beaches compared to the boardwalk. | Ocean City Beach, Seacrets Jamaica USA, Jolly Roger Amusement Park, Numerous family-friendly restaurants, Golfing options nearby |
| South Ocean City | Offers a combination of relaxation and local charm with fewer tourists. Perfect for families and longer stays. | Gorman Avenue Park, Sandy Point State Park, Local coffee shops, Fishing from the beach, Cozy diners |
| Ocean Pines | A residential community with access to nature and a quieter setting, appealing to those wanting a longer retreat with local experiences. | Ocean Pines Golf Club, Assateague Island National Seashore, Community events, Nature trails, Local arts and crafts |
| Assateague Island | Famous for its wild ponies and natural beauty. Attracts nature lovers and those looking for a unique coastal experience away from the bustling crowds. | Assateague Island National Seashore, Wild pony viewing, Nature trails, Camping opportunities, Bicycle rentals |
Because Ocean City has a high regulation profile, confirming that short-term rental permits are available in your target neighborhood is a critical first step before committing to a property purchase. Regulation can vary at the neighborhood or district level even within the same city.
What Types of Properties Are on Airbnb in Ocean City?
Room Type Distribution
Property Type Distribution
Market Composition Insights for Ocean City
- The Ocean City Airbnb market composition is heavily skewed towards Entire Home/Apt listings, which make up 99.4% of the 4,179 active rentals. This indicates strong guest preference for privacy and space.
- Looking at the property type distribution in Ocean City, Apartment/Condo properties are the most common (77.8%), reflecting the local real estate landscape.
- Houses represent a significant 21.8% portion, catering likely to families or larger groups.
- Smaller segments like hotel/boutique, others (combined 0.4%) offer potential for unique stay experiences.
Ocean City Airbnb Room Capacity Analysis (2026): Bedroom Distribution
Distribution of Listings by Number of Bedrooms
Room Capacity Insights for Ocean City
- The dominant room capacity in Ocean City is 2 bedrooms listings, making up 42.8% of the market. This suggests a strong demand for properties suitable for couples or solo travelers.
- Together, 2 bedrooms and 3 bedrooms properties represent 68.8% of the active Airbnb listings in Ocean City, indicating a high concentration in these sizes.
- A significant 34.6% of listings offer 3+ bedrooms, catering to larger groups and families seeking more space in Ocean City.
Ocean City Vacation Rental Guest Capacity Trends (2026)
Distribution of Listings by Guest Capacity
Guest Capacity Insights for Ocean City
- The most common guest capacity trend in Ocean City vacation rentals is listings accommodating 8+ guests (42.6%). This suggests the primary traveler segment is likely larger groups.
- Properties designed for 8+ guests and 6 guests dominate the Ocean City STR market, accounting for 71.7% of listings.
- 77.6% of properties accommodate 6+ guests, serving the market segment for larger families or group travel in Ocean City.
- On average, properties in Ocean City are equipped to host 6.5 guests.
How Do Listings in Ocean City Compare on Quality?
Listing quality in Ocean City can be approximated through presentation depth, bedroom count, and how often hosts disclose exact locations. These signals show how professionally the local supply base is merchandised.
Listing Quality Insights for Ocean City
- At 30.7 photos per listing on average, Ocean City hosts invest well in visual presentation. Listings with 20+ photos consistently outperform in search ranking and conversion.
- 39.6% of listings show their exact location. Lower disclosure rates can increase booking hesitation — guests want to know exactly where they are staying.
Recommendations for Hosts
- Enable exact location if possible — it removes a common source of guest uncertainty and can improve your listing's position in map-based searches.
- Use these quality indicators as a self-audit checklist. Listings that exceed the Ocean City averages across all three metrics are better positioned for premium pricing.
What Amenities Do Airbnb Guests Expect in Ocean City?
Amenity Prevalence
Amenity Insights for Ocean City
- Essential amenities in Ocean City that guests expect include: TV, Air conditioning, Wifi, Kitchen, Smoke alarm, Refrigerator. Lacking these (any) could significantly impact bookings.
- Popular amenities like Microwave, Coffee maker, Heating are common but not universal. Offering these can provide a competitive edge.
Recommendations for Hosts
- Ensure your listing includes all essential amenities for Ocean City: TV, Air conditioning, Wifi, Kitchen, Smoke alarm, Refrigerator.
- Prioritize adding missing essentials: TV, Air conditioning, Wifi, Kitchen, Smoke alarm, Refrigerator.
- Consider adding popular differentiators like Microwave or Coffee maker to increase appeal.
- Highlight unique or less common amenities you offer (e.g., hot tub, dedicated workspace, EV charger) in your listing description and photos.
- Regularly check competitor amenities in Ocean City to stay competitive.
Which Airbnb Amenities Boost Revenue in Ocean City?
Not every amenity matters equally. This table focuses on the amenities most associated with higher revenue in Ocean City, which makes it more useful for prioritizing upgrades than a simple popularity list alone.
| Amenity | Prevalence | Revenue With | Revenue Without | Revenue Uplift |
|---|---|---|---|---|
Outdoor kitchenHigh opportunity | 0.3% | $79,966 | $25,799 | 210.0% |
Life size gamesHigh opportunity | 0.4% | $61,944 | $25,798 | 140.1% |
Baby monitorHigh opportunity | 0.3% | $61,513 | $25,860 | 137.9% |
Theme roomHigh opportunity | 0.5% | $60,564 | $25,788 | 134.9% |
Children’s bikesHigh opportunity | 0.1% | $60,706 | $25,904 | 134.4% |
Laser tagHigh opportunity | 0.2% | $59,947 | $25,889 | 131.6% |
Cooking basics | 62.4% | $32,802 | $14,586 | 124.9% |
Movie theaterHigh opportunity | 0.8% | $56,493 | $25,696 | 119.8% |
Pocket wifiHigh opportunity | 0.5% | $56,551 | $25,800 | 119.2% |
Fire pitHigh opportunity | 1.1% | $56,033 | $25,634 | 118.6% |
Revenue Impact Insights for Ocean City
- Outdoor kitchen tops the revenue impact list with a 210.0% uplift — listings with this amenity earn $79,966 vs. $25,799 without it.
- High-opportunity amenities — Outdoor kitchen, Life size games, Baby monitor — combine revenue uplift above 100% with prevalence under 10%, meaning most competitors haven't adopted them yet.
Recommendations for Hosts
- Prioritize adding Outdoor kitchen — it has the best combination of high revenue impact and low market saturation in Ocean City.
- Focus your upgrade budget on amenities in the top half of this table. Below-median amenities may improve guest experience but contribute less to revenue growth.
- Highlight revenue-impacting amenities prominently in your listing title, photos, and description — guests can't value what they don't notice.
Dive Deeper: Advanced Ocean City STR Market Data (2026)
Ready to unlock more insights? AirROI provides access to advanced metrics and comprehensive Airbnb data for Ocean City. Explore detailed analytics beyond this report to refine your investment strategy, optimize pricing, and maximize your vacation rental profits.
Explore Advanced MetricsOcean City Airbnb Guest Demographics & Profile Analysis (2026)
Guest Profile Summary for Ocean City
- The typical guest profile for Airbnb in Ocean City consists of primarily domestic travelers (96%), often arriving from nearby Baltimore, typically belonging to the Post-2000s (Gen Z/Alpha) group (50%), primarily speaking English or Spanish.
- Domestic travelers account for 95.6% of guests.
- Key international markets include United States (95.6%) and DC (3.3%).
- Top languages spoken are English (77.4%) followed by Spanish (10.5%).
- A significant demographic segment is the Post-2000s (Gen Z/Alpha) group, representing 50% of guests.
Recommendations for Hosts
- Target domestic marketing efforts towards travelers from Baltimore and Washington.
- Tailor amenities and listing descriptions to appeal to the dominant Post-2000s (Gen Z/Alpha) demographic (e.g., highlight fast WiFi, smart home features, local guides).
- Highlight unique local experiences or amenities relevant to the primary guest profile.
- Consider seasonal promotions aligned with peak travel times for key origin markets.
What Are Airbnb Guest Ratings in Ocean City?
Listings in Ocean City average 4.69 out of 5 overall, with about 33.6 reviews per active listing and 31.6% of listings carrying the Guest Favorite badge.
Rating Breakdown by Category
Guest Rating Insights for Ocean City
- An average rating of 4.69 places Ocean City in solid territory. Most guests leave satisfied, though there is room for hosts to push toward the top tier.
- The strongest subcategory is Location (4.89), while Value (4.6) trails behind — a useful signal for hosts looking to prioritize upgrades.
- 31.6% of listings carry the Guest Favorite badge, a strong trust signal that can meaningfully lift click-through and booking rates.
Recommendations for Hosts
- Focus improvement efforts on Cleanliness — even small gains in the weakest subcategory can lift overall ratings and search ranking.
- Encourage guests to leave reviews after checkout. Listings with more reviews rank higher in search results and convert browsers into bookers more effectively.
Ocean City Airbnb Booking Patterns (2026): Available vs. Booked Days
Available Days Distribution
Booked Days Distribution
Booking Pattern Insights for Ocean City
- The most common availability pattern in Ocean City falls within the 271-366 days range, representing 77.2% of listings. This suggests many properties have significant open periods on their calendars.
- Approximately 97.2% of listings show high availability (181+ days open annually), indicating potential for increased bookings or specific owner usage patterns.
- For booked days, the 31-90 days range is most frequent in Ocean City (45.9%), reflecting common guest stay durations or potential owner blocking patterns.
- A notable 3.1% of properties secure long booking periods (181+ days booked per year), highlighting successful long-term rental strategies or significant owner usage.
How Far in Advance Do Guests Book Airbnb in Ocean City?
Average Booking Lead Time by Month
Booking Lead Time Insights for Ocean City
- The overall average booking lead time for vacation rentals in Ocean City is 70 days.
- Guests book furthest in advance for stays during September (average 95 days), likely coinciding with peak travel demand or local events.
- The shortest booking windows occur for stays in February (average 28 days), indicating more last-minute travel plans during this time.
- Seasonally, Summer (79 days avg.) sees the longest lead times, while Winter (31 days avg.) has the shortest, reflecting typical travel planning cycles.
Recommendations for Hosts
- Use the overall average lead time (70 days) as a baseline for your pricing and availability strategy in Ocean City.
- For September stays, consider implementing length-of-stay discounts or slightly higher rates for bookings made less than 95 days out to capitalize on advance planning.
- Target marketing efforts for the Summer season well in advance (at least 79 days) to capture early planners.
- Monitor your own booking lead times against these Ocean City averages to identify opportunities for dynamic pricing adjustments.
What Is the Average Length of Stay for Airbnb in Ocean City?
Guests in Ocean City stay about 4.3 nights on average, generating roughly 61,191 reservations and 14.6 bookings per listing in the latest AirROI dataset. The most common check-in time is 4:00 PM and check-out is 10:00 AM.
Monthly Length of Stay in Ocean City
Check-in Time Distribution
Check-out Time Distribution
Stay Pattern Insights for Ocean City
- A mid-range stay length points to leisure-driven demand — weekend getaways and short vacations. Hosts should optimize for quick turnover efficiency while keeping the guest experience smooth.
- 14.6 bookings per listing is a manageable pace that balances revenue with operational overhead.
- Stay lengths peak in Jul (5.1 nights) and shorten in May (3.3 nights). Adjust minimum-night requirements seasonally to match.
Recommendations for Hosts
- With shorter average stays, focus on streamlining turnover. Self-check-in, reliable cleaning crews, and pre-staged amenities can reduce per-booking operational costs.
- Set your check-in time to match or beat the market standard of 4:00 PM. Offering early check-in flexibility can be a low-cost differentiator.
- Monitor length-of-stay seasonality to adjust minimum-night requirements — longer minimums during peak periods maximize revenue while shorter minimums fill gaps in shoulder seasons.
Ocean City Airbnb Minimum Stay Requirements Analysis
Distribution of Listings by Minimum Night Requirement
1 Night
138 listings
3.3% of total
2 Nights
1079 listings
25.8% of total
3 Nights
680 listings
16.3% of total
4-6 Nights
201 listings
4.8% of total
7-29 Nights
84 listings
2% of total
30+ Nights
1996 listings
47.8% of total
Key Insights
- The most prevalent minimum stay requirement in Ocean City is 30+ Nights, adopted by 47.8% of listings. This highlights the market's preference for longer commitments.
- A significant segment (47.8%) caters to monthly stays (30+ nights) in Ocean City, pointing to opportunities in the extended-stay market.
Recommendations
- Align with the market by considering a 30+ Nights minimum stay, as 47.8% of Ocean City hosts use this setting.
- If feasible, allowing 1-night stays, especially midweek or during low season, could capture last-minute bookings, as only 3.3% currently do.
- Explore offering discounts for stays of 30+ nights to attract the 47.8% of the market seeking extended stays.
- Adjust minimum nights based on seasonality – potentially shorter during low season and longer during peak demand periods in Ocean City.
Ocean City Airbnb Cancellation Policy Trends Analysis (2026)
Limited
202 listings
4.8% of total
Super Strict 60 Days
368 listings
8.8% of total
Super Strict 30 Days
600 listings
14.4% of total
Flexible
127 listings
3% of total
Moderate
1040 listings
24.9% of total
Firm
1378 listings
33% of total
Strict
462 listings
11.1% of total
Cancellation Policy Insights for Ocean City
- The prevailing Airbnb cancellation policy trend in Ocean City is Firm, used by 33% of listings.
- There's a relatively balanced mix between guest-friendly (27.9%) and stricter (44.1%) policies, offering choices for different guest needs.
Recommendations for Hosts
- Consider adopting a Firm policy to align with the 33% market standard in Ocean City.
- Using a Strict policy might deter some guests, as only 11.1% of listings use it. Evaluate if potential revenue protection outweighs possible lower booking rates.
- Regularly review your cancellation policy against competitors and market demand shifts in Ocean City.
How Much Are Airbnb Cleaning Fees in Ocean City?
Cleaning fees in Ocean City are meaningful operating levers, not just pass-through charges. What matters most is how often hosts charge them, how high they run relative to market norms, and how large a share of gross revenue they consume.
Cleaning Fee Insights for Ocean City
- 95.0% of listings charge a cleaning fee, making it standard practice in Ocean City. Guests expect it and factor it into their booking decisions.
- The gap between the average ($245) and median ($208) cleaning fee indicates some high-end properties are pulling the average up considerably.
- Cleaning fees represent 14.4% of gross revenue on average — a significant line item that impacts total guest cost and competitiveness.
Recommendations for Hosts
- Price your cleaning fee competitively against the Ocean City median of $208. Fees significantly above market norms can deter bookings, especially for shorter stays.
- Consider whether bundling the cleaning fee into a slightly higher nightly rate might improve conversion, since many guests filter by total price and separate fees can feel punitive.
- Monitor competitor cleaning fees regularly. Airbnb's search algorithm factors in total price, so a well-calibrated cleaning fee can improve your listing's ranking.
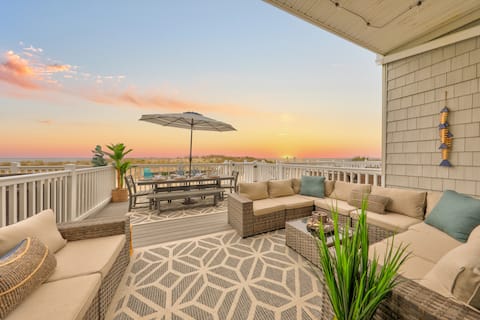
What Do the Top Airbnb Listings in Ocean City Look Like?
Benchmark your potential! Explore examples of top-performing Airbnb properties in Ocean Citybased on Trailing Twelve Month (TTM) revenue. Analyze their characteristics, revenue, occupancy rate, and ADR to understand what drives success in this market.
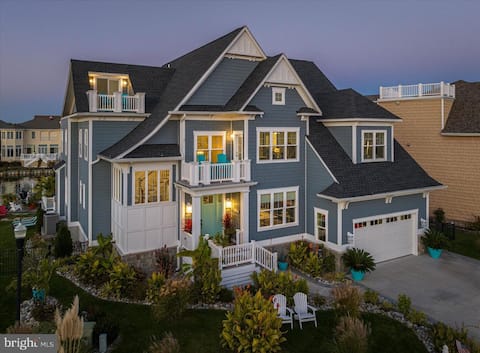
Epic Luxurious Mansion Bayside Pools Tennis
Entire Place • 6 bedrooms

Heated Pool Now Open ~ Sleeps 20
Entire Place • 6 bedrooms

The Chesapeake House
Entire Place • 6 bedrooms
New! Direct Oceanfront Home w/Game Room/Free Bikes
Entire Place • 4 bedrooms

5BR OceanView O/D Space/Movies, Pool, Bikes, Gear
Entire Place • 5 bedrooms

Spacious Home w/ Parking Steps to Beach Boardwalk.
Entire Place • 8 bedrooms
Note: Performance varies based on location, size, amenities, seasonality, and management quality. Data reflects the past 12 months.
Who Are the Top Airbnb Hosts in Ocean City?
Learn from the best! This table showcases top-performing Airbnb hosts in Ocean City based on the number of properties managed and estimated total revenue over the past year. Analyze their scale and performance metrics.
| Host Name | Properties | Grossing Revenue | Stay Reviews | Avg Rating |
|---|---|---|---|---|
| Seaside Vacations & Sales | 214 | $5,282,254 | 1372 | 4.60/5.0 |
| Oceans Edge Vacations | 103 | $4,929,058 | 2311 | 4.76/5.0 |
| Bob | 53 | $4,452,463 | 4096 | 4.78/5.0 |
| VueStay Vacations By Casago | 381 | $3,214,596 | 4331 | 4.41/5.0 |
| OC Beach Vacations | 48 | $2,300,034 | 4179 | 4.92/5.0 |
| Evolve | 76 | $2,250,479 | 2310 | 4.72/5.0 |
| OCMD Getaways | 86 | $2,217,739 | 949 | 4.75/5.0 |
| Kelly | 72 | $2,115,519 | 1237 | 4.69/5.0 |
| Best Of OC Condo Rentals | 35 | $1,983,290 | 1002 | 4.86/5.0 |
| VueStay Vacations By Casago | 212 | $1,848,207 | 4851 | 4.38/5.0 |
Analyzing the strategies of top hosts, such as their property selection, pricing, and guest communication, can offer valuable lessons for optimizing your own Airbnb operations in Ocean City.
Who Are the Airbnb Hosts in Ocean City?
Ocean City leans more toward professional operations than casual hosting, which usually raises the competitive bar for new entrants.
Host Profile Insights for Ocean City
- A 35.5% Superhost share is healthy — enough experienced operators to anchor quality without making the market impenetrable for newcomers.
- 50.8% of listings are professionally managed, indicating a mature, competitive market with institutional players.
- 22.0% of listings have Instant Book enabled. Lower Instant Book adoption means many guests must request approval, which can slow conversions.
- 76.7% of listings use Airbnb's simplified pricing (host-only fee), where the host pays the entire platform service fee and the guest sees one all-in price with no separate Airbnb service charge. High adoption signals a professional, PMS-connected host base — Airbnb mandates simplified pricing for software-connected listings.
Recommendations for Hosts
- Earning Superhost status can significantly improve search ranking and guest trust. Focus on maintaining high response rates, low cancellations, and strong reviews.
- Consider enabling Instant Book — it reduces booking friction and Airbnb's algorithm tends to favor Instant Book listings in search results.
- With 17.5% cohosted listings, there may be a growing local market for property management services.
- Benchmark your host metrics against these Ocean City averages regularly and adjust your hosting strategy based on what top performers do differently.
Top Professional Management Companies in Ocean City
These are the highest-grossing professional property management operations in Ocean City, ranked by total revenue across their portfolio. Their performance metrics offer a benchmark for what institutional-level hosting looks like in this market.
| Company | Listings | Revenue | ADR | Occ. | Rating |
|---|---|---|---|---|---|
| Seaside Vacations & Sales | 214 | $5,282,254 | $367 | 30.7% | 4.60/5 |
| Oceans Edge Vacations | 103 | $4,929,058 | $458 | 40.2% | 4.76/5 |
| Bob | 53 | $4,452,463 | $471 | 42.9% | 4.78/5 |
| Vacasa Ocean City | 381 | $3,214,596 | $301 | 21.6% | 4.41/5 |
| OC Beach Vacations | 48 | $2,300,034 | $282 | 47.1% | 4.92/5 |
| Evolve | 76 | $2,250,479 | $306 | 39.6% | 4.72/5 |
| OCMD Getaways | 86 | $2,217,739 | $313 | 38.8% | 4.75/5 |
| Kelly | 72 | $2,115,519 | $321 | 35.6% | 4.69/5 |
| Best Of OC Condo Rentals | 35 | $1,983,290 | $437 | 43.1% | 4.86/5 |
| VueStay Vacations By Casago | 212 | $1,848,207 | $290 | 21.7% | 4.38/5 |
Management Company Insights for Ocean City
- The leading management company, Seaside Vacations & Sales, operates 214 listings with $5,282,254 in gross revenue — a useful benchmark for what scale looks like in Ocean City.
- Top managers average 128 properties each, pointing to a market where portfolio scale is a meaningful competitive factor.
- Professionally managed listings in the top tier average 4.69/5 in guest ratings — suggesting room for quality improvement even among larger operators.
Recommendations
- Study how top management companies price, position, and maintain their portfolios — their ADR and occupancy rates reflect strategies refined across dozens of listings.
- If you're considering hiring a property manager, compare their portfolio performance against these benchmarks before committing.
How Does Ocean City's Airbnb Market Compare to Nearby Cities?
How does the Ocean City Airbnb market stack up against its neighbors? Compare key performance metrics like average monthly revenue, ADR, and occupancy rates in surrounding areas to understand the broader regional STR landscape.
Compared with Lanexa, Ocean City has 16 percentage points lower occupancy and about $43 higher ADR. That helps frame whether this market is winning more on demand, pricing, or both.
| Market | Active Properties | Monthly Revenue | Daily Rate | Avg. Occupancy |
|---|---|---|---|---|
| Stevensville | 77 | $5,497 | $585.78 | 40% |
| Lower Windsor Township | 12 | $5,388 | $461.11 | 45% |
| Centreville | 18 | $5,341 | $563.28 | 41% |
| Royal Oak | 10 | $4,846 | $941.67 | 27% |
| Harvey Cedars | 27 | $4,782 | $1026.17 | 34% |
| Queenstown | 25 | $4,740 | $614.85 | 37% |
| Barnegat Light | 18 | $4,724 | $715.14 | 43% |
| Stone Harbor | 47 | $4,639 | $837.74 | 32% |
| Lanexa | 13 | $4,637 | $310.62 | 49% |
| Arundel on the Bay | 28 | $4,611 | $523.22 | 38% |
Frequently Asked Questions About Airbnb in Ocean City
These quick answers summarize the most common investor and operator questions using AirROI's latest market data for Ocean City.
How much do Airbnb hosts make in Ocean City?
Ocean City hosts earn about $25,954 per year on average, with an average nightly rate of $354 and RevPAR of $138. Those figures describe the typical revenue environment for active listings in Ocean City, Maryland, not the ceiling for the best operators. Source: AirROI 2026 data, Ocean City market, July 2025 to June 2026.
What is the average Airbnb occupancy rate in Ocean City?
The average Airbnb occupancy rate in Ocean City is 33.5%. July is the strongest month and January is the softest, so hosts should expect demand to move meaningfully throughout the year rather than stay flat.
What is the average Airbnb daily rate in Ocean City?
Listings in Ocean City average $354 per night. The broader pricing spread also matters: lower-performing listings cluster closer to the lower quartiles, while premium homes can price materially above the city average when demand spikes or listing quality stands out.
How many Airbnb listings are active in Ocean City?
Ocean City currently has about 4,179 active Airbnb listings in AirROI's market dataset. That supply count helps explain how competitive the market is, how much depth there is for benchmarking, and whether the market behaves like a niche destination or a scaled urban market.
How strict are short-term rental regulations in Ocean City?
AirROI currently classifies the short-term rental regulation level in Ocean City as High. The dataset also shows about 96.6% of listings with registration evidence. That is a market signal, not legal advice, so hosts should still confirm current licensing and compliance rules locally before listing.
What is the RevPAR for Airbnb in Ocean City?
RevPAR in Ocean City is about $138. That metric combines pricing and occupancy into one efficiency number, so it is often a better quick benchmark than ADR alone when investors want to compare how well listings convert nightly rates into realized revenue.
Is Airbnb profitable in Ocean City?
Occupancy of 33.5% means Ocean City is a more selective market. Profitability is achievable but requires careful cost management, premium positioning, or targeting longer stays to reduce turnover. Average annual revenue is $25,954, but individual returns depend on property type, location within the city, and the host's operating efficiency.
How far in advance do guests book Airbnb in Ocean City?
The average booking lead time in Ocean City is about 70 days — a longer planning horizon typical of destination or vacation markets where travelers book well in advance. Hosts who understand their market's booking cadence can adjust minimum stays and pricing windows accordingly.
What are the best neighborhoods for Airbnb in Ocean City?
Based on AirROI's analysis, some of the top neighborhoods for short-term rentals in Ocean City include North Ocean City, West Ocean City, Boardwalk. Each area attracts different guest profiles — from business travelers to leisure visitors — so the best location depends on the property type and target audience a host is aiming for. See the full neighborhood breakdown above.
What type of property performs best on Airbnb in Ocean City?
entire_home listings make up 99.4% of the active supply in Ocean City. The most common configuration does not always mean the most profitable — operators who identify underserved property types or bedroom counts can sometimes outperform the market average by filling a gap in local supply.
How does Ocean City compare to nearby Airbnb markets?
Among neighboring markets, Stevensville posts $65,968 in average annual revenue with 39.6% occupancy, compared to Ocean City's $25,954 and 33.5%. Comparing nearby markets helps investors understand whether a destination's performance reflects local demand or broader regional trends.
What is the average length of stay in Ocean City?
The average Airbnb stay length in Ocean City is about 4.3 nights. That matters for turnover, cleaning operations, and pricing strategy because shorter stays increase changeovers while longer stays can smooth occupancy and reduce operational friction.
What is the average Airbnb guest rating in Ocean City?
Airbnb listings in Ocean City average 4.69 out of 5 overall. About 31.6% of listings carry the guest favorite badge, which suggests a meaningful share of inventory is competing on review quality rather than price alone.
Which amenities boost Airbnb revenue in Ocean City?
Outdoor kitchen and Life size games are among the strongest revenue-linked amenities in Ocean City. In AirROI's latest dataset, listings with these amenities outperform those without on average revenue, which makes amenities analysis useful for prioritizing investment and listing upgrades.
Do Airbnb hosts charge cleaning fees in Ocean City?
Yes. About 95.0% of active Airbnb listings in Ocean City charge a cleaning fee, and the average fee is $245. The more important operating benchmark is how much of gross revenue that fee consumes, not just the absolute dollar amount.
What percentage of Airbnb hosts are Superhosts in Ocean City?
At 35.5%, there is a healthy mix of experienced and newer hosts — earning Superhost status can still provide a meaningful visibility boost.
About AirROI Market Data
AirROI tracks over 20 million properties across 190+ countries and maintains 15+ years of historical performance data, making it one of the deepest Airbnb and STR intelligence platforms available. The analytics pipeline aggregates listing-level data monthly — revenue, occupancy, nightly rates, RevPAR, guest demographics, booking patterns, and competitive supply — so investors and operators can benchmark any market against its own history and against neighboring destinations.
Real estate investors, property managers, financial institutions, hedge funds, tourism boards, hospitality consultants, tech platforms, and academic researchers rely on AirROI data to underwrite acquisitions, optimize pricing, model macro trends, and conduct peer-reviewed research. Data is available through in-depth market reports like this one and the Airbnb API with 22 endpoints and an Airbnb MCP Server for AI agents.
AirROI proprietary analytics as of 2026-06-30. Metrics reflect trailing twelve-month aggregates from active listings. Revenue figures are market averages, not projections. Neighborhood descriptions are AI-generated and reviewed for accuracy. For full methodology, see the data methodology page.