Municipio de Dina Huapi, Río Negro Province Airbnb Market Data 2026: STR Report & Statistics
How much can you earn on Airbnb in Municipio de Dina Huapi, Río Negro Province? Based on AirROI's 2026 dataset (February 2025 – January 2026), the short answer is $5,929 per year — at a $85 nightly rate, 31.6% occupancy, and a N/A RevPAR.
With just 20 active listings, Municipio de Dina Huapi is a micro-market where selective demand that rewards strong listing quality and pricing strategy. Supply grew 1900.0% year over year, and the market is recalibrating around a new competitive baseline. This is the stage where hosts who invest in amenities, guest experience, and dynamic pricing build durable advantages that compound as the market matures.
Regulation is low, reducing the compliance barrier — though local ordinances should still be verified. In a market this size, differentiated listings with strong reviews can capture outsized returns relative to the competition.

Table of Contents [hide] [show]
What Are the Key Airbnb Metrics in Municipio de Dina Huapi?
In Municipio de Dina Huapi, the headline Airbnb metrics are $5,929 in average annual revenue,31.6% occupancy, $85 ADR, and $0 in RevPAR, and guests book about 32 days in advance.
How Much Do Airbnb Hosts Earn Monthly in Municipio de Dina Huapi?
Understanding the monthly revenue variations for Airbnb listings in Municipio de Dina Huapi is key to maximizing your short term rental income potential. Seasonality significantly impacts earnings. Our analysis, based on data from the past 12 months, shows that the peak revenue month for STRs in Municipio de Dina Huapi is typically November, while September often presents the lowest earnings, highlighting opportunities for strategic pricing adjustments during shoulder and low seasons. Explore the typical Airbnb income in Municipio de Dina Huapi across different performance tiers:
- Best-in-class properties (Top 10%) achieve $2,852+ monthly, often utilizing dynamic pricing and superior guest experiences.
- Strong performing properties (Top 25%) earn $959 or more, indicating effective management and desirable locations/amenities.
- Typical properties (Median) generate around $596 per month, representing the average market performance.
- Entry-level properties (Bottom 25%) see earnings around $247, often with potential for optimization.
Average Monthly Airbnb Earnings Trend in Municipio de Dina Huapi
What Is the Monthly Airbnb Occupancy Rate in Municipio de Dina Huapi?
Maximize your bookings by understanding the Municipio de Dina Huapi STR occupancy trends. Seasonal demand shifts significantly influence how often properties are booked. Typically, Februarysees the highest demand (peak season occupancy), while May experiences the lowest (low season). Effective strategies, like adjusting minimum stays or offering promotions, can boost occupancy during slower periods. Here's how different property tiers perform in Municipio de Dina Huapi:
- Best-in-class properties (Top 10%) achieve 62%+ occupancy, indicating high desirability and potentially optimized availability.
- Strong performing properties (Top 25%) maintain 44% or higher occupancy, suggesting good market fit and guest satisfaction.
- Typical properties (Median) have an occupancy rate around 23%.
- Entry-level properties (Bottom 25%) average 13% occupancy, potentially facing higher vacancy.
Average Monthly Occupancy Rate Trend in Municipio de Dina Huapi
What Is the Average Airbnb Nightly Rate in Municipio de Dina Huapi?
Effective short term rental pricing strategy in Municipio de Dina Huapi involves understanding monthly ADR fluctuations. The Average Daily Rate (ADR) for Airbnb in Municipio de Dina Huapi typically peaks in July and dips lowest during November. Leveraging Airbnb dynamic pricing tools or strategies based on this seasonality can significantly boost revenue. Here's a look at the typical nightly rates achieved:
- Best-in-class properties (Top 10%) command rates of $170+ per night, often due to premium features or locations.
- Strong performing properties (Top 25%) achieve nightly rates of $88 or more.
- Typical properties (Median) charge around $64 per night.
- Entry-level properties (Bottom 25%) earn around $41 per night.
Average Daily Rate (ADR) Trend by Month in Municipio de Dina Huapi
What Is the RevPAR for Airbnb in Municipio de Dina Huapi?
RevPAR in Municipio de Dina Huapi is currently N/A. Because RevPAR combines nightly rates with realized occupancy, it is one of the cleanest ways to compare how efficiently listings turn demand into revenue across the market.
- Entry-level properties (Bottom 25%) see N/A RevPAR.
- Typical properties (Median) generate N/A RevPAR.
- Strong performers (Top 25%) earn N/A RevPAR.
- Best-in-class (Top 10%) achieve N/A RevPAR.
Average Monthly RevPAR Trend in Municipio de Dina Huapi
RevPAR Insights for Municipio de Dina Huapi
- RevPAR peaks in Jan and bottoms out in Jan, mirroring the broader seasonal demand pattern and suggesting opportunities for dynamic pricing.
Recommendations for Hosts
- Track your own RevPAR monthly against these Municipio de Dina Huapi benchmarks. If your RevPAR falls below the median of N/A, examine whether low occupancy or low ADR is the primary drag.
- Use RevPAR rather than revenue alone when comparing properties of different sizes — it normalizes for available nights and gives a more accurate picture of performance.
Get Live Municipio de Dina Huapi Market Intelligence 👇
Explore Real-time Analytics
When Is the Peak Season for Airbnb in Municipio de Dina Huapi?
Municipio de Dina Huapi's peak Airbnb season falls in November, October, July, while the softest stretch is May, August, September. Overall, the market shows highly seasonal trends requiring careful strategy, which should guide pricing, minimum stays, and cash-flow planning.
Peak Season (November, October, July)
- Revenue averages $1,686 per month
- Occupancy rates average 35.7%
- Daily rates average $80
Shoulder Season
- Revenue averages $1,002 per month
- Occupancy maintains around 32.2%
- Daily rates hold near $83
Low Season (May, August, September)
- Revenue drops to average $437 per month
- Occupancy decreases to average 20.1%
- Daily rates adjust to average $81
Seasonality Insights for Municipio de Dina Huapi
- Airbnb seasonality in Municipio de Dina Huapi is pronounced. Revenue swings sharply between peak and low months, which means pricing strategy, minimum-stay settings, and cash reserves all need to account for extended slower periods.
- During the high season, the absolute peak month showcases Municipio de Dina Huapi's highest earning potential, with monthly revenues climbing to $1,974, occupancy reaching 53.4%, and ADRs peaking at $93.
- Conversely, the slowest single month marks the market's lowest point — revenue may dip to $373, occupancy could drop to 12.9%, and ADRs may adjust to $73.
- Lower occupancy paired with meaningful seasonality means hosts in Municipio de Dina Huapi need to maximize every peak-season booking and seriously consider whether off-season pricing adjustments or minimum-stay changes can capture incremental revenue.
Seasonal Strategies for Maximizing Profit
- Peak Season: Maximize revenue through premium pricing and potentially longer minimum stays. Ensure high availability and consider tightening cancellation policies to reduce last-minute gaps.
- Low Season: Offer competitive pricing, extended-stay discounts, and flexible cancellation policies. Target off-season travelers like remote workers, budget-conscious guests, and travelers with flexible schedules.
- Shoulder Seasons: Implement dynamic pricing that bridges peak and low rates. Target weekend travelers, local events, and business visitors. Slightly more flexible terms than peak season can help maintain occupancy without deep discounting.
- In a highly seasonal market like Municipio de Dina Huapi, building a cash reserve during the top months is essential for covering fixed costs during the slow period. Automated pricing tools can help capture demand shifts in real time.
Do You Need a License for Airbnb in Municipio de Dina Huapi?
While Municipio de Dina Huapi, Río Negro Province, Argentina currently shows low STR regulations, 5% of listings carry registration evidence — suggesting some hosts proactively register or that certain neighborhoods have their own rules. Checking local zoning and tax obligations before listing is still wise. Always verify the latest short-term rental regulations and Airbnb license requirements directly with local government authorities for Municipio de Dina Huapi to ensure full compliance before hosting.
(Source: AirROI data, 2026, based on 5% licensed listings)
What Are the Best Neighborhoods for Airbnb in Municipio de Dina Huapi?
With a compact short-term rental market, Municipio de Dina Huapi gives early-mover hosts an advantage in the right neighborhoods. The areas listed below are where guest demand and local attractions converge — a useful lens for investors evaluating whether to enter this market and where to position their listing.
| Neighborhood / Area | Why Host Here? (Target Guests & Appeal) | Key Attractions & Landmarks |
|---|---|---|
| Dina Huapi Lakefront | A picturesque area along the shores of Lake Nahuel Huapi, perfect for nature lovers and water sports enthusiasts. This location offers beautiful views and access to outdoor activities year-round. | Lake Nahuel Huapi, Cerro Catedral, Parque Nacional Nahuel Huapi, Fishing and boating activities, Hiking trails |
| Dina Huapi Main Square | The central hub of Dina Huapi, where visitors can find local shops, restaurants, and cultural events. It’s a community gathering place that attracts both locals and tourists. | Local artisan markets, Cultural festivals, Municipal Theatre, Dining options |
| Cerro Ventana | A more secluded area known for its stunning mountain landscapes and tranquility. Perfect for those looking for a peaceful retreat with hiking and nature opportunities. | Cerro Ventana hiking trails, Scenic viewpoints, Wildlife watching, Picnic areas |
| Dina Huapi Golf Course | An attractive site for golf enthusiasts, offering a beautiful course with breathtaking views of the surrounding landscape. It is popular among both locals and visiting golfers. | Dina Huapi Golf Club, Golf tournaments, Clubhouse amenities |
| Rincón del Chicón | A scenic area located further from the urban center, perfect for travelers looking for a more rural and natural experience. This area provides a sense of escape and serenity. | Natural landscapes, Rural accommodations, Outdoor adventures |
| Puente de Dina Huapi | A historic bridge area that serves as a landmark for the community, offering great photo opportunities and access to nearby hiking and biking trails. | Historic bridge views, Walking and cycling trails, Nearby picnic spots |
| Cerro de la Ventana lookout | A vantage point offering panoramic views of the valleys and lakes, ideal for those seeking breathtaking scenery and photography opportunities. | Scenic overlooks, Photography spots, Hiking trails |
| Dina Huapi Cultural Center | A cultural hub that hosts workshops, exhibitions, and events throughout the year, attracting visitors interested in local arts and traditions. | Cultural events, Art exhibitions, Workshops and community events |
With 8 distinct neighborhoods showing meaningful short-term rental activity, Municipio de Dina Huapi offers diversification within a single market. Investors can tailor their strategy — from high-turnover tourist zones to quieter residential areas that attract longer stays and remote workers.
What Types of Properties Are on Airbnb in Municipio de Dina Huapi?
Room Type Distribution
Property Type Distribution
Market Composition Insights for Municipio de Dina Huapi
- The Municipio de Dina Huapi Airbnb market composition is heavily skewed towards Entire Home/Apt listings, which make up 100% of the 20 active rentals. This indicates strong guest preference for privacy and space.
- Looking at the property type distribution in Municipio de Dina Huapi, House properties are the most common (40%), reflecting the local real estate landscape.
- Houses represent a significant 40% portion, catering likely to families or larger groups.
Municipio de Dina Huapi Airbnb Room Capacity Analysis (2026): Bedroom Distribution
Distribution of Listings by Number of Bedrooms
Room Capacity Insights for Municipio de Dina Huapi
- The dominant room capacity in Municipio de Dina Huapi is 1 bedroom listings, making up 55% of the market. This suggests a strong demand for properties suitable for couples or solo travelers.
- Together, 1 bedroom and 2 bedrooms properties represent 85.0% of the active Airbnb listings in Municipio de Dina Huapi, indicating a high concentration in these sizes.
- With over half the market (55%) consisting of studios or 1-bedroom units, Municipio de Dina Huapi is particularly well-suited for individuals or couples.
Municipio de Dina Huapi Vacation Rental Guest Capacity Trends (2026)
Distribution of Listings by Guest Capacity
Guest Capacity Insights for Municipio de Dina Huapi
- The most common guest capacity trend in Municipio de Dina Huapi vacation rentals is listings accommodating 2 guests (30%). This suggests the primary traveler segment is likely couples or solo travelers.
- Properties designed for 2 guests and 4 guests dominate the Municipio de Dina Huapi STR market, accounting for 55.0% of listings.
- 15.0% of properties accommodate 6+ guests, serving the market segment for larger families or group travel in Municipio de Dina Huapi.
- On average, properties in Municipio de Dina Huapi are equipped to host 4.0 guests.
What Amenities Do Airbnb Guests Expect in Municipio de Dina Huapi?
Amenity Prevalence
Amenity Insights for Municipio de Dina Huapi
- Essential amenities in Municipio de Dina Huapi that guests expect include: Wifi, Kitchen, Free parking on premises, TV. Lacking these (any) could significantly impact bookings.
- Popular amenities like BBQ grill, Cooking basics, Heating are common but not universal. Offering these can provide a competitive edge.
Recommendations for Hosts
- Ensure your listing includes all essential amenities for Municipio de Dina Huapi: Wifi, Kitchen, Free parking on premises, TV.
- Prioritize adding missing essentials: Free parking on premises, TV.
- Consider adding popular differentiators like BBQ grill or Cooking basics to increase appeal.
- Highlight unique or less common amenities you offer (e.g., hot tub, dedicated workspace, EV charger) in your listing description and photos.
- Regularly check competitor amenities in Municipio de Dina Huapi to stay competitive.
Dive Deeper: Advanced Municipio de Dina Huapi STR Market Data (2026)
Ready to unlock more insights? AirROI provides access to advanced metrics and comprehensive Airbnb data for Municipio de Dina Huapi. Explore detailed analytics beyond this report to refine your investment strategy, optimize pricing, and maximize your vacation rental profits.
Explore Advanced MetricsMunicipio de Dina Huapi Airbnb Guest Demographics & Profile Analysis (2026)
Guest Profile Summary for Municipio de Dina Huapi
- The typical guest profile for Airbnb in Municipio de Dina Huapi consists of a mix of domestic (43%) and international guests, with top international origins including Germany, typically belonging to the Post-2000s (Gen Z/Alpha) group (50%), primarily speaking English or Spanish.
- Domestic travelers account for 42.9% of guests.
- Key international markets include Argentina (42.9%) and Germany (10.7%).
- Top languages spoken are English (36.4%) followed by Spanish (30.3%).
- A significant demographic segment is the Post-2000s (Gen Z/Alpha) group, representing 50% of guests.
Recommendations for Hosts
- Balance marketing efforts between domestic and international channels based on the guest mix.
- Tailor amenities and listing descriptions to appeal to the dominant Post-2000s (Gen Z/Alpha) demographic (e.g., highlight fast WiFi, smart home features, local guides).
- Highlight unique local experiences or amenities relevant to the primary guest profile.
- Consider seasonal promotions aligned with peak travel times for key origin markets.
Municipio de Dina Huapi Airbnb Booking Patterns (2026): Available vs. Booked Days
Available Days Distribution
Booked Days Distribution
Booking Pattern Insights for Municipio de Dina Huapi
- The most common availability pattern in Municipio de Dina Huapi falls within the 271-366 days range, representing 85% of listings. This suggests many properties have significant open periods on their calendars.
- Approximately 95.0% of listings show high availability (181+ days open annually), indicating potential for increased bookings or specific owner usage patterns.
- For booked days, the 31-90 days range is most frequent in Municipio de Dina Huapi (50%), reflecting common guest stay durations or potential owner blocking patterns.
- A notable 5.0% of properties secure long booking periods (181+ days booked per year), highlighting successful long-term rental strategies or significant owner usage.
How Far in Advance Do Guests Book Airbnb in Municipio de Dina Huapi?
Average Booking Lead Time by Month
Booking Lead Time Insights for Municipio de Dina Huapi
- The overall average booking lead time for vacation rentals in Municipio de Dina Huapi is 32 days.
- Guests book furthest in advance for stays during November (average 69 days), likely coinciding with peak travel demand or local events.
- The shortest booking windows occur for stays in September (average 12 days), indicating more last-minute travel plans during this time.
- Seasonally, Fall (45 days avg.) sees the longest lead times, while Spring (25 days avg.) has the shortest, reflecting typical travel planning cycles.
Recommendations for Hosts
- Use the overall average lead time (32 days) as a baseline for your pricing and availability strategy in Municipio de Dina Huapi.
- For November stays, consider implementing length-of-stay discounts or slightly higher rates for bookings made less than 69 days out to capitalize on advance planning.
- During September, focus on last-minute booking availability and promotions, as guests book with very short notice (12 days avg.).
- Target marketing efforts for the Fall season well in advance (at least 45 days) to capture early planners.
- Monitor your own booking lead times against these Municipio de Dina Huapi averages to identify opportunities for dynamic pricing adjustments.
Municipio de Dina Huapi Airbnb Minimum Stay Requirements Analysis
Distribution of Listings by Minimum Night Requirement
1 Night
8 listings
40% of total
2 Nights
3 listings
15% of total
3 Nights
2 listings
10% of total
4-6 Nights
1 listings
5% of total
30+ Nights
6 listings
30% of total
Key Insights
- The most prevalent minimum stay requirement in Municipio de Dina Huapi is 1 Night, adopted by 40% of listings. This highlights the market's preference for shorter, flexible bookings.
- A significant segment (30%) caters to monthly stays (30+ nights) in Municipio de Dina Huapi, pointing to opportunities in the extended-stay market.
Recommendations
- Align with the market by considering a 1 Night minimum stay, as 40% of Municipio de Dina Huapi hosts use this setting.
- Explore offering discounts for stays of 30+ nights to attract the 30% of the market seeking extended stays.
- Adjust minimum nights based on seasonality – potentially shorter during low season and longer during peak demand periods in Municipio de Dina Huapi.
Municipio de Dina Huapi Airbnb Cancellation Policy Trends Analysis (2026)
Limited
3 listings
15% of total
Flexible
7 listings
35% of total
Moderate
1 listings
5% of total
Firm
9 listings
45% of total
Cancellation Policy Insights for Municipio de Dina Huapi
- The prevailing Airbnb cancellation policy trend in Municipio de Dina Huapi is Firm, used by 45% of listings.
- There's a relatively balanced mix between guest-friendly (40.0%) and stricter (45.0%) policies, offering choices for different guest needs.
Recommendations for Hosts
- Consider adopting a Firm policy to align with the 45% market standard in Municipio de Dina Huapi.
- Regularly review your cancellation policy against competitors and market demand shifts in Municipio de Dina Huapi.
What Do the Top Airbnb Listings in Municipio de Dina Huapi Look Like?
Benchmark your potential! Explore examples of top-performing Airbnb properties in Municipio de Dina Huapibased on Trailing Twelve Month (TTM) revenue. Analyze their characteristics, revenue, occupancy rate, and ADR to understand what drives success in this market.
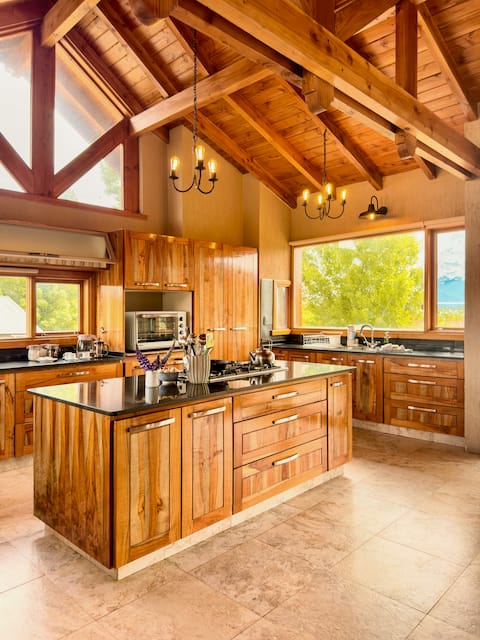
Los Maitenes by the Lake
Entire Place • 4 bedrooms
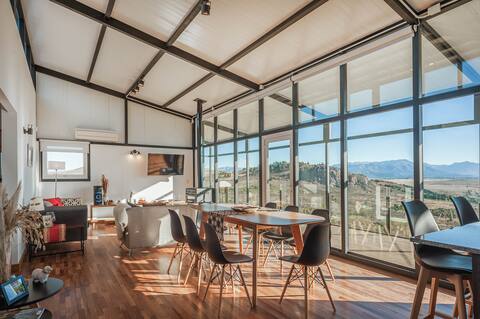
Peace of mind in Patagonia.
Entire Place • 3 bedrooms
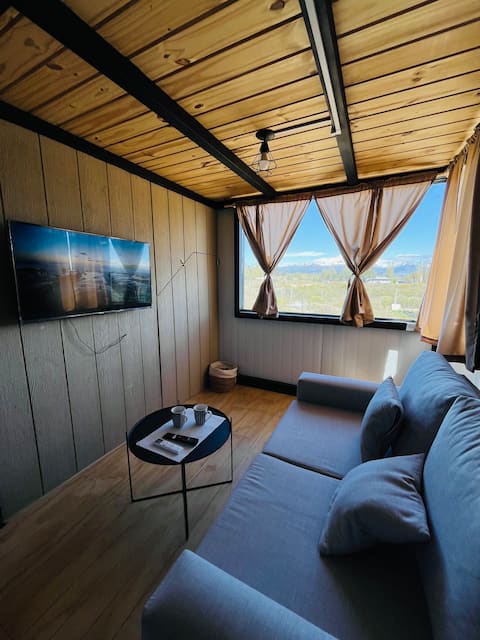
Cipres Loft PB Garden View, close to Pool
Entire Place • 1 bedroom
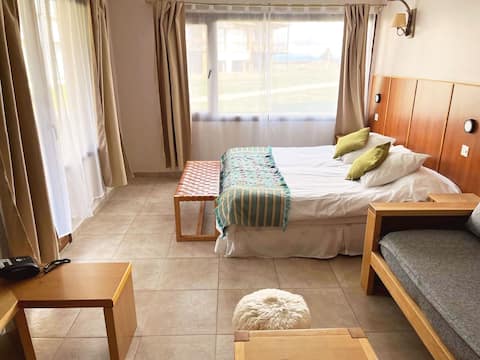
A little house one block from the lake
Entire Place • 1 bedroom
Cabin No. 1 (Rustic).
Entire Place • 2 bedrooms

Mascardi Mirador 1st Floor Lake View Bariloche
Entire Place • 1 bedroom
Note: Performance varies based on location, size, amenities, seasonality, and management quality. Data reflects the past 12 months.
Who Are the Top Airbnb Hosts in Municipio de Dina Huapi?
Learn from the best! This table showcases top-performing Airbnb hosts in Municipio de Dina Huapi based on the number of properties managed and estimated total revenue over the past year. Analyze their scale and performance metrics.
| Host Name | Properties | Grossing Revenue | Stay Reviews | Avg Rating |
|---|---|---|---|---|
| Edward | 1 | $46,473 | 15 | 4.87/5.0 |
| Matias | 2 | $14,639 | 9 | 5.00/5.0 |
| Romina | 2 | $14,329 | 3 | Not Rated |
| Florencia | 1 | $8,582 | 43 | 4.67/5.0 |
| Facundo | 1 | $6,102 | 3 | 5.00/5.0 |
| Pablo Gustavo | 2 | $4,993 | 9 | 4.83/5.0 |
| Jorge Mario | 1 | $4,615 | 2 | Not Rated |
| Luciana | 1 | $3,851 | 5 | 4.60/5.0 |
| Alejandro | 1 | $3,667 | 12 | 4.83/5.0 |
| Nestor | 3 | $3,279 | 42 | 4.81/5.0 |
Analyzing the strategies of top hosts, such as their property selection, pricing, and guest communication, can offer valuable lessons for optimizing your own Airbnb operations in Municipio de Dina Huapi.
How Does Municipio de Dina Huapi's Airbnb Market Compare to Nearby Cities?
How does the Municipio de Dina Huapi Airbnb market stack up against its neighbors? Compare key performance metrics like average monthly revenue, ADR, and occupancy rates in surrounding areas to understand the broader regional STR landscape.
Compared with San Carlos de Bariloche, Municipio de Dina Huapi has 9 percentage points lower occupancy and about $38 lower ADR. That helps frame whether this market is winning more on demand, pricing, or both.
| Market | Active Properties | Monthly Revenue | Daily Rate | Avg. Occupancy |
|---|---|---|---|---|
| El Trébol | 11 | $1,292 | $220.51 | 37% |
| Lácar Department | 11 | $1,091 | $136.66 | 31% |
| Villa La Angostura | 137 | $1,011 | $151.75 | 35% |
| Municipio de Villa La Angostura | 397 | $992 | $155.66 | 33% |
| Municipio de San Martín de los Andes | 54 | $988 | $210.30 | 31% |
| San Carlos de Bariloche | 4,149 | $985 | $123.62 | 41% |
| Villa Catedral | 38 | $984 | $168.75 | 37% |
| Municipio de San Carlos de Bariloche | 86 | $937 | $144.57 | 35% |
| San Martín de los Andes | 917 | $755 | $115.11 | 35% |
| Puerto Varas | 1,250 | $660 | $102.65 | 38% |
Frequently Asked Questions About Airbnb in Municipio de Dina Huapi
These quick answers summarize the most common investor and operator questions using AirROI's latest market data for Municipio de Dina Huapi.
How much do Airbnb hosts make in Municipio de Dina Huapi?
Municipio de Dina Huapi hosts earn about $5,929 per year on average, with an average nightly rate of $85 and RevPAR of N/A. Those figures describe the typical revenue environment for active listings in Municipio de Dina Huapi, Río Negro Province, not the ceiling for the best operators. Source: AirROI 2026 data, Municipio de Dina Huapi market, February 2025 to January 2026.
What is the average Airbnb occupancy rate in Municipio de Dina Huapi?
The average Airbnb occupancy rate in Municipio de Dina Huapi is 31.6%. November is the strongest month and September is the softest, so hosts should expect demand to move meaningfully throughout the year rather than stay flat.
What is the average Airbnb daily rate in Municipio de Dina Huapi?
Listings in Municipio de Dina Huapi average $85 per night. The broader pricing spread also matters: lower-performing listings cluster closer to the lower quartiles, while premium homes can price materially above the city average when demand spikes or listing quality stands out.
How many Airbnb listings are active in Municipio de Dina Huapi?
Municipio de Dina Huapi currently has about 20 active Airbnb listings in AirROI's market dataset. That supply count helps explain how competitive the market is, how much depth there is for benchmarking, and whether the market behaves like a niche destination or a scaled urban market.
How strict are short-term rental regulations in Municipio de Dina Huapi?
AirROI currently classifies the short-term rental regulation level in Municipio de Dina Huapi as Low. The dataset also shows about 5.0% of listings with registration evidence. That is a market signal, not legal advice, so hosts should still confirm current licensing and compliance rules locally before listing.
What is the RevPAR for Airbnb in Municipio de Dina Huapi?
RevPAR in Municipio de Dina Huapi is about N/A. That metric combines pricing and occupancy into one efficiency number, so it is often a better quick benchmark than ADR alone when investors want to compare how well listings convert nightly rates into realized revenue.
Is Airbnb profitable in Municipio de Dina Huapi?
Occupancy of 31.6% means Municipio de Dina Huapi is a more selective market. Profitability is achievable but requires careful cost management, premium positioning, or targeting longer stays to reduce turnover. Average annual revenue is $5,929, but individual returns depend on property type, location within the city, and the host's operating efficiency.
How far in advance do guests book Airbnb in Municipio de Dina Huapi?
The average booking lead time in Municipio de Dina Huapi is about 32 days — a moderate lead time that gives hosts planning visibility while still benefiting from last-minute bookings. Hosts who understand their market's booking cadence can adjust minimum stays and pricing windows accordingly.
What are the best neighborhoods for Airbnb in Municipio de Dina Huapi?
Based on AirROI's analysis, some of the top neighborhoods for short-term rentals in Municipio de Dina Huapi include Dina Huapi Lakefront, Dina Huapi Main Square, Cerro Ventana. Each area attracts different guest profiles — from business travelers to leisure visitors — so the best location depends on the property type and target audience a host is aiming for. See the full neighborhood breakdown above.
What type of property performs best on Airbnb in Municipio de Dina Huapi?
entire_home listings make up 100.0% of the active supply in Municipio de Dina Huapi. The most common configuration does not always mean the most profitable — operators who identify underserved property types or bedroom counts can sometimes outperform the market average by filling a gap in local supply.
How does Municipio de Dina Huapi compare to nearby Airbnb markets?
Among neighboring markets, El Trébol posts $15,500 in average annual revenue with 36.6% occupancy, compared to Municipio de Dina Huapi's $5,929 and 31.6%. Comparing nearby markets helps investors understand whether a destination's performance reflects local demand or broader regional trends.
When is the peak season for Airbnb in Municipio de Dina Huapi?
November is the highest-revenue month in Municipio de Dina Huapi, while September is the softest. The revenue spread between them indicates a highly seasonal market — revenue in the peak month is more than double the low month, so cash-flow planning and pricing automation are critical.
About AirROI Market Data
AirROI tracks over 20 million properties across 190+ countries and maintains 15+ years of historical performance data, making it one of the deepest Airbnb and STR intelligence platforms available. The analytics pipeline aggregates listing-level data monthly — revenue, occupancy, nightly rates, RevPAR, guest demographics, booking patterns, and competitive supply — so investors and operators can benchmark any market against its own history and against neighboring destinations.
Real estate investors, property managers, financial institutions, hedge funds, tourism boards, hospitality consultants, tech platforms, and academic researchers rely on AirROI data to underwrite acquisitions, optimize pricing, model macro trends, and conduct peer-reviewed research. Data is available through in-depth market reports like this one and the Airbnb API with 22 endpoints and an Airbnb MCP Server for AI agents.
AirROI proprietary analytics as of 2026-01-31. Metrics reflect trailing twelve-month aggregates from active listings. Revenue figures are market averages, not projections. Neighborhood descriptions are AI-generated and reviewed for accuracy. For full methodology, see the data methodology page.