Airbnb market data · 202512 months to May 2025
Nørre Lyngvig, Denmark Airbnb Market Data: Revenue, Occupancy & Trends
The average Airbnb in Nørre Lyngvig brought in kr 44,637 over the 12 months through May 2025, across just 23 active listings, so a single property can move that figure.
AirROI's latest figures for Nørre Lyngvig run through May 2025.
The short answer
Nørre Lyngvig Airbnb Market at a Glance
Listings averaged kr 1,370 a night and were booked on 26% of available nights.
Timing matters: in April, the best month, the average listing earned about five times as much as in November, the slowest. With only 23 active listings, a few bookings can reorder the months.
With 23 active listings, Nørre Lyngvig is the 50th-largest of 74 Central Denmark Region markets AirROI tracks.
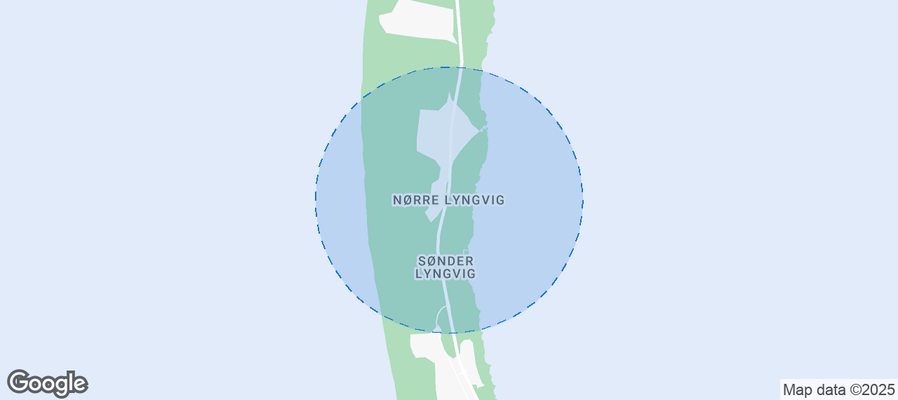 Browse the live Nørre Lyngvig Airbnb market See Every Nørre Lyngvig Listing
Revenue
How Much Do Airbnb Hosts Make in Nørre Lyngvig?
Gross bookings per Nørre Lyngvig listing averaged kr 44,637 over the 12 months to May 2025 (Central Denmark Region average: kr 101,573), before cleaning, platform and management costs and taxes.
The average Nørre Lyngvig listing brought in kr 28,000 in April, its best month, and kr 5,620 in November, its slowest. The three strongest months bring in 39% of a full year's revenue, where an even calendar would give any three months 25%.
Across Nørre Lyngvig's 23 active listings, monthly revenue by tier:
- Best-in-class properties (top 10%) earn kr 30,600+ a month, about 2.8 times the typical property.
- Strong performers (top 25%) earn kr 17,800 or more, roughly kr 6,700 a month above the median.
- Typical properties (median) earn about kr 11,100 a month.
- Entry-level properties (bottom 25%) earn kr 5,200 or less, about half of the median.
These are monthly figures for listings active in each month. The annual average above also counts listings that operated for only part of the year, so it runs below twelve times these figures.
April earned about five times what November did
Average revenue per active listing, by month
The dashed line is the average of the months shown, kr 13,500.
Nørre Lyngvig Airbnb Data by Month
Latest 12 months in the May 2025 data.
April led on revenue and bookings; nightly rates peaked in February.
| Month | Avg. Revenue | Occupancy | Avg. Nightly Rate | Booking Lead Time |
|---|---|---|---|---|
| Jun 2024 | kr 8,915 | 24.4% | kr 1,690 | 156 days |
| Jul 2024 | kr 12,884 | 33.1% | kr 1,703 | 138 days |
| Aug 2024 | kr 13,089 | 36.3% | kr 1,706 | 171 days |
| Sep 2024 | kr 12,643 | 35.7% | kr 1,692 | 190 days |
| Oct 2024 | kr 9,919 | 24.9% | kr 1,715 | 212 days |
| Nov 2024 | kr 5,618 | 17.9% | kr 1,738 | 153 days |
| Dec 2024 | kr 8,939 | 17.8% | kr 1,749 | 27 days |
| Jan 2025 | kr 11,371 | 21.8% | kr 1,555 | 17 days |
| Feb 2025 | kr 19,449 | 26.6% | kr 1,774 | 16 days |
| Mar 2025 | kr 16,283 | 27.3% | kr 1,702 | 28 days |
| Apr 2025 | kr 27,990 | 46.7% | kr 1,729 | 95 days |
| May 2025 | kr 14,599 | 23.7% | kr 1,739 | 111 days |
Averages per active listing in each month. Highlighted: the highest-revenue month. Booking lead time is the days between booking and check-in for stays in that month.
These are market-wide figures. To see what one particular Nørre Lyngvig home could earn, enter its address, bedrooms and guests in the Airbnb calculator; it compares the home with similar listings nearby.
Profit
Is an Airbnb in Nørre Lyngvig Profitable?
Yes, when it's run well. The average Nørre Lyngvig Airbnb took in kr 44,637 in the 12 months to May 2025, an average that counts every active listing, including those open only part of the year. A listing in the top quarter took in about kr 71,730, and run by its owner at everyday costs, about kr 4,400 a month of that is left after running costs, so a home that costs less than that to own or rent makes money.
These amounts come before housing costs. Where the mortgage or rent is less each month, the difference is profit; a home owned outright keeps it all after property tax, home insurance and any building or condo fees.
Nørre Lyngvig Airbnb Income, Expenses and Profit per Year
| Line | Average listing | Top-quarter listing |
|---|---|---|
| Money in | ||
| Gross bookings | kr 44,637 | kr 71,730 |
| Running costs | ||
| Airbnb's fee15.5% of bookings, Airbnb's standard host-only fee | −kr 6,920 | −kr 11,120 |
| Utilities and internetAbout 5% of bookings | −kr 2,230 | −kr 3,590 |
| Guest suppliesToiletries, coffee, paper goods: about 2% | −kr 890 | −kr 1,430 |
| Repairs and upkeepIncluding linens and small replacements: about 3% | −kr 1,340 | −kr 2,150 |
| Short-term rental insuranceOne policy, on top of Airbnb's free AirCover | −kr 450 | −kr 450 |
| Permit and registrationWhere one is required | −kr 220 | −kr 220 |
| Managementkr 0 when you run it; co-hosts charge from about 10% of nightly bookings | kr 0 | kr 0 |
| Pricing and messaging toolsOptional; Airbnb's own tools are free | kr 0 | kr 0 |
| Lodging taxesAdded to the guest's bill and passed on | kr 0 | kr 0 |
| Total running costsAbout 27% of bookings | −kr 12,050 | −kr 18,960 |
| Left for housing costs, then profit | kr 32,587about kr 2,720 a month | kr 52,770about kr 4,400 a month |
| Housing costs | ||
| Mortgage or rent, property tax, home insurance, building or condo fees | Depend on the home | |
Estimate Your Own Nørre Lyngvig Airbnb Profit
The estimate starts from Nørre Lyngvig's average listing, run by its owner. Change how the listing performs, who runs it and who cleans to see what is left for the mortgage or rent.
To work out the profit on one Nørre Lyngvig home, with its price, its mortgage or rent and your own costs, use the Airbnb profit calculator. It starts from the comparable listings around the address.
How Nørre Lyngvig's Top Earners Get There
- More nights booked. The busiest quarter of Nørre Lyngvig listings are booked on 39% or more of their nights, against 23% for the median listing. Ten more booked nights a year at the median rate of kr 1,405 adds about kr 14,100 in bookings.
- Prices that follow demand. Ranked by price, the top quarter charge kr 1,825 a night or more, against a median of kr 1,405. That is a separate ranking from the busiest quarter, so the two marks don't multiply into one listing's takings. For the average listing, a 10% higher rate on the nights it already books adds about kr 4,460 a year.
- Open for the busy months. April brought the average listing about kr 28,000, against kr 5,620 in November, so a calendar that is open and full in the busy months carries the year.
What a listing keeps comes down to the figures this page measures: nightly rate, nights booked and the months it's open. A listing at the top-quarter mark takes in about kr 5,980 a month, against kr 3,720 for the average one.
Occupancy
What Is the Airbnb Occupancy Rate in Nørre Lyngvig?
Nørre Lyngvig listings were booked on 26% of the nights they were open over the past year, 13 percentage points below the Central Denmark Region average (39%) and 15 points below the Denmark average (41%). Occupancy swings from 18% in December to 47% in April.
Across Nørre Lyngvig's 23 active listings, the share of open nights booked by tier:
- Best-in-class properties (top 10%) are booked 52%+ of open nights, 29 points above the median.
- Strong performers (top 25%) fill 39% or more, roughly two and a half nights a week.
- Typical properties (median) fill about 23% of open nights.
- Entry-level properties (bottom 25%) fill 14% or less, less than one night a week.
April was the busiest month in Nørre Lyngvig, December the quietest
Share of open nights booked, by month
The 12-month rate of 26% averages each listing's whole year, slow months included; each month here counts only the listings booked in it.
Nightly rates
How Much Does an Airbnb Cost per Night in Nørre Lyngvig?
The average nightly rate in Nørre Lyngvig, known as ADR (average daily rate), was kr 1,370 over the past year, about 9% above the Central Denmark Region average of kr 1,260 and about the same as the Denmark average (kr 1,435). Averaged month by month, rates peak in February and December at about kr 1,775 and bottom out in January at about kr 1,555.
Across Nørre Lyngvig's 23 active listings, nightly rates by tier:
- Best-in-class properties (top 10%) charge kr 2,645+ a night, about 1.9 times the median.
- Strong performers (top 25%) charge kr 1,825 or more, about kr 420 above the median.
- Typical properties (median) charge about kr 1,405 a night.
- Entry-level properties (bottom 25%) charge kr 1,090 or less, about three-quarters of the median.
February rates ran 14% above January's
Average nightly rate (ADR), by month
The dashed line is the average of the months shown, kr 1,710. The 12-month ADR of kr 1,370 averages each listing's own rate across its whole year; the monthly points average listings month by month, so the two differ.
Seasonality
Best and Worst Months for Airbnb in Nørre Lyngvig
With only 23 active listings, the monthly pattern in Nørre Lyngvig is noisy, since a few long or pricey stays can lift a month; revenue peaked in April and bottomed out in November.
How Far in Advance Do Guests Book Airbnb in Nørre Lyngvig?
Guests book Nørre Lyngvig stays 62 days ahead on average (about nine weeks), so guests here plan well ahead. October stays are booked furthest out, about 212 days ahead, and February stays closest to arrival, about 16 days. A typical October booking is made in mid-March.
October stays are booked furthest ahead
Average days between booking and check-in, by month of stay
The 12-month figure of 62 days averages each listing's year as a whole; each month here averages only the listings with stays in it.
Permits
Airbnb Permits and Registration in Nørre Lyngvig
None of the 23 active listings in Nørre Lyngvig display a registration, permit or license number. That doesn't mean no rules apply: some places don't ask hosts to show a number on the listing, and listing data doesn't capture every scheme.
Registration, permit, zoning and tourist-tax rules vary by address and change often, so confirm them with the local authority before buying or listing in Nørre Lyngvig.
Neighborhoods
Best Neighborhoods for Airbnb in Nørre Lyngvig
AirROI's area guide picks six Nørre Lyngvig neighborhoods that draw short-term rental guests, led by Lyngvig, Nørre Lyngvig Strand and Ringkøbing Fjord. The picks reflect guest appeal, not earnings data or permit eligibility, so check local permit rules for a specific address before buying.
| Area | Who it suits | Landmarks nearby |
|---|---|---|
| Lyngvig | A picturesque beach area with stunning views and a tranquil atmosphere. Ideal for families and couples looking for a relaxing getaway by the sea. | Lyngvig Lighthouse, Hvide Sande Fishing Harbour, The North Sea, Local beach activities, Nature reserves, Cycling routes |
| Nørre Lyngvig Strand | Known for its beautiful sandy beaches and natural surroundings, this area attracts tourists who love outdoor activities and beach life. | Nørre Lyngvig Beach, Dune areas, Wind surfing spots, Nature reserves, Beach cafes |
| Ringkøbing Fjord | A stunning coastal region perfect for water sports enthusiasts, such as kite surfing, sailing, and fishing. Attracts a diverse range of visitors. | Ringkøbing Fjord, Kite surfing, Sailing, Fishing opportunities, Nature experiences |
| Holmsland Klit | A unique stretch of land known for its beautiful beaches and dunes, appealing to those looking for scenic landscapes and outdoor activities. | Holmsland Dunes, Nature reserves, Cycling and walking trails, Bird watching areas |
| Klegod | A quaint location known for its peacefulness and proximity to the beach, suitable for families and nature lovers seeking a quiet retreat. | Quiet beaches, Nature walks, Cycling paths |
| Fjaltring | A small village offering a rural feel with direct access to the coast and beautiful landscapes, ideal for those wanting to escape the hustle and bustle. | Coastal scenery, Local farms, Walking routes, Tranquil environment |
Area descriptions are AI-assisted from public sources and are not checked against zoning.
Nearby markets
Nørre Lyngvig vs. Nearby Airbnb Markets
Of the eight nearby markets in the table, all within 46 km, Ulfborg (27 km away, 60 listings) earned the most per listing, about four times as much as Nørre Lyngvig. Hvide Sande was the busiest, booked on 45% of nights against 26% in Nørre Lyngvig.
| Market | Listings | Avg. annual revenue | Avg. nightly rate | Occupancy |
|---|---|---|---|---|
| Søndervig 8 km | 41 | kr 130,538 | kr 2,477 | 25% |
| Hvide Sande 8 km | 62 | kr 149,442 | kr 1,369 | 45% |
| Ringkøbing-Skjern Municipality 12 km | 232 | kr 127,491 | kr 1,698 | 37% |
| Bork Havn 26 km | 57 | kr 70,418 | kr 1,191 | 32% |
| Ulfborg 27 km | 60 | kr 180,693 | kr 1,816 | 37% |
| Holstebro Municipality 33 km | 73 | kr 86,359 | kr 1,196 | 34% |
| Varde Municipality 44 km | 140 | kr 85,387 | kr 1,489 | 31% |
| Holstebro 46 km | 69 | kr 65,555 | kr 891 | 33% |
Other Airbnb Markets in Central Denmark Region
- Aarhus Airbnb data 1,322 listings
- Syddjurs Municipality Airbnb data 377 listings
- Herning Airbnb data 254 listings
- Ebeltoft Airbnb data 211 listings
- Silkeborg Airbnb data 141 listings
- Horsens Airbnb data 114 listings
- Samsø Municipality Airbnb data 113 listings
- Randers Airbnb data 111 listings
See all 74 Central Denmark Region Airbnb markets
Markets Similar to Nørre Lyngvig
Markets elsewhere in Denmark with a similar nightly rate and occupancy to Nørre Lyngvig:
- Frederikshavn Municipality Airbnb data Denmark · kr 1,499/night · 31.5%
FAQ
Nørre Lyngvig Airbnb FAQ
How much do Airbnb hosts make in Nørre Lyngvig?
An active Nørre Lyngvig Airbnb grossed kr 44,637 on average in the 12 months to May 2025, according to AirROI's tracking of 23 active listings. That is before cleaning, management, taxes and financing. Busier, better-run listings do far better: the top quarter took in kr 17,800 or more in a typical month.
How much can I make on Airbnb in Nørre Lyngvig?
It depends most on the home's size, location and how it's run. The middle half of Nørre Lyngvig listings earn between kr 5,200 and kr 17,800 in a typical month, and the top tenth kr 30,600 or more. For one home, enter its address and bedroom count in the Airbnb income calculator: it compares the home with similar listings nearby.
What is the average Airbnb occupancy rate in Nørre Lyngvig?
Listings in Nørre Lyngvig were booked on 26% of available nights over the past year. That compares with 39% for the Central Denmark Region average. April was the busiest month.
How much does an Airbnb cost per night in Nørre Lyngvig?
The average booked night in Nørre Lyngvig cost kr 1,370 before fees. Half of listings charge between kr 1,090 and kr 1,825, so bedroom count and location move the price more than the average suggests.
Do you need a permit for an Airbnb in Nørre Lyngvig?
None of the active Nørre Lyngvig listings display a registration, permit or license number. That doesn't mean no rules apply, so confirm registration, permit and tourist-tax rules with the local authority before buying.
Is Airbnb profitable in Nørre Lyngvig?
Yes, when it's run well. The average Nørre Lyngvig Airbnb grossed kr 44,637 in the 12 months to May 2025, 56% below the Central Denmark Region average of kr 101,573, though with only 23 active listings a single property can move that figure, counting listings open only part of the year. A listing at the top-quarter mark, run by its owner with everyday costs for Airbnb's fee, utilities, supplies, upkeep and insurance, has about kr 4,400 a month left before the mortgage or rent, so a home that costs less than that to own or rent makes a profit. Check a specific home in the Airbnb estimator.
When is Airbnb peak season in Nørre Lyngvig?
April paid best over the past year, at kr 28,000 per active listing, and November paid least. The month-by-month table above shows how rates and bookings each move.
How far in advance do guests book Airbnbs in Nørre Lyngvig?
Nørre Lyngvig stays were booked 62 days (about nine weeks) before arrival on average over the past year, so a listing that opens its calendar late misses many bookings.
What are the best neighborhoods for Airbnb in Nørre Lyngvig?
Lyngvig, Nørre Lyngvig Strand and Ringkøbing Fjord draw the most short-term rental interest in Nørre Lyngvig. The neighborhood guide explains what brings guests to each.
How many Airbnbs are there in Nørre Lyngvig?
AirROI counted 23 active Airbnb listings in Nørre Lyngvig as of May 2025. The closest tracked market is Søndervig, 8 km away.
Method
About This Data
Figures on this page cover 23 active Airbnb listings in Nørre Lyngvig from June 2024 to May 2025 (trailing twelve months). AirROI refreshes them monthly from listing-level booking and calendar data covering 20+ million properties worldwide. AirROI measures bookings in US dollars; this page shows them in Danish kroner at kr 6.44 per US$, the typical rate from November 2025 to October 2026. Annual revenue averages every listing active during the period, including those listed for only part of it; monthly figures average the listings active in each month; the tier lists show the spread. Neighborhood descriptions are AI-assisted. See the methodology for definitions.
Need this programmatically? The same metrics are available through the AirROI Airbnb Data API and bulk downloads in the data portal.