Øster Knasborg, North Denmark Region Airbnb Market Data 2026: STR Report & Statistics
How much can you earn on Airbnb in Øster Knasborg, North Denmark Region? Based on AirROI's 2026 dataset (March 2025 – February 2026), the short answer is $25,991 per year — at a $405 nightly rate, 39.2% occupancy, and a N/A RevPAR.
With just 18 active listings, Øster Knasborg is a micro-market where moderate demand with room for well-positioned listings to outperform. Supply grew 28.6% over the past year, yet revenue and nightly rates both trended upward — a signal that traveler demand is outpacing new inventory rather than being diluted by it. For hosts, pricing power remains intact even as competition increases.
Regulation is low with minimal registration requirements, pointing to an operator-friendly environment. In a market this size, differentiated listings with strong reviews can capture outsized returns relative to the competition.
Table of Contents [hide] [show]
What Are the Key Airbnb Metrics in Øster Knasborg?
In Øster Knasborg, the headline Airbnb metrics are $25,991 in average annual revenue,39.2% occupancy, $405 ADR, and $0 in RevPAR, and guests book about 100 days in advance.
How Much Do Airbnb Hosts Earn Monthly in Øster Knasborg?
Understanding the monthly revenue variations for Airbnb listings in Øster Knasborg is key to maximizing your short term rental income potential. Seasonality significantly impacts earnings. Our analysis, based on data from the past 12 months, shows that the peak revenue month for STRs in Øster Knasborg is typically July, while January often presents the lowest earnings, highlighting opportunities for strategic pricing adjustments during shoulder and low seasons. Explore the typical Airbnb income in Øster Knasborg across different performance tiers:
- Best-in-class properties (Top 10%) achieve $8,030+ monthly, often utilizing dynamic pricing and superior guest experiences.
- Strong performing properties (Top 25%) earn $4,474 or more, indicating effective management and desirable locations/amenities.
- Typical properties (Median) generate around $2,650 per month, representing the average market performance.
- Entry-level properties (Bottom 25%) see earnings around $1,454, often with potential for optimization.
Average Monthly Airbnb Earnings Trend in Øster Knasborg
What Is the Monthly Airbnb Occupancy Rate in Øster Knasborg?
Maximize your bookings by understanding the Øster Knasborg STR occupancy trends. Seasonal demand shifts significantly influence how often properties are booked. Typically, Julysees the highest demand (peak season occupancy), while January experiences the lowest (low season). Effective strategies, like adjusting minimum stays or offering promotions, can boost occupancy during slower periods. Here's how different property tiers perform in Øster Knasborg:
- Best-in-class properties (Top 10%) achieve 65%+ occupancy, indicating high desirability and potentially optimized availability.
- Strong performing properties (Top 25%) maintain 52% or higher occupancy, suggesting good market fit and guest satisfaction.
- Typical properties (Median) have an occupancy rate around 34%.
- Entry-level properties (Bottom 25%) average 24% occupancy, potentially facing higher vacancy.
Average Monthly Occupancy Rate Trend in Øster Knasborg
What Is the Average Airbnb Nightly Rate in Øster Knasborg?
Effective short term rental pricing strategy in Øster Knasborg involves understanding monthly ADR fluctuations. The Average Daily Rate (ADR) for Airbnb in Øster Knasborg typically peaks in November and dips lowest during May. Leveraging Airbnb dynamic pricing tools or strategies based on this seasonality can significantly boost revenue. Here's a look at the typical nightly rates achieved:
- Best-in-class properties (Top 10%) command rates of $701+ per night, often due to premium features or locations.
- Strong performing properties (Top 25%) achieve nightly rates of $540 or more.
- Typical properties (Median) charge around $222 per night.
- Entry-level properties (Bottom 25%) earn around $149 per night.
Average Daily Rate (ADR) Trend by Month in Øster Knasborg
What Is the RevPAR for Airbnb in Øster Knasborg?
RevPAR in Øster Knasborg is currently N/A. Because RevPAR combines nightly rates with realized occupancy, it is one of the cleanest ways to compare how efficiently listings turn demand into revenue across the market.
- Entry-level properties (Bottom 25%) see N/A RevPAR.
- Typical properties (Median) generate N/A RevPAR.
- Strong performers (Top 25%) earn N/A RevPAR.
- Best-in-class (Top 10%) achieve N/A RevPAR.
Average Monthly RevPAR Trend in Øster Knasborg
RevPAR Insights for Øster Knasborg
- RevPAR peaks in Jan and bottoms out in Jan, mirroring the broader seasonal demand pattern and suggesting opportunities for dynamic pricing.
Recommendations for Hosts
- Track your own RevPAR monthly against these Øster Knasborg benchmarks. If your RevPAR falls below the median of N/A, examine whether low occupancy or low ADR is the primary drag.
- Use RevPAR rather than revenue alone when comparing properties of different sizes — it normalizes for available nights and gives a more accurate picture of performance.
Get Live Øster Knasborg Market Intelligence 👇
Explore Real-time Analytics
When Is the Peak Season for Airbnb in Øster Knasborg?
Øster Knasborg's peak Airbnb season falls in July, November, August, while the softest stretch is January, March, December. Overall, the market shows highly seasonal trends requiring careful strategy, which should guide pricing, minimum stays, and cash-flow planning.
Peak Season (July, November, August)
- Revenue averages $5,983 per month
- Occupancy rates average 62.0%
- Daily rates average $380
Shoulder Season
- Revenue averages $3,619 per month
- Occupancy maintains around 35.6%
- Daily rates hold near $358
Low Season (January, March, December)
- Revenue drops to average $2,206 per month
- Occupancy decreases to average 20.5%
- Daily rates adjust to average $392
Seasonality Insights for Øster Knasborg
- Airbnb seasonality in Øster Knasborg is pronounced. Revenue swings sharply between peak and low months, which means pricing strategy, minimum-stay settings, and cash reserves all need to account for extended slower periods.
- During the high season, the absolute peak month showcases Øster Knasborg's highest earning potential, with monthly revenues climbing to $7,318, occupancy reaching 76.9%, and ADRs peaking at $423.
- Conversely, the slowest single month marks the market's lowest point — revenue may dip to $1,689, occupancy could drop to 15.7%, and ADRs may adjust to $336.
- Lower occupancy paired with meaningful seasonality means hosts in Øster Knasborg need to maximize every peak-season booking and seriously consider whether off-season pricing adjustments or minimum-stay changes can capture incremental revenue.
Seasonal Strategies for Maximizing Profit
- Peak Season: Maximize revenue through premium pricing and potentially longer minimum stays. Ensure high availability and consider tightening cancellation policies to reduce last-minute gaps.
- Low Season: Offer competitive pricing, extended-stay discounts, and flexible cancellation policies. Target off-season travelers like remote workers, budget-conscious guests, and travelers with flexible schedules.
- Shoulder Seasons: Implement dynamic pricing that bridges peak and low rates. Target weekend travelers, local events, and business visitors. Slightly more flexible terms than peak season can help maintain occupancy without deep discounting.
- In a highly seasonal market like Øster Knasborg, building a cash reserve during the top months is essential for covering fixed costs during the slow period. Automated pricing tools can help capture demand shifts in real time.
Do You Need a License for Airbnb in Øster Knasborg?
Low regulation and minimal registration activity in Øster Knasborg, North Denmark Region, Denmark point to an operator-friendly environment. That said, even low-regulation markets may have tax collection requirements, safety standards, or HOA rules that affect short-term rental operations. Always verify the latest short-term rental regulations and Airbnb license requirements directly with local government authorities for Øster Knasborg to ensure full compliance before hosting.
(Source: AirROI data, 2026, finding no licensed listings among those analyzed)
What Are the Best Neighborhoods for Airbnb in Øster Knasborg?
With a compact short-term rental market, Øster Knasborg gives early-mover hosts an advantage in the right neighborhoods. The areas listed below are where guest demand and local attractions converge — a useful lens for investors evaluating whether to enter this market and where to position their listing.
| Neighborhood / Area | Why Host Here? (Target Guests & Appeal) | Key Attractions & Landmarks |
|---|---|---|
| Aalborg | Aalborg is a vibrant city known for its rich history, cultural events, and a lively atmosphere, making it a great place for tourists and business travelers alike. | Aalborg Zoo, Aalborg Waterfront, Viking Museum, Aalborg Tower, Kunsten Museum of Modern Art |
| Løkken | Løkken is a popular seaside town known for its beautiful beaches and charming atmosphere, perfect for family vacations and relaxation. | Løkken Beach, Løkken Town Center, Rubjerg Knude Lighthouse, Fyrkat Viking Burial Site, Skallerup Seaside Resort |
| Skagen | Skagen is famous for its unique light and beautiful landscapes. It attracts artists, nature lovers, and tourists seeking a peaceful retreat. | Skagen Museum, Grenen, Anchers Hus, Råbjerg Mile, Skagen Odde Nature Center |
| Hirtshals | Hirtshals is known for its ferry connections and North Sea beaches, making it an ideal location for travelers heading to Norway or just enjoying the coastal scenery. | Hirtshals Lighthouse, Nordsoen Oceanarium, Hirtshals Beach, Bunkermuseet Hirtshals, Nordsøen Oceanarium |
| Blokhus | Blokhus is a charming beach town with stunning sandy beaches, perfect for summer vacations and outdoor activities. | Blokhus Beach, Blokhus Observatory, Molleaaen, Blokhus Art Gallery, Blokhus Watermill |
| Frederikshavn | Frederikshavn is a key ferry port and has beautiful beaches and a historic town center, appealing to both tourists and business travelers. | Frederikshavn Harbour, Palm Beach, Bangsbo Fort, Frederikshavn Art Museum, Danish Sea War Museum |
| Sæby | Sæby offers a cozy harbor, beautiful beaches, and a charming old town, making it a great destination for relaxation and exploration. | Sæby Windmill, Sæby Harbour, Sæby Museum, St. Mary's Church, Sæby Beach |
| Jammerbugt | Jammerbugt is known for its breathtaking nature, including beaches and forested areas, appealing to those seeking outdoor adventures. | Cold Hawaii Surfing, Svinkløv Strand, Jammerbugtens Museum, Vilsund Strand, Kollerup Strand |
With 8 distinct neighborhoods showing meaningful short-term rental activity, Øster Knasborg offers diversification within a single market. Investors can tailor their strategy — from high-turnover tourist zones to quieter residential areas that attract longer stays and remote workers.
What Types of Properties Are on Airbnb in Øster Knasborg?
Room Type Distribution
Property Type Distribution
Market Composition Insights for Øster Knasborg
- The Øster Knasborg Airbnb market composition is heavily skewed towards Entire Home/Apt listings, which make up 100% of the 18 active rentals. This indicates strong guest preference for privacy and space.
- Looking at the property type distribution in Øster Knasborg, House properties are the most common (77.8%), reflecting the local real estate landscape.
- Houses represent a significant 77.8% portion, catering likely to families or larger groups.
Øster Knasborg Airbnb Room Capacity Analysis (2026): Bedroom Distribution
Distribution of Listings by Number of Bedrooms
Room Capacity Insights for Øster Knasborg
- The dominant room capacity in Øster Knasborg is 5+ bedrooms listings, making up 38.9% of the market. This suggests a strong demand for properties suitable for families or small groups.
- Together, 5+ bedrooms and 3 bedrooms properties represent 66.7% of the active Airbnb listings in Øster Knasborg, indicating a high concentration in these sizes.
- A significant 88.9% of listings offer 3+ bedrooms, catering to larger groups and families seeking more space in Øster Knasborg.
Øster Knasborg Vacation Rental Guest Capacity Trends (2026)
Distribution of Listings by Guest Capacity
Guest Capacity Insights for Øster Knasborg
- The most common guest capacity trend in Øster Knasborg vacation rentals is listings accommodating 8+ guests (66.7%). This suggests the primary traveler segment is likely larger groups.
- Properties designed for 8+ guests and 6 guests dominate the Øster Knasborg STR market, accounting for 83.4% of listings.
- 83.4% of properties accommodate 6+ guests, serving the market segment for larger families or group travel in Øster Knasborg.
- On average, properties in Øster Knasborg are equipped to host 7.1 guests.
What Amenities Do Airbnb Guests Expect in Øster Knasborg?
Amenity Prevalence
Amenity Insights for Øster Knasborg
- Essential amenities in Øster Knasborg that guests expect include: Kitchen, Wifi, Heating. Lacking these (any) could significantly impact bookings.
- Popular amenities like TV, Refrigerator, Coffee maker are common but not universal. Offering these can provide a competitive edge.
Recommendations for Hosts
- Ensure your listing includes all essential amenities for Øster Knasborg: Kitchen, Wifi, Heating.
- Consider adding popular differentiators like TV or Refrigerator to increase appeal.
- Highlight unique or less common amenities you offer (e.g., hot tub, dedicated workspace, EV charger) in your listing description and photos.
- Regularly check competitor amenities in Øster Knasborg to stay competitive.
Dive Deeper: Advanced Øster Knasborg STR Market Data (2026)
Ready to unlock more insights? AirROI provides access to advanced metrics and comprehensive Airbnb data for Øster Knasborg. Explore detailed analytics beyond this report to refine your investment strategy, optimize pricing, and maximize your vacation rental profits.
Explore Advanced MetricsØster Knasborg Airbnb Guest Demographics & Profile Analysis (2026)
Guest Profile Summary for Øster Knasborg
- The typical guest profile for Airbnb in Øster Knasborg consists of a mix of domestic (35%) and international guests, with top international origins including Germany, typically belonging to the Post-2000s (Gen Z/Alpha) group (50%), primarily speaking English or Danish.
- Domestic travelers account for 35.0% of guests.
- Key international markets include Denmark (35%) and Germany (18.3%).
- Top languages spoken are English (31.8%) followed by Danish (18.8%).
- A significant demographic segment is the Post-2000s (Gen Z/Alpha) group, representing 50% of guests.
Recommendations for Hosts
- Focus marketing internationally, particularly towards travelers from Germany.
- Tailor amenities and listing descriptions to appeal to the dominant Post-2000s (Gen Z/Alpha) demographic (e.g., highlight fast WiFi, smart home features, local guides).
- Highlight unique local experiences or amenities relevant to the primary guest profile.
- Consider seasonal promotions aligned with peak travel times for key origin markets.
Øster Knasborg Airbnb Booking Patterns (2026): Available vs. Booked Days
Available Days Distribution
Booked Days Distribution
Booking Pattern Insights for Øster Knasborg
- The most common availability pattern in Øster Knasborg falls within the 271-366 days range, representing 55.6% of listings. This suggests many properties have significant open periods on their calendars.
- Approximately 100.0% of listings show high availability (181+ days open annually), indicating potential for increased bookings or specific owner usage patterns.
- For booked days, the 91-180 days range is most frequent in Øster Knasborg (50%), reflecting common guest stay durations or potential owner blocking patterns.
How Far in Advance Do Guests Book Airbnb in Øster Knasborg?
Average Booking Lead Time by Month
Booking Lead Time Insights for Øster Knasborg
- The overall average booking lead time for vacation rentals in Øster Knasborg is 100 days.
- Guests book furthest in advance for stays during July (average 157 days), likely coinciding with peak travel demand or local events.
- The shortest booking windows occur for stays in March (average 24 days), indicating more last-minute travel plans during this time.
- Seasonally, Summer (131 days avg.) sees the longest lead times, while Spring (70 days avg.) has the shortest, reflecting typical travel planning cycles.
Recommendations for Hosts
- Use the overall average lead time (100 days) as a baseline for your pricing and availability strategy in Øster Knasborg.
- For July stays, consider implementing length-of-stay discounts or slightly higher rates for bookings made less than 157 days out to capitalize on advance planning.
- Target marketing efforts for the Summer season well in advance (at least 131 days) to capture early planners.
- Monitor your own booking lead times against these Øster Knasborg averages to identify opportunities for dynamic pricing adjustments.
Øster Knasborg Airbnb Minimum Stay Requirements Analysis
Distribution of Listings by Minimum Night Requirement
1 Night
4 listings
22.2% of total
2 Nights
4 listings
22.2% of total
3 Nights
1 listings
5.6% of total
4-6 Nights
4 listings
22.2% of total
30+ Nights
5 listings
27.8% of total
Key Insights
- The most prevalent minimum stay requirement in Øster Knasborg is 30+ Nights, adopted by 27.8% of listings. This highlights the market's preference for longer commitments.
- A significant segment (27.8%) caters to monthly stays (30+ nights) in Øster Knasborg, pointing to opportunities in the extended-stay market.
Recommendations
- Align with the market by considering a 30+ Nights minimum stay, as 27.8% of Øster Knasborg hosts use this setting.
- If feasible, allowing 1-night stays, especially midweek or during low season, could capture last-minute bookings, as only 22.2% currently do.
- Explore offering discounts for stays of 30+ nights to attract the 27.8% of the market seeking extended stays.
- Adjust minimum nights based on seasonality – potentially shorter during low season and longer during peak demand periods in Øster Knasborg.
Øster Knasborg Airbnb Cancellation Policy Trends Analysis (2026)
Limited
1 listings
5.6% of total
Flexible
3 listings
16.7% of total
Moderate
3 listings
16.7% of total
Firm
10 listings
55.6% of total
Strict
1 listings
5.6% of total
Cancellation Policy Insights for Øster Knasborg
- The prevailing Airbnb cancellation policy trend in Øster Knasborg is Firm, used by 55.6% of listings.
- A majority (61.2%) of hosts in Øster Knasborg utilize Firm or Strict policies, indicating a market where hosts prioritize booking security.
- Strict cancellation policies are quite rare (5.6%), potentially making listings with this policy less competitive unless justified by high demand or property type.
Recommendations for Hosts
- Consider adopting a Firm policy to align with the 55.6% market standard in Øster Knasborg.
- Using a Strict policy might deter some guests, as only 5.6% of listings use it. Evaluate if potential revenue protection outweighs possible lower booking rates.
- Regularly review your cancellation policy against competitors and market demand shifts in Øster Knasborg.
What Do the Top Airbnb Listings in Øster Knasborg Look Like?
Benchmark your potential! Explore examples of top-performing Airbnb properties in Øster Knasborgbased on Trailing Twelve Month (TTM) revenue. Analyze their characteristics, revenue, occupancy rate, and ADR to understand what drives success in this market.

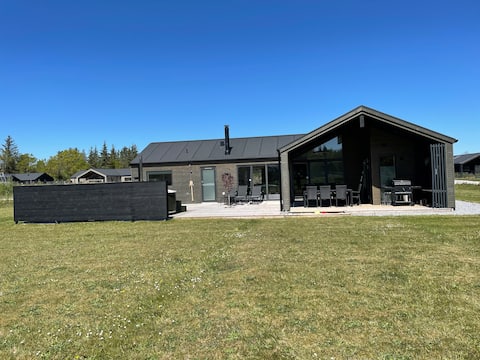
Luxury pool house close to Skagen – with spa and sauna!
Entire Place • 12 bedrooms

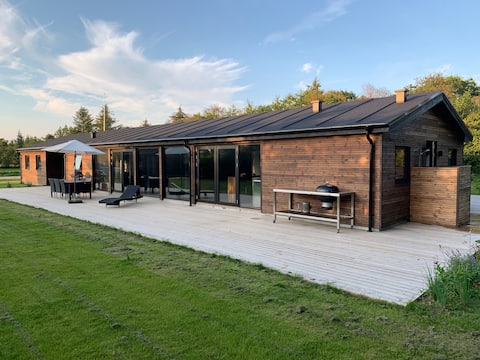
Charming house near the beach
Entire Place • 4 bedrooms
Spacious holiday home near Skagen
Entire Place • 4 bedrooms
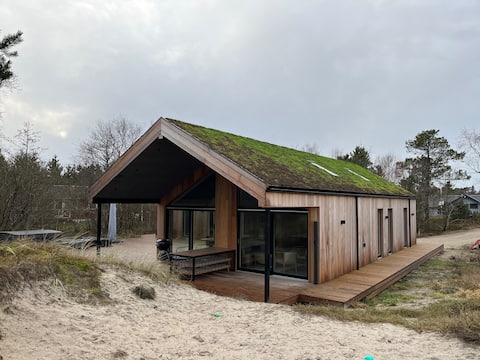
Unique new house, 200m. to a beautiful beach, 5 rooms
Entire Place • 5 bedrooms

Knagsborghus family home near the beach and Skagen
Entire Place • 7 bedrooms
Luxury summer house from '22. Short walking distance to beach
Entire Place • 4 bedrooms
Note: Performance varies based on location, size, amenities, seasonality, and management quality. Data reflects the past 12 months.
Who Are the Top Airbnb Hosts in Øster Knasborg?
Learn from the best! This table showcases top-performing Airbnb hosts in Øster Knasborg based on the number of properties managed and estimated total revenue over the past year. Analyze their scale and performance metrics.
| Host Name | Properties | Grossing Revenue | Stay Reviews | Avg Rating |
|---|---|---|---|---|
| Daniel | 1 | $149,353 | 6 | 4.83/5.0 |
| Anna Gabriella | 1 | $40,347 | 18 | 5.00/5.0 |
| Anette | 1 | $38,476 | 24 | 4.88/5.0 |
| Peter | 1 | $33,715 | 139 | 4.88/5.0 |
| Laila | 1 | $33,562 | 53 | 5.00/5.0 |
| Toppen Af Danmark | 2 | $32,650 | 5 | 5.00/5.0 |
| Nicolai | 1 | $31,397 | 14 | 4.86/5.0 |
| Maike - Interhome | 1 | $25,485 | 1 | Not Rated |
| Martin | 1 | $19,976 | 32 | 4.66/5.0 |
| Vivi | 1 | $14,673 | 16 | 4.81/5.0 |
Analyzing the strategies of top hosts, such as their property selection, pricing, and guest communication, can offer valuable lessons for optimizing your own Airbnb operations in Øster Knasborg.
How Does Øster Knasborg's Airbnb Market Compare to Nearby Cities?
How does the Øster Knasborg Airbnb market stack up against its neighbors? Compare key performance metrics like average monthly revenue, ADR, and occupancy rates in surrounding areas to understand the broader regional STR landscape.
Compared with Sulbæk, Øster Knasborg has 10 percentage points lower occupancy and about $181 higher ADR. That helps frame whether this market is winning more on demand, pricing, or both.
| Market | Active Properties | Monthly Revenue | Daily Rate | Avg. Occupancy |
|---|---|---|---|---|
| Starrkärr och Näs | 12 | $2,222 | $256.61 | 22% |
| Kandestederne | 21 | $1,911 | $224.13 | 42% |
| Sunds | 18 | $1,873 | $233.58 | 42% |
| Blokhus | 47 | $1,841 | $246.21 | 37% |
| Sulbæk | 10 | $1,780 | $224.54 | 49% |
| Stenungsunds kommun | 29 | $1,753 | $193.74 | 41% |
| Jerup | 10 | $1,747 | $205.24 | 45% |
| Särö | 15 | $1,746 | $310.77 | 36% |
| Mollösund | 23 | $1,666 | $239.64 | 40% |
| Klädesholmen | 14 | $1,617 | $301.57 | 30% |
Frequently Asked Questions About Airbnb in Øster Knasborg
These quick answers summarize the most common investor and operator questions using AirROI's latest market data for Øster Knasborg.
How much do Airbnb hosts make in Øster Knasborg?
Øster Knasborg hosts earn about $25,991 per year on average, with an average nightly rate of $405 and RevPAR of N/A. Those figures describe the typical revenue environment for active listings in Øster Knasborg, North Denmark Region, not the ceiling for the best operators. Source: AirROI 2026 data, Øster Knasborg market, March 2025 to February 2026.
What is the average Airbnb occupancy rate in Øster Knasborg?
The average Airbnb occupancy rate in Øster Knasborg is 39.2%. July is the strongest month and January is the softest, so hosts should expect demand to move meaningfully throughout the year rather than stay flat.
What is the average Airbnb daily rate in Øster Knasborg?
Listings in Øster Knasborg average $405 per night. The broader pricing spread also matters: lower-performing listings cluster closer to the lower quartiles, while premium homes can price materially above the city average when demand spikes or listing quality stands out.
How many Airbnb listings are active in Øster Knasborg?
Øster Knasborg currently has about 18 active Airbnb listings in AirROI's market dataset. That supply count helps explain how competitive the market is, how much depth there is for benchmarking, and whether the market behaves like a niche destination or a scaled urban market.
How strict are short-term rental regulations in Øster Knasborg?
AirROI currently classifies the short-term rental regulation level in Øster Knasborg as Low. The dataset also shows about 0.0% of listings with registration evidence. That is a market signal, not legal advice, so hosts should still confirm current licensing and compliance rules locally before listing.
What is the RevPAR for Airbnb in Øster Knasborg?
RevPAR in Øster Knasborg is about N/A. That metric combines pricing and occupancy into one efficiency number, so it is often a better quick benchmark than ADR alone when investors want to compare how well listings convert nightly rates into realized revenue.
Is Airbnb profitable in Øster Knasborg?
Occupancy of 39.2% means Øster Knasborg is a more selective market. Profitability is achievable but requires careful cost management, premium positioning, or targeting longer stays to reduce turnover. Average annual revenue is $25,991, but individual returns depend on property type, location within the city, and the host's operating efficiency.
How far in advance do guests book Airbnb in Øster Knasborg?
The average booking lead time in Øster Knasborg is about 100 days — a longer planning horizon typical of destination or vacation markets where travelers book well in advance. Hosts who understand their market's booking cadence can adjust minimum stays and pricing windows accordingly.
What are the best neighborhoods for Airbnb in Øster Knasborg?
Based on AirROI's analysis, some of the top neighborhoods for short-term rentals in Øster Knasborg include Aalborg, Løkken, Skagen. Each area attracts different guest profiles — from business travelers to leisure visitors — so the best location depends on the property type and target audience a host is aiming for. See the full neighborhood breakdown above.
What type of property performs best on Airbnb in Øster Knasborg?
entire_home listings make up 100.0% of the active supply in Øster Knasborg. The most common configuration does not always mean the most profitable — operators who identify underserved property types or bedroom counts can sometimes outperform the market average by filling a gap in local supply.
How does Øster Knasborg compare to nearby Airbnb markets?
Among neighboring markets, Starrkärr och Näs posts $26,664 in average annual revenue with 22.2% occupancy, compared to Øster Knasborg's $25,991 and 39.2%. Comparing nearby markets helps investors understand whether a destination's performance reflects local demand or broader regional trends.
When is the peak season for Airbnb in Øster Knasborg?
July is the highest-revenue month in Øster Knasborg, while January is the softest. The revenue spread between them indicates a highly seasonal market — revenue in the peak month is more than double the low month, so cash-flow planning and pricing automation are critical.
About AirROI Market Data
AirROI tracks over 20 million properties across 190+ countries and maintains 15+ years of historical performance data, making it one of the deepest Airbnb and STR intelligence platforms available. The analytics pipeline aggregates listing-level data monthly — revenue, occupancy, nightly rates, RevPAR, guest demographics, booking patterns, and competitive supply — so investors and operators can benchmark any market against its own history and against neighboring destinations.
Real estate investors, property managers, financial institutions, hedge funds, tourism boards, hospitality consultants, tech platforms, and academic researchers rely on AirROI data to underwrite acquisitions, optimize pricing, model macro trends, and conduct peer-reviewed research. Data is available through in-depth market reports like this one and the Airbnb API with 22 endpoints and an Airbnb MCP Server for AI agents.
AirROI proprietary analytics as of 2026-02-28. Metrics reflect trailing twelve-month aggregates from active listings. Revenue figures are market averages, not projections. Neighborhood descriptions are AI-generated and reviewed for accuracy. For full methodology, see the data methodology page.