Kompitsi, Peloponnese, Western Greece and the Ionian Airbnb Market Data 2026: STR Report & Statistics
How much can you earn on Airbnb in Kompitsi, Peloponnese, Western Greece and the Ionian? Based on AirROI's 2026 dataset (July 2025 – June 2026), the short answer is $11,975 per year — at a $270 nightly rate, 41.7% occupancy, and a $111 RevPAR that reflects moderate rate-to-revenue efficiency with room to optimize.
With just 22 active listings, Kompitsi is a micro-market where moderate demand with room for well-positioned listings to outperform. Supply has held steady while nightly rates moved higher — a market where hosts who optimize for bookability can unlock the full value of rising rates. Balancing rate strategy with occupancy is the key lever, and hosts who get it right will outperform.
Regulation is high and 95% of listings show active registration — compliance is the cost of entry. In a market this size, differentiated listings with strong reviews can capture outsized returns relative to the competition.
Table of Contents [hide] [show]
What Are the Key Airbnb Metrics in Kompitsi?
In Kompitsi, the headline Airbnb metrics are $11,975 in average annual revenue,41.7% occupancy, $270 ADR, and $111 in RevPAR, and guests book about 65 days in advance.
How Much Do Airbnb Hosts Earn Monthly in Kompitsi?
Understanding the monthly revenue variations for Airbnb listings in Kompitsi is key to maximizing your short term rental income potential. Seasonality significantly impacts earnings. Our analysis, based on data from the past 12 months, shows that the peak revenue month for STRs in Kompitsi is typically August, while December often presents the lowest earnings, highlighting opportunities for strategic pricing adjustments during shoulder and low seasons. Explore the typical Airbnb income in Kompitsi across different performance tiers:
- Best-in-class properties (Top 10%) achieve $4,303+ monthly, often utilizing dynamic pricing and superior guest experiences.
- Strong performing properties (Top 25%) earn $2,939 or more, indicating effective management and desirable locations/amenities.
- Typical properties (Median) generate around $1,758 per month, representing the average market performance.
- Entry-level properties (Bottom 25%) see earnings around $1,058, often with potential for optimization.
Average Monthly Airbnb Earnings Trend in Kompitsi
What Is the Monthly Airbnb Occupancy Rate in Kompitsi?
Maximize your bookings by understanding the Kompitsi STR occupancy trends. Seasonal demand shifts significantly influence how often properties are booked. Typically, Augustsees the highest demand (peak season occupancy), while December experiences the lowest (low season). Effective strategies, like adjusting minimum stays or offering promotions, can boost occupancy during slower periods. Here's how different property tiers perform in Kompitsi:
- Best-in-class properties (Top 10%) achieve 43%+ occupancy, indicating high desirability and potentially optimized availability.
- Strong performing properties (Top 25%) maintain 38% or higher occupancy, suggesting good market fit and guest satisfaction.
- Typical properties (Median) have an occupancy rate around 27%.
- Entry-level properties (Bottom 25%) average 18% occupancy, potentially facing higher vacancy.
Average Monthly Occupancy Rate Trend in Kompitsi
What Is the Average Airbnb Nightly Rate in Kompitsi?
Effective short term rental pricing strategy in Kompitsi involves understanding monthly ADR fluctuations. The Average Daily Rate (ADR) for Airbnb in Kompitsi typically peaks in June and dips lowest during October. Leveraging Airbnb dynamic pricing tools or strategies based on this seasonality can significantly boost revenue. Here's a look at the typical nightly rates achieved:
- Best-in-class properties (Top 10%) command rates of $435+ per night, often due to premium features or locations.
- Strong performing properties (Top 25%) achieve nightly rates of $313 or more.
- Typical properties (Median) charge around $220 per night.
- Entry-level properties (Bottom 25%) earn around $146 per night.
Average Daily Rate (ADR) Trend by Month in Kompitsi
What Is the RevPAR for Airbnb in Kompitsi?
RevPAR in Kompitsi is currently $111. Because RevPAR combines nightly rates with realized occupancy, it is one of the cleanest ways to compare how efficiently listings turn demand into revenue across the market.
- Entry-level properties (Bottom 25%) see $66 RevPAR.
- Typical properties (Median) generate $82 RevPAR.
- Strong performers (Top 25%) earn $108 RevPAR.
- Best-in-class (Top 10%) achieve $159 RevPAR.
Average Monthly RevPAR Trend in Kompitsi
RevPAR Insights for Kompitsi
- The average RevPAR in Kompitsi is $111. This metric combines nightly rates with realized occupancy, making it one of the best single-number indicators of market efficiency.
- The gap between the top 10% ($159) and bottom 25% ($66) is $93, suggesting a relatively compressed market where operational differences yield moderate returns.
- RevPAR peaks in Aug and bottoms out in Jan, mirroring the broader seasonal demand pattern and suggesting opportunities for dynamic pricing.
Recommendations for Hosts
- Track your own RevPAR monthly against these Kompitsi benchmarks. If your RevPAR falls below the median of $82, examine whether low occupancy or low ADR is the primary drag.
- Top-quartile listings achieve $108+ RevPAR through a combination of competitive pricing, strong reviews, and strategic amenities. Target this tier through incremental improvements.
- Use RevPAR rather than revenue alone when comparing properties of different sizes — it normalizes for available nights and gives a more accurate picture of performance.
Get Live Kompitsi Market Intelligence 👇
Explore Real-time Analytics
When Is the Peak Season for Airbnb in Kompitsi?
Kompitsi's peak Airbnb season falls in August, July, March, while the softest stretch is January, November, December. Overall, the market shows highly seasonal trends requiring careful strategy, which should guide pricing, minimum stays, and cash-flow planning.
Peak Season (August, July, March)
- Revenue averages $4,546 per month
- Occupancy rates average 51.6%
- Daily rates average $266
Shoulder Season
- Revenue averages $1,336 per month
- Occupancy maintains around 20.9%
- Daily rates hold near $264
Low Season (January, November, December)
- Revenue drops to average $70 per month
- Occupancy decreases to average 1.1%
- Daily rates adjust to average $233
Seasonality Insights for Kompitsi
- Airbnb seasonality in Kompitsi is pronounced. Revenue swings sharply between peak and low months, which means pricing strategy, minimum-stay settings, and cash reserves all need to account for extended slower periods.
- During the high season, the absolute peak month showcases Kompitsi's highest earning potential, with monthly revenues climbing to $5,320, occupancy reaching 66.4%, and ADRs peaking at $286.
- Conversely, the slowest single month marks the market's lowest point — revenue may dip to $0, occupancy could drop to 0.0%, and ADRs may adjust to $229.
- Understanding both the seasonal averages and these monthly peaks and troughs in revenue, occupancy, and ADR is crucial for maximizing your Airbnb profit potential in Kompitsi.
Seasonal Strategies for Maximizing Profit
- Peak Season: Maximize revenue through premium pricing. In a high-regulation market like Kompitsi, ensure your permit covers the number of nights you plan to book — some jurisdictions cap annual rental days.
- Low Season: Offer competitive pricing, extended-stay discounts, and flexible cancellation policies. Target off-season travelers like remote workers, budget-conscious guests, and travelers with flexible schedules.
- Shoulder Seasons: Implement dynamic pricing that bridges peak and low rates. Target weekend travelers, local events, and business visitors. Slightly more flexible terms than peak season can help maintain occupancy without deep discounting.
- In a highly seasonal market like Kompitsi, building a cash reserve during the top months is essential for covering fixed costs during the slow period. Automated pricing tools can help capture demand shifts in real time.
Do You Need a License for Airbnb in Kompitsi?
Yes, Kompitsi, Peloponnese, Western Greece and the Ionian, Greece enforces high STR regulations and 95% of active listings show registration evidence — indicating that enforcement is active and compliance is a prerequisite for operating legally. Hosts entering this market should budget for permit fees, inspections, and potential occupancy tax obligations as part of their startup costs. Always verify the latest short-term rental regulations and Airbnb license requirements directly with local government authorities for Kompitsi to ensure full compliance before hosting.
(Source: AirROI data, 2026, based on 95% licensed listings)
What Are the Best Neighborhoods for Airbnb in Kompitsi?
With a compact short-term rental market, Kompitsi gives early-mover hosts an advantage in the right neighborhoods. The areas listed below are where guest demand and local attractions converge — a useful lens for investors evaluating whether to enter this market and where to position their listing.
| Neighborhood / Area | Why Host Here? (Target Guests & Appeal) | Key Attractions & Landmarks |
|---|---|---|
| Kompitsi | A tranquil village close to the city of Igoumenitsa, offering a peaceful atmosphere with stunning views of the surrounding hills and the sea. Ideal for guests looking for a quiet retreat while being near urban amenities. | Beautiful beaches, Local tavernas, Hiking trails, Greek cultural experiences |
| Parga | A picturesque seaside town known for its stunning waterfront, charming old town, and vibrant nightlife. Very popular among tourists for its beaches and historical sites. | Parga Castle, Valtos Beach, Lichnos Beach, Traditional taverns, Nightlife and bars |
| Syvota | A small and enchanting coastal village known for its crystal-clear waters and beautiful bays. A perfect getaway for guests interested in sailing, swimming, and enjoying nature. | Blue Lagoon beach, Bella Vraka beach, Seaside dining, Water sports activities |
| Zakynthos | Famous for its stunning beaches and vibrant nightlife, Zakynthos attracts a diverse group of tourists. It offers numerous attractions including the famous Navagio Beach. | Navagio Beach, Blue Caves, Laganas beach, Zakynthos town, Nightclubs and bars |
| Corfu | A lush island with rich history and stunning architecture. Known for its beautiful beaches and vibrant culture, popular with tourists seeking a mix of relaxation and exploration. | Corfu Town, Paleokastritsa beach, Achilleion Palace, Local markets, Historical sites |
| Kefalonia | A larger island famous for its stunning landscapes, beaches, and wine. Attracts tourists looking for nature, adventure, and beautiful scenery. | Myrtos Beach, Assos village, Melissani Cave, Kefalonia wineries, Drogorati Cave |
| Lefkada | This island is known for its stunning cliffside beaches and vibrant nightlife. It’s a great place for both relaxation and adventure sports. | Porto Katsiki, Egremni beach, Vassiliki village, Windsurfing, Local seafood restaurants |
| Messinia | Known for its unspoiled beaches and rich ancient history, this region attracts visitors interested in both relaxation and cultural exploration. | Voidokilia beach, Ancient Messene, Nestor's Palace, Local olive oil tasting, Historic castles |
Because Kompitsi has a high regulation profile, confirming that short-term rental permits are available in your target neighborhood is a critical first step before committing to a property purchase. Regulation can vary at the neighborhood or district level even within the same city.
What Types of Properties Are on Airbnb in Kompitsi?
Room Type Distribution
Property Type Distribution
Market Composition Insights for Kompitsi
- The Kompitsi Airbnb market composition is heavily skewed towards Entire Home/Apt listings, which make up 90.9% of the 22 active rentals. This indicates strong guest preference for privacy and space.
- Looking at the property type distribution in Kompitsi, House properties are the most common (86.4%), reflecting the local real estate landscape.
- Houses represent a significant 86.4% portion, catering likely to families or larger groups.
- The presence of 9.1% Hotel/Boutique listings indicates integration with traditional hospitality.
- Smaller segments like apartment/condo (combined 4.5%) offer potential for unique stay experiences.
Kompitsi Airbnb Room Capacity Analysis (2026): Bedroom Distribution
Distribution of Listings by Number of Bedrooms
Room Capacity Insights for Kompitsi
- The dominant room capacity in Kompitsi is 3 bedrooms listings, making up 54.5% of the market. This suggests a strong demand for properties suitable for families or small groups.
- Together, 3 bedrooms and 1 bedroom properties represent 72.7% of the active Airbnb listings in Kompitsi, indicating a high concentration in these sizes.
- A significant 68.1% of listings offer 3+ bedrooms, catering to larger groups and families seeking more space in Kompitsi.
Kompitsi Vacation Rental Guest Capacity Trends (2026)
Distribution of Listings by Guest Capacity
Guest Capacity Insights for Kompitsi
- The most common guest capacity trend in Kompitsi vacation rentals is listings accommodating 8+ guests (27.3%). This suggests the primary traveler segment is likely larger groups.
- Properties designed for 8+ guests and 6 guests dominate the Kompitsi STR market, accounting for 54.6% of listings.
- 63.7% of properties accommodate 6+ guests, serving the market segment for larger families or group travel in Kompitsi.
- On average, properties in Kompitsi are equipped to host 6.0 guests.
How Do Listings in Kompitsi Compare on Quality?
Listing quality in Kompitsi can be approximated through presentation depth, bedroom count, and how often hosts disclose exact locations. These signals show how professionally the local supply base is merchandised.
Listing Quality Insights for Kompitsi
- At 45.4 photos per listing on average, Kompitsi hosts invest well in visual presentation. Listings with 20+ photos consistently outperform in search ranking and conversion.
- 54.5% of listings show their exact location. Lower disclosure rates can increase booking hesitation — guests want to know exactly where they are staying.
Recommendations for Hosts
- Enable exact location if possible — it removes a common source of guest uncertainty and can improve your listing's position in map-based searches.
- Use these quality indicators as a self-audit checklist. Listings that exceed the Kompitsi averages across all three metrics are better positioned for premium pricing.
What Amenities Do Airbnb Guests Expect in Kompitsi?
Amenity Prevalence
Amenity Insights for Kompitsi
- Essential amenities in Kompitsi that guests expect include: Air conditioning, Wifi, TV, Kitchen, Iron, Cooking basics, Dishes and silverware, Essentials, Hangers, Hair dryer. Lacking these (any) could significantly impact bookings.
Recommendations for Hosts
- Ensure your listing includes all essential amenities for Kompitsi: Air conditioning, Wifi, TV, Kitchen, Iron, Cooking basics, Dishes and silverware, Essentials, Hangers, Hair dryer.
- Prioritize adding missing essentials: Air conditioning, Wifi, TV, Cooking basics, Dishes and silverware, Essentials, Hangers, Hair dryer.
- Highlight unique or less common amenities you offer (e.g., hot tub, dedicated workspace, EV charger) in your listing description and photos.
- Regularly check competitor amenities in Kompitsi to stay competitive.
Which Airbnb Amenities Boost Revenue in Kompitsi?
Not every amenity matters equally. This table focuses on the amenities most associated with higher revenue in Kompitsi, which makes it more useful for prioritizing upgrades than a simple popularity list alone.
| Amenity | Prevalence | Revenue With | Revenue Without | Revenue Uplift |
|---|---|---|---|---|
Indoor fireplace | 50.0% | $15,952 | $7,998 | 99.4% |
Pool | 36.4% | $17,087 | $9,054 | 88.7% |
Sun loungers | 31.8% | $16,888 | $9,682 | 74.4% |
Outdoor shower | 50.0% | $14,875 | $9,075 | 63.9% |
Patio or balcony | 77.3% | $12,835 | $9,050 | 41.8% |
Backyard | 77.3% | $12,779 | $9,241 | 38.3% |
Shower gel | 40.9% | $14,077 | $10,520 | 33.8% |
Toaster | 27.3% | $13,529 | $11,393 | 18.7% |
Bathtub | 68.2% | $12,435 | $10,990 | 13.1% |
Drying rack for clothing | 68.2% | $12,358 | $11,156 | 10.8% |
Revenue Impact Insights for Kompitsi
- Indoor fireplace tops the revenue impact list with a 99.4% uplift — listings with this amenity earn $15,952 vs. $7,998 without it.
Recommendations for Hosts
- Focus your upgrade budget on amenities in the top half of this table. Below-median amenities may improve guest experience but contribute less to revenue growth.
- Highlight revenue-impacting amenities prominently in your listing title, photos, and description — guests can't value what they don't notice.
Dive Deeper: Advanced Kompitsi STR Market Data (2026)
Ready to unlock more insights? AirROI provides access to advanced metrics and comprehensive Airbnb data for Kompitsi. Explore detailed analytics beyond this report to refine your investment strategy, optimize pricing, and maximize your vacation rental profits.
Explore Advanced MetricsKompitsi Airbnb Guest Demographics & Profile Analysis (2026)
Guest Profile Summary for Kompitsi
- The typical guest profile for Airbnb in Kompitsi consists of predominantly international visitors (89%), with top international origins including United Kingdom, typically belonging to the Post-2000s (Gen Z/Alpha) group (50%), primarily speaking English or French.
- Domestic travelers account for 11.5% of guests.
- Key international markets include France (19.2%) and United Kingdom (15.4%).
- Top languages spoken are English (40.5%) followed by French (13.5%).
- A significant demographic segment is the Post-2000s (Gen Z/Alpha) group, representing 50% of guests.
Recommendations for Hosts
- Focus marketing internationally, particularly towards travelers from United Kingdom.
- Tailor amenities and listing descriptions to appeal to the dominant Post-2000s (Gen Z/Alpha) demographic (e.g., highlight fast WiFi, smart home features, local guides).
- Highlight unique local experiences or amenities relevant to the primary guest profile.
- Consider seasonal promotions aligned with peak travel times for key origin markets.
What Are Airbnb Guest Ratings in Kompitsi?
Listings in Kompitsi average 4.92 out of 5 overall, with about 16.9 reviews per active listing and 36.4% of listings carrying the Guest Favorite badge.
Rating Breakdown by Category
Guest Rating Insights for Kompitsi
- With an overall rating of 4.92, Kompitsi listings meet an exceptionally high bar. Guests consistently report strong satisfaction, which drives repeat bookings and referral traffic.
- The strongest subcategory is Communication (4.96), while Location (4.76) trails behind — a useful signal for hosts looking to prioritize upgrades.
- 36.4% of listings carry the Guest Favorite badge, a strong trust signal that can meaningfully lift click-through and booking rates.
Recommendations for Hosts
- Focus improvement efforts on Location — even small gains in the weakest subcategory can lift overall ratings and search ranking.
- Encourage guests to leave reviews after checkout. Listings with more reviews rank higher in search results and convert browsers into bookers more effectively.
Kompitsi Airbnb Booking Patterns (2026): Available vs. Booked Days
Available Days Distribution
Booked Days Distribution
Booking Pattern Insights for Kompitsi
- The most common availability pattern in Kompitsi falls within the 271-366 days range, representing 95.5% of listings. This suggests many properties have significant open periods on their calendars.
- Approximately 100.0% of listings show high availability (181+ days open annually), indicating potential for increased bookings or specific owner usage patterns.
- For booked days, the 31-90 days range is most frequent in Kompitsi (50%), reflecting common guest stay durations or potential owner blocking patterns.
How Far in Advance Do Guests Book Airbnb in Kompitsi?
Average Booking Lead Time by Month
Booking Lead Time Insights for Kompitsi
- The overall average booking lead time for vacation rentals in Kompitsi is 65 days.
- Guests book furthest in advance for stays during October (average 86 days), likely coinciding with peak travel demand or local events.
- The shortest booking windows occur for stays in November (average 0 days), indicating more last-minute travel plans during this time.
- Seasonally, Summer (70 days avg.) sees the longest lead times, while Winter (5 days avg.) has the shortest, reflecting typical travel planning cycles.
Recommendations for Hosts
- Use the overall average lead time (65 days) as a baseline for your pricing and availability strategy in Kompitsi.
- For October stays, consider implementing length-of-stay discounts or slightly higher rates for bookings made less than 86 days out to capitalize on advance planning.
- During November, focus on last-minute booking availability and promotions, as guests book with very short notice (0 days avg.).
- Target marketing efforts for the Summer season well in advance (at least 70 days) to capture early planners.
- Monitor your own booking lead times against these Kompitsi averages to identify opportunities for dynamic pricing adjustments.
What Is the Average Length of Stay for Airbnb in Kompitsi?
Guests in Kompitsi stay about 7.2 nights on average, generating roughly 149 reservations and 6.8 bookings per listing in the latest AirROI dataset. The most common check-in time is 3:00 PM and check-out is 11:00 AM.
Monthly Length of Stay in Kompitsi
Check-in Time Distribution
Check-out Time Distribution
Stay Pattern Insights for Kompitsi
- Longer stays mean fewer turnovers and lower cleaning costs per revenue dollar. This pattern also opens the door to monthly discount strategies that attract remote workers and extended-stay travelers.
- Stay lengths peak in Feb (32 nights) and shorten in Dec (1 nights). Adjust minimum-night requirements seasonally to match.
Recommendations for Hosts
- Leverage the longer-stay pattern by offering weekly discounts — even 5-10% off can convert browsing into bookings for guests considering an extended stay.
- Set your check-in time to match or beat the market standard of 3:00 PM. Offering early check-in flexibility can be a low-cost differentiator.
- Monitor length-of-stay seasonality to adjust minimum-night requirements — longer minimums during peak periods maximize revenue while shorter minimums fill gaps in shoulder seasons.
Kompitsi Airbnb Minimum Stay Requirements Analysis
Distribution of Listings by Minimum Night Requirement
1 Night
1 listings
4.5% of total
3 Nights
2 listings
9.1% of total
4-6 Nights
12 listings
54.5% of total
7-29 Nights
1 listings
4.5% of total
30+ Nights
6 listings
27.3% of total
Key Insights
- The most prevalent minimum stay requirement in Kompitsi is 4-6 Nights, adopted by 54.5% of listings. This highlights the market's preference for longer commitments.
- Very short stays (1-2 nights) are less common (4.5%), suggesting hosts prefer slightly longer bookings to optimize turnover.
- A significant segment (27.3%) caters to monthly stays (30+ nights) in Kompitsi, pointing to opportunities in the extended-stay market.
Recommendations
- Align with the market by considering a 4-6 Nights minimum stay, as 54.5% of Kompitsi hosts use this setting.
- If feasible, allowing 1-night stays, especially midweek or during low season, could capture last-minute bookings, as only 4.5% currently do.
- Explore offering discounts for stays of 30+ nights to attract the 27.3% of the market seeking extended stays.
- Adjust minimum nights based on seasonality – potentially shorter during low season and longer during peak demand periods in Kompitsi.
Kompitsi Airbnb Cancellation Policy Trends Analysis (2026)
Super Strict 30 Days
2 listings
9.1% of total
Flexible
1 listings
4.5% of total
Moderate
2 listings
9.1% of total
Firm
12 listings
54.5% of total
Strict
5 listings
22.7% of total
Cancellation Policy Insights for Kompitsi
- The prevailing Airbnb cancellation policy trend in Kompitsi is Firm, used by 54.5% of listings.
- A majority (77.2%) of hosts in Kompitsi utilize Firm or Strict policies, indicating a market where hosts prioritize booking security.
Recommendations for Hosts
- Consider adopting a Firm policy to align with the 54.5% market standard in Kompitsi.
- Regularly review your cancellation policy against competitors and market demand shifts in Kompitsi.
How Much Are Airbnb Cleaning Fees in Kompitsi?
Cleaning fees in Kompitsi are meaningful operating levers, not just pass-through charges. What matters most is how often hosts charge them, how high they run relative to market norms, and how large a share of gross revenue they consume.
Cleaning Fee Insights for Kompitsi
- About 54.5% of Kompitsi listings charge a cleaning fee — a mixed market where some hosts absorb the cost into nightly rates while others break it out.
- The gap between the average ($78) and median ($58) cleaning fee indicates some high-end properties are pulling the average up considerably.
- Cleaning fees represent 5.4% of gross revenue on average — a modest component of the overall booking price.
Recommendations for Hosts
- Price your cleaning fee competitively against the Kompitsi median of $58. Fees significantly above market norms can deter bookings, especially for shorter stays.
- Monitor competitor cleaning fees regularly. Airbnb's search algorithm factors in total price, so a well-calibrated cleaning fee can improve your listing's ranking.
What Do the Top Airbnb Listings in Kompitsi Look Like?
Benchmark your potential! Explore examples of top-performing Airbnb properties in Kompitsibased on Trailing Twelve Month (TTM) revenue. Analyze their characteristics, revenue, occupancy rate, and ADR to understand what drives success in this market.
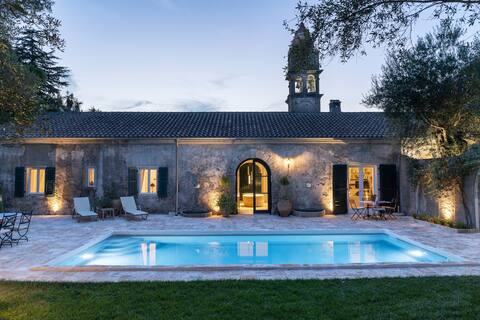
Villa Inspirante By Whitedream Villas
Entire Place • 4 bedrooms
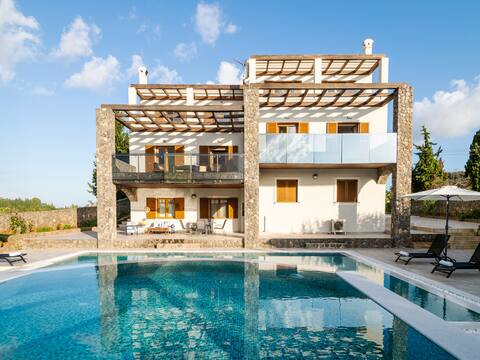
Villa Althea 1
Entire Place • 3 bedrooms
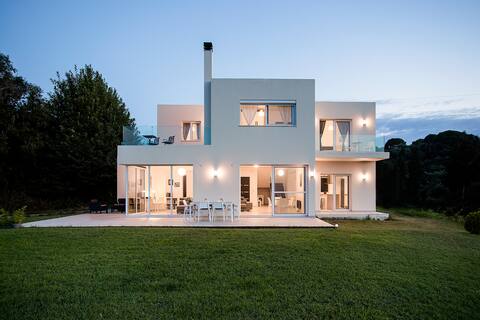
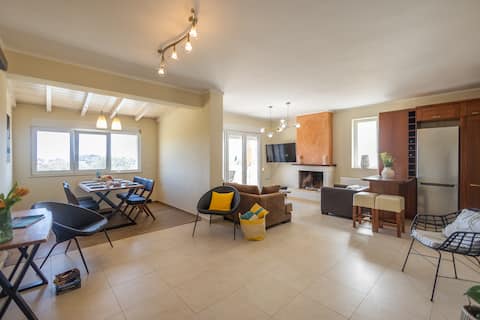
Hill House
Entire Place • 4 bedrooms
ioli Corfu maisonette
Entire Place • 4 bedrooms
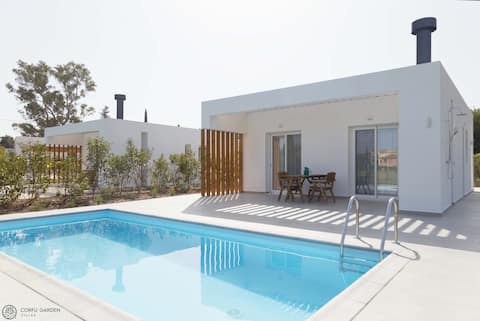
Corfu Garden Villa 1
Private Room • 1 bedroom
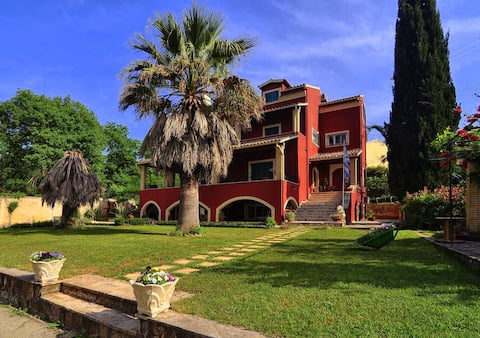
Red in Green
Entire Place • 2 bedrooms
Note: Performance varies based on location, size, amenities, seasonality, and management quality. Data reflects the past 12 months.
Who Are the Top Airbnb Hosts in Kompitsi?
Learn from the best! This table showcases top-performing Airbnb hosts in Kompitsi based on the number of properties managed and estimated total revenue over the past year. Analyze their scale and performance metrics.
| Host Name | Properties | Grossing Revenue | Stay Reviews | Avg Rating |
|---|---|---|---|---|
| White Dream | 1 | $35,117 | 4 | 5.00/5.0 |
| Yannos | 3 | $31,808 | 123 | 4.97/5.0 |
| Konstantinos Stefanos | 1 | $29,384 | 7 | 5.00/5.0 |
| Tessy | 1 | $25,547 | 33 | 4.85/5.0 |
| Γιωργος | 1 | $24,447 | 3 | 5.00/5.0 |
| Peter | 2 | $22,841 | 12 | 5.00/5.0 |
| Sotiria | 1 | $13,927 | 9 | 4.67/5.0 |
| Bill | 1 | $12,488 | 51 | 4.98/5.0 |
| Kostas | 1 | $12,422 | 24 | 5.00/5.0 |
| Antonios | 1 | $9,984 | 2 | Not Rated |
Analyzing the strategies of top hosts, such as their property selection, pricing, and guest communication, can offer valuable lessons for optimizing your own Airbnb operations in Kompitsi.
Who Are the Airbnb Hosts in Kompitsi?
Kompitsi has a relatively balanced host base.
Host Profile Insights for Kompitsi
- Only 18.2% of hosts hold Superhost status, suggesting a relatively young or casual market where quality improvements can pay outsized dividends.
- 18.2% of listings have Instant Book enabled. Lower Instant Book adoption means many guests must request approval, which can slow conversions.
- 36.4% of listings use Airbnb's simplified pricing (host-only fee), where the host pays the entire platform service fee and the guest sees one all-in price with no separate Airbnb service charge. Lower adoption suggests a market with more independent hosts managing listings directly through Airbnb.
Recommendations for Hosts
- Earning Superhost status can significantly improve search ranking and guest trust. Focus on maintaining high response rates, low cancellations, and strong reviews.
- Consider enabling Instant Book — it reduces booking friction and Airbnb's algorithm tends to favor Instant Book listings in search results.
- With 31.8% cohosted listings, there may be a growing local market for property management services.
- Benchmark your host metrics against these Kompitsi averages regularly and adjust your hosting strategy based on what top performers do differently.
How Does Kompitsi's Airbnb Market Compare to Nearby Cities?
How does the Kompitsi Airbnb market stack up against its neighbors? Compare key performance metrics like average monthly revenue, ADR, and occupancy rates in surrounding areas to understand the broader regional STR landscape.
Compared with Simotata, Kompitsi has 11 percentage points lower occupancy and about $56 lower ADR. That helps frame whether this market is winning more on demand, pricing, or both.
| Market | Active Properties | Monthly Revenue | Daily Rate | Avg. Occupancy |
|---|---|---|---|---|
| Mparmpati | 10 | $3,541 | $328.43 | 48% |
| Kassopaia Municipal Unit | 506 | $2,470 | $299.91 | 50% |
| Kira Chrisikou | 34 | $2,335 | $478.20 | 40% |
| Erisos Municipal Unit | 273 | $2,236 | $304.43 | 47% |
| Simotata | 22 | $2,165 | $325.76 | 53% |
| Spartilas | 31 | $2,108 | $272.06 | 49% |
| Pesada | 46 | $2,107 | $352.14 | 47% |
| Gastouri | 59 | $2,081 | $279.83 | 48% |
| Argostoli Municipality | 35 | $2,030 | $422.17 | 43% |
| Minia | 61 | $2,016 | $266.50 | 50% |
Frequently Asked Questions About Airbnb in Kompitsi
These quick answers summarize the most common investor and operator questions using AirROI's latest market data for Kompitsi.
How much do Airbnb hosts make in Kompitsi?
Kompitsi hosts earn about $11,975 per year on average, with an average nightly rate of $270 and RevPAR of $111. Those figures describe the typical revenue environment for active listings in Kompitsi, Peloponnese, Western Greece and the Ionian, not the ceiling for the best operators. Source: AirROI 2026 data, Kompitsi market, July 2025 to June 2026.
What is the average Airbnb occupancy rate in Kompitsi?
The average Airbnb occupancy rate in Kompitsi is 41.7%. August is the strongest month and December is the softest, so hosts should expect demand to move meaningfully throughout the year rather than stay flat.
What is the average Airbnb daily rate in Kompitsi?
Listings in Kompitsi average $270 per night. The broader pricing spread also matters: lower-performing listings cluster closer to the lower quartiles, while premium homes can price materially above the city average when demand spikes or listing quality stands out.
How many Airbnb listings are active in Kompitsi?
Kompitsi currently has about 22 active Airbnb listings in AirROI's market dataset. That supply count helps explain how competitive the market is, how much depth there is for benchmarking, and whether the market behaves like a niche destination or a scaled urban market.
How strict are short-term rental regulations in Kompitsi?
AirROI currently classifies the short-term rental regulation level in Kompitsi as High. The dataset also shows about 95.5% of listings with registration evidence. That is a market signal, not legal advice, so hosts should still confirm current licensing and compliance rules locally before listing.
What is the RevPAR for Airbnb in Kompitsi?
RevPAR in Kompitsi is about $111. That metric combines pricing and occupancy into one efficiency number, so it is often a better quick benchmark than ADR alone when investors want to compare how well listings convert nightly rates into realized revenue.
Is Airbnb profitable in Kompitsi?
At 41.7% occupancy, Kompitsi can be profitable — but margins depend heavily on operating costs, property acquisition price, and how well hosts optimize pricing across seasons. Average annual revenue is $11,975, but individual returns depend on property type, location within the city, and the host's operating efficiency.
How far in advance do guests book Airbnb in Kompitsi?
The average booking lead time in Kompitsi is about 65 days — a longer planning horizon typical of destination or vacation markets where travelers book well in advance. Hosts who understand their market's booking cadence can adjust minimum stays and pricing windows accordingly.
What are the best neighborhoods for Airbnb in Kompitsi?
Based on AirROI's analysis, some of the top neighborhoods for short-term rentals in Kompitsi include Kompitsi, Parga, Syvota. Each area attracts different guest profiles — from business travelers to leisure visitors — so the best location depends on the property type and target audience a host is aiming for. See the full neighborhood breakdown above.
What type of property performs best on Airbnb in Kompitsi?
entire_home listings make up 90.9% of the active supply in Kompitsi. The most common configuration does not always mean the most profitable — operators who identify underserved property types or bedroom counts can sometimes outperform the market average by filling a gap in local supply.
How does Kompitsi compare to nearby Airbnb markets?
Among neighboring markets, Mparmpati posts $42,496 in average annual revenue with 48.1% occupancy, compared to Kompitsi's $11,975 and 41.7%. Comparing nearby markets helps investors understand whether a destination's performance reflects local demand or broader regional trends.
What is the average length of stay in Kompitsi?
The average Airbnb stay length in Kompitsi is about 7.2 nights. That matters for turnover, cleaning operations, and pricing strategy because shorter stays increase changeovers while longer stays can smooth occupancy and reduce operational friction.
What is the average Airbnb guest rating in Kompitsi?
Airbnb listings in Kompitsi average 4.92 out of 5 overall. About 36.4% of listings carry the guest favorite badge, which suggests a meaningful share of inventory is competing on review quality rather than price alone.
Which amenities boost Airbnb revenue in Kompitsi?
Indoor fireplace and Pool are among the strongest revenue-linked amenities in Kompitsi. In AirROI's latest dataset, listings with these amenities outperform those without on average revenue, which makes amenities analysis useful for prioritizing investment and listing upgrades.
Do Airbnb hosts charge cleaning fees in Kompitsi?
Yes. About 54.5% of active Airbnb listings in Kompitsi charge a cleaning fee, and the average fee is $78. The more important operating benchmark is how much of gross revenue that fee consumes, not just the absolute dollar amount.
What percentage of Airbnb hosts are Superhosts in Kompitsi?
Only 18.2% of hosts hold Superhost status, suggesting the market has a large share of newer or less active operators — an opportunity for committed hosts to stand out.
About AirROI Market Data
AirROI tracks over 20 million properties across 190+ countries and maintains 15+ years of historical performance data, making it one of the deepest Airbnb and STR intelligence platforms available. The analytics pipeline aggregates listing-level data monthly — revenue, occupancy, nightly rates, RevPAR, guest demographics, booking patterns, and competitive supply — so investors and operators can benchmark any market against its own history and against neighboring destinations.
Real estate investors, property managers, financial institutions, hedge funds, tourism boards, hospitality consultants, tech platforms, and academic researchers rely on AirROI data to underwrite acquisitions, optimize pricing, model macro trends, and conduct peer-reviewed research. Data is available through in-depth market reports like this one and the Airbnb API with 22 endpoints and an Airbnb MCP Server for AI agents.
AirROI proprietary analytics as of 2026-06-30. Metrics reflect trailing twelve-month aggregates from active listings. Revenue figures are market averages, not projections. Neighborhood descriptions are AI-generated and reviewed for accuracy. For full methodology, see the data methodology page.