Naniwa Ward, Osaka Airbnb Market Data 2026: STR Report & Statistics
How much can you earn on Airbnb in Naniwa Ward, Osaka? Based on AirROI's 2026 dataset (July 2025 – June 2026), the short answer is $9,637 per year — at a $104 nightly rate, 38.0% occupancy, and a $41 RevPAR that reflects moderate rate-to-revenue efficiency with room to optimize.
Naniwa Ward's 337 active listings and moderate demand with room for well-positioned listings to outperform position it as a midsize vacation rental market.
Regulation is high and 99% of listings show active registration — compliance is the cost of entry. For data-driven hosts, the opportunity lies in reading these signals and positioning accordingly.
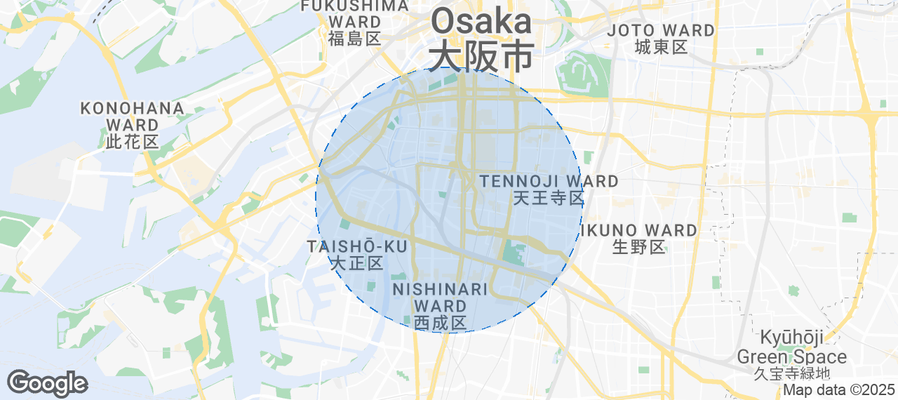
Table of Contents [hide] [show]
What Are the Key Airbnb Metrics in Naniwa Ward?
In Naniwa Ward, the headline Airbnb metrics are $9,637 in average annual revenue,38.0% occupancy, $104 ADR, and $41 in RevPAR, and guests book about 38 days in advance.
How Much Do Airbnb Hosts Earn Monthly in Naniwa Ward?
Understanding the monthly revenue variations for Airbnb listings in Naniwa Ward is key to maximizing your short term rental income potential. Seasonality significantly impacts earnings. Our analysis, based on data from the past 12 months, shows that the peak revenue month for STRs in Naniwa Ward is typically October, while June often presents the lowest earnings, highlighting opportunities for strategic pricing adjustments during shoulder and low seasons. Explore the typical Airbnb income in Naniwa Ward across different performance tiers:
- Best-in-class properties (Top 10%) achieve $3,230+ monthly, often utilizing dynamic pricing and superior guest experiences.
- Strong performing properties (Top 25%) earn $2,032 or more, indicating effective management and desirable locations/amenities.
- Typical properties (Median) generate around $1,108 per month, representing the average market performance.
- Entry-level properties (Bottom 25%) see earnings around $632, often with potential for optimization.
Average Monthly Airbnb Earnings Trend in Naniwa Ward
What Is the Monthly Airbnb Occupancy Rate in Naniwa Ward?
Maximize your bookings by understanding the Naniwa Ward STR occupancy trends. Seasonal demand shifts significantly influence how often properties are booked. Typically, Octobersees the highest demand (peak season occupancy), while June experiences the lowest (low season). Effective strategies, like adjusting minimum stays or offering promotions, can boost occupancy during slower periods. Here's how different property tiers perform in Naniwa Ward:
- Best-in-class properties (Top 10%) achieve 82%+ occupancy, indicating high desirability and potentially optimized availability.
- Strong performing properties (Top 25%) maintain 68% or higher occupancy, suggesting good market fit and guest satisfaction.
- Typical properties (Median) have an occupancy rate around 46%.
- Entry-level properties (Bottom 25%) average 25% occupancy, potentially facing higher vacancy.
Average Monthly Occupancy Rate Trend in Naniwa Ward
What Is the Average Airbnb Nightly Rate in Naniwa Ward?
Effective short term rental pricing strategy in Naniwa Ward involves understanding monthly ADR fluctuations. The Average Daily Rate (ADR) for Airbnb in Naniwa Ward typically peaks in March and dips lowest during July. Leveraging Airbnb dynamic pricing tools or strategies based on this seasonality can significantly boost revenue. Here's a look at the typical nightly rates achieved:
- Best-in-class properties (Top 10%) command rates of $168+ per night, often due to premium features or locations.
- Strong performing properties (Top 25%) achieve nightly rates of $125 or more.
- Typical properties (Median) charge around $90 per night.
- Entry-level properties (Bottom 25%) earn around $63 per night.
Average Daily Rate (ADR) Trend by Month in Naniwa Ward
What Is the RevPAR for Airbnb in Naniwa Ward?
RevPAR in Naniwa Ward is currently $41. Because RevPAR combines nightly rates with realized occupancy, it is one of the cleanest ways to compare how efficiently listings turn demand into revenue across the market.
- Entry-level properties (Bottom 25%) see $19 RevPAR.
- Typical properties (Median) generate $30 RevPAR.
- Strong performers (Top 25%) earn $52 RevPAR.
- Best-in-class (Top 10%) achieve $83 RevPAR.
Average Monthly RevPAR Trend in Naniwa Ward
RevPAR Insights for Naniwa Ward
- The average RevPAR in Naniwa Ward is $41. This metric combines nightly rates with realized occupancy, making it one of the best single-number indicators of market efficiency.
- The gap between the top 10% ($83) and bottom 25% ($19) is $64, suggesting a relatively compressed market where operational differences yield moderate returns.
- RevPAR peaks in Oct and bottoms out in Jun, mirroring the broader seasonal demand pattern and suggesting opportunities for dynamic pricing.
Recommendations for Hosts
- Track your own RevPAR monthly against these Naniwa Ward benchmarks. If your RevPAR falls below the median of $30, examine whether low occupancy or low ADR is the primary drag.
- Top-quartile listings achieve $52+ RevPAR through a combination of competitive pricing, strong reviews, and strategic amenities. Target this tier through incremental improvements.
- Use RevPAR rather than revenue alone when comparing properties of different sizes — it normalizes for available nights and gives a more accurate picture of performance.
Get Live Naniwa Ward Market Intelligence 👇
Explore Real-time Analytics
When Is the Peak Season for Airbnb in Naniwa Ward?
Naniwa Ward's peak Airbnb season falls in October, November, September, while the softest stretch is January, February, June. Overall, the market shows highly seasonal trends requiring careful strategy, which should guide pricing, minimum stays, and cash-flow planning.
Peak Season (October, November, September)
- Revenue averages $2,147 per month
- Occupancy rates average 65.5%
- Daily rates average $101
Shoulder Season
- Revenue averages $1,519 per month
- Occupancy maintains around 44.8%
- Daily rates hold near $111
Low Season (January, February, June)
- Revenue drops to average $1,065 per month
- Occupancy decreases to average 33.7%
- Daily rates adjust to average $105
Seasonality Insights for Naniwa Ward
- Airbnb seasonality in Naniwa Ward is pronounced. Revenue swings sharply between peak and low months, which means pricing strategy, minimum-stay settings, and cash reserves all need to account for extended slower periods.
- During the high season, the absolute peak month showcases Naniwa Ward's highest earning potential, with monthly revenues climbing to $2,473, occupancy reaching 70.1%, and ADRs peaking at $128.
- Conversely, the slowest single month marks the market's lowest point — revenue may dip to $902, occupancy could drop to 26.0%, and ADRs may adjust to $98.
- Lower occupancy paired with meaningful seasonality means hosts in Naniwa Ward need to maximize every peak-season booking and seriously consider whether off-season pricing adjustments or minimum-stay changes can capture incremental revenue.
Seasonal Strategies for Maximizing Profit
- Peak Season: Maximize revenue through premium pricing. In a high-regulation market like Naniwa Ward, ensure your permit covers the number of nights you plan to book — some jurisdictions cap annual rental days.
- Low Season: Offer competitive pricing, extended-stay discounts, and flexible cancellation policies. Target off-season travelers like remote workers, budget-conscious guests, and travelers with flexible schedules.
- Shoulder Seasons: Implement dynamic pricing that bridges peak and low rates. Target weekend travelers, local events, and business visitors. Slightly more flexible terms than peak season can help maintain occupancy without deep discounting.
- In a highly seasonal market like Naniwa Ward, building a cash reserve during the top months is essential for covering fixed costs during the slow period. Automated pricing tools can help capture demand shifts in real time.
Do You Need a License for Airbnb in Naniwa Ward?
Yes, Naniwa Ward, Osaka, Japan enforces high STR regulations and 99% of active listings show registration evidence — indicating that enforcement is active and compliance is a prerequisite for operating legally. Hosts entering this market should budget for permit fees, inspections, and potential occupancy tax obligations as part of their startup costs. Always verify the latest short-term rental regulations and Airbnb license requirements directly with local government authorities for Naniwa Ward to ensure full compliance before hosting.
(Source: AirROI data, 2026, based on 99% licensed listings)
What Are the Best Neighborhoods for Airbnb in Naniwa Ward?
Location within Naniwa Ward matters. Even in a midsize market, the difference between neighborhoods can mean a material gap in occupancy, nightly rate, and overall Airbnb revenue. Below are 8 areas where short-term rental activity and guest interest are concentrated — along with the reasons each neighborhood appeals to travelers.
| Neighborhood / Area | Why Host Here? (Target Guests & Appeal) | Key Attractions & Landmarks |
|---|---|---|
| Namba | Namba is a vibrant district known for its bustling atmosphere, shopping, and nightlife. It's a popular destination for tourists seeking entertainment, food, and cultural experiences right in the heart of Osaka. | Dotonbori, Shinsaibashi Shopping Arcade, Namba Parks, Tsutenkaku Tower, Kuromon Ichiba Market, Namba Grand Kagetsu |
| Shinsaibashi | Shinsaibashi is renowned for its upscale shopping and dining options, making it a magnet for tourists and residents alike. Its proximity to Namba adds to its appeal as a central location for exploring Osaka. | Shinsaibashi Shopping Arcade, Dotombori, Amerikamura, Glico Man Sign, Shinsaibashi-suji Shopping Street |
| Dotonbori | Famously known for its neon lights and extravagant street food, Dotonbori is a must-visit location that attracts a steady flow of tourists year-round. It's the epitome of Osaka's culinary culture. | Dotonbori Canal, Takoyaki vendors, Glico Running Man, Dotonbori Shopping, Dotombori River Cruise |
| Tennoji | Tennoji is an up-and-coming area that combines traditional and modern attractions, including historical sites and shopping malls. It appeals to those looking to experience a more local side of Osaka. | Shitennoji Temple, Abeno Harukas, Tennoji Park, Kishino tsubaki Shrine, Spa World |
| Umeda | Umeda is Osaka’s bustling business district, featuring high-end shopping, dining, and entertainment options. It's well-connected and attracts both tourists and business travelers. | Umeda Sky Building, Grand Front Osaka, Hep Five Shopping Mall, Osaka Station City, Osaka Science Museum |
| Osaka Castle | Osaka Castle is a historical landmark surrounded by lush parks, making it a serene area amidst the city's hustle. It's perfect for travelers interested in history and culture. | Osaka Castle, Nishi-no-Maru Garden, Osaka Castle Park, Osaka Museum of History, Mizuno Fountain |
| Amerikamura | Known as the 'American Village', Amerikamura is a trendy district that attracts younger crowds with its eclectic shops and creative vibe. It's a hotspot for fashion and culture enthusiasts. | Triangle Park, Unique fashion boutiques, Street art, Cafes and eateries, Live music venues |
| Tsuruhashi | Famous for its Korean district and vibrant atmosphere, Tsuruhashi offers a unique cultural experience with authentic cuisine and lively markets, perfect for those looking for something different in Osaka. | Tsuruhashi Market, Korean Town, Kotaijinja Shrine, Shinsekai, Local street food |
Because Naniwa Ward has a high regulation profile, confirming that short-term rental permits are available in your target neighborhood is a critical first step before committing to a property purchase. Regulation can vary at the neighborhood or district level even within the same city.
What Types of Properties Are on Airbnb in Naniwa Ward?
Room Type Distribution
Property Type Distribution
Market Composition Insights for Naniwa Ward
- The Naniwa Ward Airbnb market composition is heavily skewed towards Entire Home/Apt listings, which make up 78.3% of the 337 active rentals. This indicates strong guest preference for privacy and space.
- Looking at the property type distribution in Naniwa Ward, Apartment/Condo properties are the most common (81%), reflecting the local real estate landscape.
- Houses represent a significant 15.7% portion, catering likely to families or larger groups.
- Smaller segments like hotel/boutique (combined 3.3%) offer potential for unique stay experiences.
Naniwa Ward Airbnb Room Capacity Analysis (2026): Bedroom Distribution
Distribution of Listings by Number of Bedrooms
Room Capacity Insights for Naniwa Ward
- The dominant room capacity in Naniwa Ward is 1 bedroom listings, making up 55.2% of the market. This suggests a strong demand for properties suitable for couples or solo travelers.
- Together, 1 bedroom and 2 bedrooms properties represent 72.1% of the active Airbnb listings in Naniwa Ward, indicating a high concentration in these sizes.
- With over half the market (55.2%) consisting of studios or 1-bedroom units, Naniwa Ward is particularly well-suited for individuals or couples.
Naniwa Ward Vacation Rental Guest Capacity Trends (2026)
Distribution of Listings by Guest Capacity
Guest Capacity Insights for Naniwa Ward
- The most common guest capacity trend in Naniwa Ward vacation rentals is listings accommodating 2 guests (22.6%). This suggests the primary traveler segment is likely couples or solo travelers.
- Properties designed for 2 guests and 4 guests dominate the Naniwa Ward STR market, accounting for 38.0% of listings.
- 28.0% of properties accommodate 6+ guests, serving the market segment for larger families or group travel in Naniwa Ward.
- On average, properties in Naniwa Ward are equipped to host 3.6 guests.
How Do Listings in Naniwa Ward Compare on Quality?
Listing quality in Naniwa Ward can be approximated through presentation depth, bedroom count, and how often hosts disclose exact locations. These signals show how professionally the local supply base is merchandised.
Listing Quality Insights for Naniwa Ward
- At 37.9 photos per listing on average, Naniwa Ward hosts invest well in visual presentation. Listings with 20+ photos consistently outperform in search ranking and conversion.
- 37.7% of listings show their exact location. Lower disclosure rates can increase booking hesitation — guests want to know exactly where they are staying.
Recommendations for Hosts
- Enable exact location if possible — it removes a common source of guest uncertainty and can improve your listing's position in map-based searches.
- Use these quality indicators as a self-audit checklist. Listings that exceed the Naniwa Ward averages across all three metrics are better positioned for premium pricing.
What Amenities Do Airbnb Guests Expect in Naniwa Ward?
Amenity Prevalence
Amenity Insights for Naniwa Ward
- Essential amenities in Naniwa Ward that guests expect include: Wifi, Air conditioning, Smoke alarm, Hair dryer. Lacking these (any) could significantly impact bookings.
- Popular amenities like Shampoo, Washer, Hot water are common but not universal. Offering these can provide a competitive edge.
Recommendations for Hosts
- Ensure your listing includes all essential amenities for Naniwa Ward: Wifi, Air conditioning, Smoke alarm, Hair dryer.
- Prioritize adding missing essentials: Wifi, Air conditioning, Smoke alarm, Hair dryer.
- Consider adding popular differentiators like Shampoo or Washer to increase appeal.
- Highlight unique or less common amenities you offer (e.g., hot tub, dedicated workspace, EV charger) in your listing description and photos.
- Regularly check competitor amenities in Naniwa Ward to stay competitive.
Which Airbnb Amenities Boost Revenue in Naniwa Ward?
Not every amenity matters equally. This table focuses on the amenities most associated with higher revenue in Naniwa Ward, which makes it more useful for prioritizing upgrades than a simple popularity list alone.
| Amenity | Prevalence | Revenue With | Revenue Without | Revenue Uplift |
|---|---|---|---|---|
Babysitter recommendationsHigh opportunity | 2.4% | $25,414 | $9,254 | 174.6% |
High chairHigh opportunity | 3.0% | $23,009 | $9,228 | 149.3% |
Ceiling fanHigh opportunity | 3.3% | $22,391 | $9,207 | 143.2% |
Resort accessHigh opportunity | 1.5% | $22,081 | $9,450 | 133.7% |
River viewHigh opportunity | 4.2% | $19,680 | $9,202 | 113.9% |
Baby bathHigh opportunity | 1.5% | $20,188 | $9,478 | 113.0% |
Board gamesHigh opportunity | 7.1% | $18,743 | $8,939 | 109.7% |
Self check-in | 79.8% | $10,761 | $5,194 | 107.2% |
Children’s dinnerwareHigh opportunity | 6.5% | $18,510 | $9,018 | 105.3% |
Oven | 5.3% | $17,969 | $9,167 | 96.0% |
Revenue Impact Insights for Naniwa Ward
- Babysitter recommendations tops the revenue impact list with a 174.6% uplift — listings with this amenity earn $25,414 vs. $9,254 without it.
- High-opportunity amenities — Babysitter recommendations, High chair, Ceiling fan — combine revenue uplift above 100% with prevalence under 10%, meaning most competitors haven't adopted them yet.
Recommendations for Hosts
- Prioritize adding Babysitter recommendations — it has the best combination of high revenue impact and low market saturation in Naniwa Ward.
- Focus your upgrade budget on amenities in the top half of this table. Below-median amenities may improve guest experience but contribute less to revenue growth.
- Highlight revenue-impacting amenities prominently in your listing title, photos, and description — guests can't value what they don't notice.
Dive Deeper: Advanced Naniwa Ward STR Market Data (2026)
Ready to unlock more insights? AirROI provides access to advanced metrics and comprehensive Airbnb data for Naniwa Ward. Explore detailed analytics beyond this report to refine your investment strategy, optimize pricing, and maximize your vacation rental profits.
Explore Advanced MetricsNaniwa Ward Airbnb Guest Demographics & Profile Analysis (2026)
Guest Profile Summary for Naniwa Ward
- The typical guest profile for Airbnb in Naniwa Ward consists of predominantly international visitors (95%), with top international origins including China, typically belonging to the Post-2000s (Gen Z/Alpha) group (50%), primarily speaking English or Chinese.
- Domestic travelers account for 4.6% of guests.
- Key international markets include United States (14.7%) and China (9.5%).
- Top languages spoken are English (42.3%) followed by Chinese (12.1%).
- A significant demographic segment is the Post-2000s (Gen Z/Alpha) group, representing 50% of guests.
Recommendations for Hosts
- Focus marketing internationally, particularly towards travelers from China.
- Tailor amenities and listing descriptions to appeal to the dominant Post-2000s (Gen Z/Alpha) demographic (e.g., highlight fast WiFi, smart home features, local guides).
- Highlight unique local experiences or amenities relevant to the primary guest profile.
- Consider seasonal promotions aligned with peak travel times for key origin markets.
What Are Airbnb Guest Ratings in Naniwa Ward?
Listings in Naniwa Ward average 4.75 out of 5 overall, with about 31.6 reviews per active listing and 27.6% of listings carrying the Guest Favorite badge.
Rating Breakdown by Category
Guest Rating Insights for Naniwa Ward
- An average rating of 4.75 places Naniwa Ward in solid territory. Most guests leave satisfied, though there is room for hosts to push toward the top tier.
- The strongest subcategory is Communication (4.85), while Cleanliness (4.7) trails behind — a useful signal for hosts looking to prioritize upgrades.
- 27.6% of listings carry the Guest Favorite badge, a strong trust signal that can meaningfully lift click-through and booking rates.
Recommendations for Hosts
- Focus improvement efforts on Cleanliness — even small gains in the weakest subcategory can lift overall ratings and search ranking.
- Encourage guests to leave reviews after checkout. Listings with more reviews rank higher in search results and convert browsers into bookers more effectively.
- With only 27.6% of listings earning Guest Favorite status, hosts who consistently exceed expectations have a clear competitive advantage.
Naniwa Ward Airbnb Booking Patterns (2026): Available vs. Booked Days
Available Days Distribution
Booked Days Distribution
Booking Pattern Insights for Naniwa Ward
- The most common availability pattern in Naniwa Ward falls within the 271-366 days range, representing 65.6% of listings. This suggests many properties have significant open periods on their calendars.
- Approximately 86.4% of listings show high availability (181+ days open annually), indicating potential for increased bookings or specific owner usage patterns.
- For booked days, the 31-90 days range is most frequent in Naniwa Ward (41.5%), reflecting common guest stay durations or potential owner blocking patterns.
- A notable 14.3% of properties secure long booking periods (181+ days booked per year), highlighting successful long-term rental strategies or significant owner usage.
How Far in Advance Do Guests Book Airbnb in Naniwa Ward?
Average Booking Lead Time by Month
Booking Lead Time Insights for Naniwa Ward
- The overall average booking lead time for vacation rentals in Naniwa Ward is 38 days.
- Guests book furthest in advance for stays during November (average 59 days), likely coinciding with peak travel demand or local events.
- The shortest booking windows occur for stays in July (average 25 days), indicating more last-minute travel plans during this time.
- Seasonally, Fall (51 days avg.) sees the longest lead times, while Winter (35 days avg.) has the shortest, reflecting typical travel planning cycles.
Recommendations for Hosts
- Use the overall average lead time (38 days) as a baseline for your pricing and availability strategy in Naniwa Ward.
- For November stays, consider implementing length-of-stay discounts or slightly higher rates for bookings made less than 59 days out to capitalize on advance planning.
- Target marketing efforts for the Fall season well in advance (at least 51 days) to capture early planners.
- Monitor your own booking lead times against these Naniwa Ward averages to identify opportunities for dynamic pricing adjustments.
What Is the Average Length of Stay for Airbnb in Naniwa Ward?
Guests in Naniwa Ward stay about 3.7 nights on average, generating roughly 6,838 reservations and 20.4 bookings per listing in the latest AirROI dataset. The most common check-in time is 4:00 PM and check-out is 11:00 AM.
Monthly Length of Stay in Naniwa Ward
Check-in Time Distribution
Check-out Time Distribution
Stay Pattern Insights for Naniwa Ward
- A mid-range stay length points to leisure-driven demand — weekend getaways and short vacations. Hosts should optimize for quick turnover efficiency while keeping the guest experience smooth.
- At 20.4 bookings per listing, the turnover rate is high. Hosts with streamlined operations (self-check-in, automated messaging, reliable cleaners) have a structural advantage.
- Stay lengths peak in Jun (4 nights) and shorten in Apr (3.2 nights). Adjust minimum-night requirements seasonally to match.
Recommendations for Hosts
- With shorter average stays, focus on streamlining turnover. Self-check-in, reliable cleaning crews, and pre-staged amenities can reduce per-booking operational costs.
- Set your check-in time to match or beat the market standard of 4:00 PM. Offering early check-in flexibility can be a low-cost differentiator.
- Monitor length-of-stay seasonality to adjust minimum-night requirements — longer minimums during peak periods maximize revenue while shorter minimums fill gaps in shoulder seasons.
Naniwa Ward Airbnb Minimum Stay Requirements Analysis
Distribution of Listings by Minimum Night Requirement
1 Night
108 listings
32% of total
2 Nights
174 listings
51.6% of total
3 Nights
2 listings
0.6% of total
30+ Nights
53 listings
15.7% of total
Key Insights
- The most prevalent minimum stay requirement in Naniwa Ward is 2 Nights, adopted by 51.6% of listings. This highlights the market's preference for shorter, flexible bookings.
- A strong majority (83.6%) of the Naniwa Ward Airbnb data shows acceptance of very short stays (1-2 nights), indicating a dynamic, high-turnover market.
- A significant segment (15.7%) caters to monthly stays (30+ nights) in Naniwa Ward, pointing to opportunities in the extended-stay market.
Recommendations
- Align with the market by considering a 2 Nights minimum stay, as 51.6% of Naniwa Ward hosts use this setting.
- Explore offering discounts for stays of 30+ nights to attract the 15.7% of the market seeking extended stays.
- Adjust minimum nights based on seasonality – potentially shorter during low season and longer during peak demand periods in Naniwa Ward.
Naniwa Ward Airbnb Cancellation Policy Trends Analysis (2026)
Super Strict 30 Days
3 listings
0.9% of total
Super Strict 60 Days
2 listings
0.6% of total
Limited
19 listings
5.6% of total
Flexible
61 listings
18.1% of total
Moderate
113 listings
33.5% of total
Firm
114 listings
33.8% of total
Strict
25 listings
7.4% of total
Cancellation Policy Insights for Naniwa Ward
- The prevailing Airbnb cancellation policy trend in Naniwa Ward is Firm, used by 33.8% of listings.
- There's a relatively balanced mix between guest-friendly (51.6%) and stricter (41.2%) policies, offering choices for different guest needs.
- Strict cancellation policies are quite rare (7.4%), potentially making listings with this policy less competitive unless justified by high demand or property type.
Recommendations for Hosts
- Consider adopting a Firm policy to align with the 33.8% market standard in Naniwa Ward.
- Using a Strict policy might deter some guests, as only 7.4% of listings use it. Evaluate if potential revenue protection outweighs possible lower booking rates.
- Regularly review your cancellation policy against competitors and market demand shifts in Naniwa Ward.
How Much Are Airbnb Cleaning Fees in Naniwa Ward?
Cleaning fees in Naniwa Ward are meaningful operating levers, not just pass-through charges. What matters most is how often hosts charge them, how high they run relative to market norms, and how large a share of gross revenue they consume.
Cleaning Fee Insights for Naniwa Ward
- 75.7% of listings charge a cleaning fee, making it standard practice in Naniwa Ward. Guests expect it and factor it into their booking decisions.
- The gap between the average ($83) and median ($35) cleaning fee indicates some high-end properties are pulling the average up considerably.
- Cleaning fees represent 8.5% of gross revenue on average — a modest component of the overall booking price.
Recommendations for Hosts
- Price your cleaning fee competitively against the Naniwa Ward median of $35. Fees significantly above market norms can deter bookings, especially for shorter stays.
- Monitor competitor cleaning fees regularly. Airbnb's search algorithm factors in total price, so a well-calibrated cleaning fee can improve your listing's ranking.
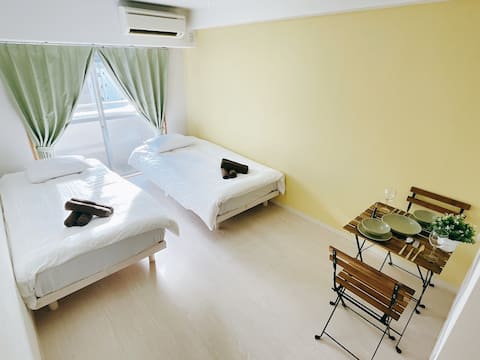
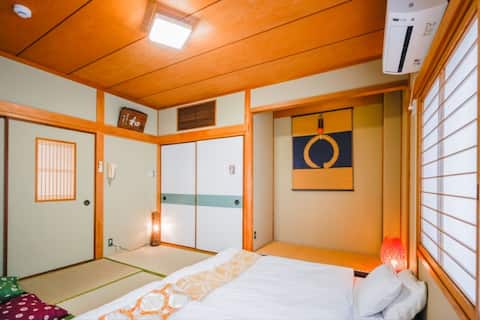
What Do the Top Airbnb Listings in Naniwa Ward Look Like?
Benchmark your potential! Explore examples of top-performing Airbnb properties in Naniwa Wardbased on Trailing Twelve Month (TTM) revenue. Analyze their characteristics, revenue, occupancy rate, and ADR to understand what drives success in this market.
![[CORE1001] spacious 6LDK apartment for 16 people](https://a0.muscache.com/im/pictures/hosting/Hosting-U3RheVN1cHBseUxpc3Rpbmc6MTM0NjEyNjAwOTA5Mjc1MTQ4Mw==/original/6725f1fa-c00f-4698-95db-adcf6b7fe3d6.jpeg?im_w=480&im_format=avif)
[CORE1001] spacious 6LDK apartment for 16 people
Entire Place • 6 bedrooms
1 min Namba! Airport Direct Access! SS2 !(V)
Entire Place • 1 bedroom
1 min Namba! Airport Direct Access! SS2 ![Y]
Entire Place • 1 bedroom
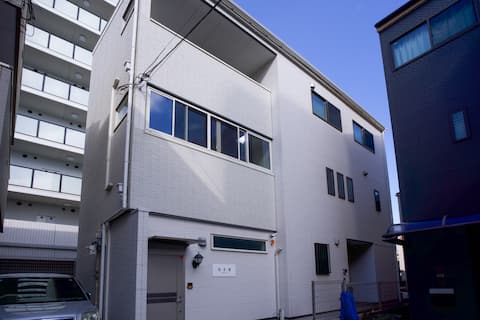
Chiko House | 140㎡ whole house | 3 minutes by subway to Shinsaibashi, Dotonbori, Nihonbashi, direct
Entire Place • 6 bedrooms
New Open!Namba Nipponbashi /big house /4bedrooms
Entire Place • 4 bedrooms
Close to Namba and Dotonbori! /Excellent access/Spacious 130-square-meter facility/Accommodates up t
Entire Place • 1 bedroom
Note: Performance varies based on location, size, amenities, seasonality, and management quality. Data reflects the past 12 months.
Who Are the Top Airbnb Hosts in Naniwa Ward?
Learn from the best! This table showcases top-performing Airbnb hosts in Naniwa Ward based on the number of properties managed and estimated total revenue over the past year. Analyze their scale and performance metrics.
| Host Name | Properties | Grossing Revenue | Stay Reviews | Avg Rating |
|---|---|---|---|---|
| Stay | 11 | $244,378 | 323 | 4.82/5.0 |
| Hazuki | 11 | $118,015 | 236 | 4.95/5.0 |
| Hiro & Hiro | 4 | $104,655 | 174 | 4.99/5.0 |
| Unito | 41 | $100,253 | 840 | 4.85/5.0 |
| Donki | 8 | $88,671 | 210 | 4.82/5.0 |
| 大介 | 2 | $83,362 | 111 | 4.84/5.0 |
| 卓也 | 1 | $82,554 | 28 | 4.75/5.0 |
| Minimalist | 11 | $78,004 | 117 | 4.63/5.0 |
| Universe | 4 | $73,641 | 55 | 4.72/5.0 |
| 太田 Isamu | 3 | $71,393 | 57 | 4.71/5.0 |
Analyzing the strategies of top hosts, such as their property selection, pricing, and guest communication, can offer valuable lessons for optimizing your own Airbnb operations in Naniwa Ward.
Who Are the Airbnb Hosts in Naniwa Ward?
Naniwa Ward is a quality-focused market, with a high Superhost share and fairly mature operating standards.
Host Profile Insights for Naniwa Ward
- With 62.9% Superhosts, Naniwa Ward has an experienced host base that sets high guest expectations. New entrants should plan for competitive quality standards.
- 0.6% of listings are professionally managed, reflecting a market still dominated by individual hosts.
- 22.3% of listings have Instant Book enabled. Lower Instant Book adoption means many guests must request approval, which can slow conversions.
- 77.2% of listings use Airbnb's simplified pricing (host-only fee), where the host pays the entire platform service fee and the guest sees one all-in price with no separate Airbnb service charge. High adoption signals a professional, PMS-connected host base — Airbnb mandates simplified pricing for software-connected listings.
Recommendations for Hosts
- Consider enabling Instant Book — it reduces booking friction and Airbnb's algorithm tends to favor Instant Book listings in search results.
- With 43.3% cohosted listings, there may be a growing local market for property management services.
- Benchmark your host metrics against these Naniwa Ward averages regularly and adjust your hosting strategy based on what top performers do differently.
Top Professional Management Companies in Naniwa Ward
These are the highest-grossing professional property management operations in Naniwa Ward, ranked by total revenue across their portfolio. Their performance metrics offer a benchmark for what institutional-level hosting looks like in this market.
| Company | Listings | Revenue | ADR | Occ. | Rating |
|---|---|---|---|---|---|
| Bnb民泊運営代行株式会社 | 1 | $37,341 | $185 | 41.3% | 4.78/5 |
| Winston | 1 | $3,358 | $220 | 11.4% | N/A |
Management Company Insights for Naniwa Ward
- The leading management company, Bnb民泊運営代行株式会社, operates 1 listings with $37,341 in gross revenue — a useful benchmark for what scale looks like in Naniwa Ward.
- Top managers average 1 properties each, suggesting professional management in Naniwa Ward still operates at a relatively boutique scale.
- Professionally managed listings in the top tier average 4.78/5 in guest ratings — demonstrating that scale and quality can coexist.
Recommendations
- With only 0.6% of listings professionally managed, there may be an opportunity to differentiate through more structured operations and consistent guest experiences.
- Study how top management companies price, position, and maintain their portfolios — their ADR and occupancy rates reflect strategies refined across dozens of listings.
- If you're considering hiring a property manager, compare their portfolio performance against these benchmarks before committing.
How Does Naniwa Ward's Airbnb Market Compare to Nearby Cities?
How does the Naniwa Ward Airbnb market stack up against its neighbors? Compare key performance metrics like average monthly revenue, ADR, and occupancy rates in surrounding areas to understand the broader regional STR landscape.
Compared with Fukushima Ward, Naniwa Ward has 20 percentage points lower occupancy and about $67 lower ADR. That helps frame whether this market is winning more on demand, pricing, or both.
| Market | Active Properties | Monthly Revenue | Daily Rate | Avg. Occupancy |
|---|---|---|---|---|
| Minamiawaji | 50 | $3,611 | $344.11 | 38% |
| Toba | 16 | $3,532 | $366.68 | 31% |
| Fushimi Ward | 18 | $3,307 | $257.13 | 51% |
| Fukushima Ward | 11 | $3,265 | $171.12 | 58% |
| Awaji | 106 | $3,185 | $289.93 | 38% |
| Shimogyo Ward | 75 | $3,022 | $227.79 | 47% |
| Shima | 53 | $3,009 | $309.70 | 35% |
| Kamigyo Ward | 18 | $2,853 | $198.36 | 49% |
| Kyoto | 4,110 | $2,837 | $193.53 | 52% |
| Nakagawa | 13 | $2,517 | $223.02 | 46% |
Frequently Asked Questions About Airbnb in Naniwa Ward
These quick answers summarize the most common investor and operator questions using AirROI's latest market data for Naniwa Ward.
How much do Airbnb hosts make in Naniwa Ward?
Naniwa Ward hosts earn about $9,637 per year on average, with an average nightly rate of $104 and RevPAR of $41. Those figures describe the typical revenue environment for active listings in Naniwa Ward, Osaka, not the ceiling for the best operators. Source: AirROI 2026 data, Naniwa Ward market, July 2025 to June 2026.
What is the average Airbnb occupancy rate in Naniwa Ward?
The average Airbnb occupancy rate in Naniwa Ward is 38.0%. October is the strongest month and June is the softest, so hosts should expect demand to move meaningfully throughout the year rather than stay flat.
What is the average Airbnb daily rate in Naniwa Ward?
Listings in Naniwa Ward average $104 per night. The broader pricing spread also matters: lower-performing listings cluster closer to the lower quartiles, while premium homes can price materially above the city average when demand spikes or listing quality stands out.
How many Airbnb listings are active in Naniwa Ward?
Naniwa Ward currently has about 337 active Airbnb listings in AirROI's market dataset. That supply count helps explain how competitive the market is, how much depth there is for benchmarking, and whether the market behaves like a niche destination or a scaled urban market.
How strict are short-term rental regulations in Naniwa Ward?
AirROI currently classifies the short-term rental regulation level in Naniwa Ward as High. The dataset also shows about 98.8% of listings with registration evidence. That is a market signal, not legal advice, so hosts should still confirm current licensing and compliance rules locally before listing.
What is the RevPAR for Airbnb in Naniwa Ward?
RevPAR in Naniwa Ward is about $41. That metric combines pricing and occupancy into one efficiency number, so it is often a better quick benchmark than ADR alone when investors want to compare how well listings convert nightly rates into realized revenue.
Is Airbnb profitable in Naniwa Ward?
Occupancy of 38.0% means Naniwa Ward is a more selective market. Profitability is achievable but requires careful cost management, premium positioning, or targeting longer stays to reduce turnover. Average annual revenue is $9,637, but individual returns depend on property type, location within the city, and the host's operating efficiency.
How far in advance do guests book Airbnb in Naniwa Ward?
The average booking lead time in Naniwa Ward is about 38 days — a moderate lead time that gives hosts planning visibility while still benefiting from last-minute bookings. Hosts who understand their market's booking cadence can adjust minimum stays and pricing windows accordingly.
What are the best neighborhoods for Airbnb in Naniwa Ward?
Based on AirROI's analysis, some of the top neighborhoods for short-term rentals in Naniwa Ward include Namba, Shinsaibashi, Dotonbori. Each area attracts different guest profiles — from business travelers to leisure visitors — so the best location depends on the property type and target audience a host is aiming for. See the full neighborhood breakdown above.
What type of property performs best on Airbnb in Naniwa Ward?
entire_home listings make up 78.3% of the active supply in Naniwa Ward. The most common configuration does not always mean the most profitable — operators who identify underserved property types or bedroom counts can sometimes outperform the market average by filling a gap in local supply.
How does Naniwa Ward compare to nearby Airbnb markets?
Among neighboring markets, Minamiawaji posts $43,327 in average annual revenue with 38.1% occupancy, compared to Naniwa Ward's $9,637 and 38.0%. Comparing nearby markets helps investors understand whether a destination's performance reflects local demand or broader regional trends.
What is the average length of stay in Naniwa Ward?
The average Airbnb stay length in Naniwa Ward is about 3.7 nights. That matters for turnover, cleaning operations, and pricing strategy because shorter stays increase changeovers while longer stays can smooth occupancy and reduce operational friction.
What is the average Airbnb guest rating in Naniwa Ward?
Airbnb listings in Naniwa Ward average 4.75 out of 5 overall. About 27.6% of listings carry the guest favorite badge, which suggests a meaningful share of inventory is competing on review quality rather than price alone.
Which amenities boost Airbnb revenue in Naniwa Ward?
Babysitter recommendations and High chair are among the strongest revenue-linked amenities in Naniwa Ward. In AirROI's latest dataset, listings with these amenities outperform those without on average revenue, which makes amenities analysis useful for prioritizing investment and listing upgrades.
Do Airbnb hosts charge cleaning fees in Naniwa Ward?
Yes. About 75.7% of active Airbnb listings in Naniwa Ward charge a cleaning fee, and the average fee is $83. The more important operating benchmark is how much of gross revenue that fee consumes, not just the absolute dollar amount.
What percentage of Airbnb hosts are Superhosts in Naniwa Ward?
A 62.9% Superhost rate signals a highly competitive market where review quality and responsiveness are table stakes, not differentiators.
About AirROI Market Data
AirROI tracks over 20 million properties across 190+ countries and maintains 15+ years of historical performance data, making it one of the deepest Airbnb and STR intelligence platforms available. The analytics pipeline aggregates listing-level data monthly — revenue, occupancy, nightly rates, RevPAR, guest demographics, booking patterns, and competitive supply — so investors and operators can benchmark any market against its own history and against neighboring destinations.
Real estate investors, property managers, financial institutions, hedge funds, tourism boards, hospitality consultants, tech platforms, and academic researchers rely on AirROI data to underwrite acquisitions, optimize pricing, model macro trends, and conduct peer-reviewed research. Data is available through in-depth market reports like this one and the Airbnb API with 22 endpoints and an Airbnb MCP Server for AI agents.
AirROI proprietary analytics as of 2026-06-30. Metrics reflect trailing twelve-month aggregates from active listings. Revenue figures are market averages, not projections. Neighborhood descriptions are AI-generated and reviewed for accuracy. For full methodology, see the data methodology page.