Tokyo, Tokyo Airbnb Market Data 2025: STR Report & Statistics
How much can you earn on Airbnb in Tokyo, Tokyo? Based on AirROI's 2025 dataset (June 2024 – May 2025), the short answer is $30,362 per year — at a $177 nightly rate, 60.4% occupancy, and a N/A RevPAR.
Tokyo's 15,369 active listings and solid booking activity throughout the year make it a major short-term rental market. Supply grew 74.2% over the past year, yet revenue and nightly rates both trended upward — a signal that traveler demand is outpacing new inventory rather than being diluted by it. For hosts, pricing power remains intact even as competition increases.
Regulation is high and 75% of listings show active registration — compliance is the cost of entry. The data points to a market where fundamentals reward execution — the right property, priced well, in the right neighborhood still outperforms.

Table of Contents [hide] [show]
What Are the Key Airbnb Metrics in Tokyo?
In Tokyo, the headline Airbnb metrics are $30,362 in average annual revenue,60.4% occupancy, $177 ADR, and $0 in RevPAR, and guests book about 51 days in advance.
How Much Do Airbnb Hosts Earn Monthly in Tokyo?
Understanding the monthly revenue variations for Airbnb listings in Tokyo is key to maximizing your short term rental income potential. Seasonality significantly impacts earnings. Our analysis, based on data from the past 12 months, shows that the peak revenue month for STRs in Tokyo is typically April, while September often presents the lowest earnings, highlighting opportunities for strategic pricing adjustments during shoulder and low seasons. Explore the typical Airbnb income in Tokyo across different performance tiers:
- Best-in-class properties (Top 10%) achieve $6,921+ monthly, often utilizing dynamic pricing and superior guest experiences.
- Strong performing properties (Top 25%) earn $4,319 or more, indicating effective management and desirable locations/amenities.
- Typical properties (Median) generate around $2,595 per month, representing the average market performance.
- Entry-level properties (Bottom 25%) see earnings around $1,387, often with potential for optimization.
Average Monthly Airbnb Earnings Trend in Tokyo
What Is the Monthly Airbnb Occupancy Rate in Tokyo?
Maximize your bookings by understanding the Tokyo STR occupancy trends. Seasonal demand shifts significantly influence how often properties are booked. Typically, Aprilsees the highest demand (peak season occupancy), while May experiences the lowest (low season). Effective strategies, like adjusting minimum stays or offering promotions, can boost occupancy during slower periods. Here's how different property tiers perform in Tokyo:
- Best-in-class properties (Top 10%) achieve 93%+ occupancy, indicating high desirability and potentially optimized availability.
- Strong performing properties (Top 25%) maintain 87% or higher occupancy, suggesting good market fit and guest satisfaction.
- Typical properties (Median) have an occupancy rate around 71%.
- Entry-level properties (Bottom 25%) average 41% occupancy, potentially facing higher vacancy.
Average Monthly Occupancy Rate Trend in Tokyo
What Is the Average Airbnb Nightly Rate in Tokyo?
Effective short term rental pricing strategy in Tokyo involves understanding monthly ADR fluctuations. The Average Daily Rate (ADR) for Airbnb in Tokyo typically peaks in April and dips lowest during September. Leveraging Airbnb dynamic pricing tools or strategies based on this seasonality can significantly boost revenue. Here's a look at the typical nightly rates achieved:
- Best-in-class properties (Top 10%) command rates of $353+ per night, often due to premium features or locations.
- Strong performing properties (Top 25%) achieve nightly rates of $220 or more.
- Typical properties (Median) charge around $133 per night.
- Entry-level properties (Bottom 25%) earn around $85 per night.
Average Daily Rate (ADR) Trend by Month in Tokyo
What Is the RevPAR for Airbnb in Tokyo?
RevPAR in Tokyo is currently N/A. Because RevPAR combines nightly rates with realized occupancy, it is one of the cleanest ways to compare how efficiently listings turn demand into revenue across the market.
- Entry-level properties (Bottom 25%) see N/A RevPAR.
- Typical properties (Median) generate N/A RevPAR.
- Strong performers (Top 25%) earn N/A RevPAR.
- Best-in-class (Top 10%) achieve N/A RevPAR.
Average Monthly RevPAR Trend in Tokyo
RevPAR Insights for Tokyo
- RevPAR peaks in Jan and bottoms out in Jan, mirroring the broader seasonal demand pattern and suggesting opportunities for dynamic pricing.
Recommendations for Hosts
- Track your own RevPAR monthly against these Tokyo benchmarks. If your RevPAR falls below the median of N/A, examine whether low occupancy or low ADR is the primary drag.
- Use RevPAR rather than revenue alone when comparing properties of different sizes — it normalizes for available nights and gives a more accurate picture of performance.
Get Live Tokyo Market Intelligence 👇
Explore Real-time Analytics
When Is the Peak Season for Airbnb in Tokyo?
Tokyo's peak Airbnb season falls in April, March, December, while the softest stretch is August, September, November. Overall, the market shows moderate seasonality with distinct peak and low periods, which should guide pricing, minimum stays, and cash-flow planning.
Peak Season (April, March, December)
- Revenue averages $4,176 per month
- Occupancy rates average 68.5%
- Daily rates average $200
Shoulder Season
- Revenue averages $3,261 per month
- Occupancy maintains around 61.7%
- Daily rates hold near $183
Low Season (August, September, November)
- Revenue drops to average $2,792 per month
- Occupancy decreases to average 58.6%
- Daily rates adjust to average $173
Seasonality Insights for Tokyo
- The Airbnb seasonality pattern in Tokyo shows moderate seasonality with distinct peak and low periods. While the sections above show seasonal averages, it is also insightful to look at the extremes:
- During the high season, the absolute peak month showcases Tokyo's highest earning potential, with monthly revenues climbing to $4,613, occupancy reaching 72.7%, and ADRs peaking at $211.
- Conversely, the slowest single month marks the market's lowest point — revenue may dip to $2,686, occupancy could drop to 54.5%, and ADRs may adjust to $170.
- Understanding both the seasonal averages and these monthly peaks and troughs in revenue, occupancy, and ADR is crucial for maximizing your Airbnb profit potential in Tokyo.
Seasonal Strategies for Maximizing Profit
- Peak Season: Maximize revenue through premium pricing. In a high-regulation market like Tokyo, ensure your permit covers the number of nights you plan to book — some jurisdictions cap annual rental days.
- Low Season: Even in a market with solid annual occupancy, the slower months benefit from competitive pricing and flexible check-in/check-out windows. Target remote workers and extended-stay travelers who value value over peak-season amenities.
- Shoulder Seasons: Implement dynamic pricing that bridges peak and low rates. Target weekend travelers, local events, and business visitors. Slightly more flexible terms than peak season can help maintain occupancy without deep discounting.
- Regularly analyze your own performance against these Tokyo seasonality benchmarks and adjust your pricing and availability strategy accordingly.
Do You Need a License for Airbnb in Tokyo?
Yes, Tokyo, Tokyo, Japan enforces high STR regulations and 75% of active listings show registration evidence — indicating that enforcement is active and compliance is a prerequisite for operating legally. Hosts entering this market should budget for permit fees, inspections, and potential occupancy tax obligations as part of their startup costs. Always verify the latest short-term rental regulations and Airbnb license requirements directly with local government authorities for Tokyo to ensure full compliance before hosting.
(Source: AirROI data, 2026, based on 75% licensed listings)
What Are the Best Neighborhoods for Airbnb in Tokyo?
In a large, heavily regulated market like Tokyo, neighborhood selection is one of the strongest levers for Airbnb investment performance. Zoning rules, permitting availability, and guest demand patterns can vary block by block. The 8 neighborhoods below represent areas where short-term rental activity concentrates — understanding why each one attracts guests and hosts helps investors evaluate where their property type and budget fit best.
| Neighborhood / Area | Why Host Here? (Target Guests & Appeal) | Key Attractions & Landmarks |
|---|---|---|
| Shinjuku | A bustling area known for its vibrant nightlife, shopping, and dining. Shinjuku is a major commercial and transport hub, attracting many tourists year-round. | Tokyo Metropolitan Government Building, Shinjuku Gyoen National Garden, Omoide Yokocho, Golden Gai, Robot Restaurant |
| Shibuya | Famous for the iconic Shibuya Crossing, this area is a youthful hub with trendy shops, cafes, and nightlife. It is popular with both locals and tourists. | Shibuya Crossing, Hachiko Statue, Shibuya 109, Yoyogi Park, Meiji Shrine |
| Asakusa | Home to the historic Senso-ji Temple, Asakusa offers a glimpse into traditional Tokyo, making it a popular area for tourists seeking cultural experiences. | Senso-ji Temple, Nakamise Street, Tokyo Skytree, Asakusa Culture and Tourism Center, Sumida Park |
| Ginza | Tokyo's upscale shopping and dining district, Ginza offers luxury experiences and is popular with affluent visitors looking to indulge in high-end shopping and cuisine. | Ginza Six, Kabukiza Theatre, Shops and restaurants on Chuo Dori, Tsukiji Outer Market, Art galleries |
| Akihabara | Known as the center of otaku culture, Akihabara attracts anime and gaming fans. It's a vibrant district filled with electronics stores and themed cafes. | Maid Cafes, Akihabara Electric Town, Gachapon Hall, Anime shops, Super Potato |
| Harajuku | Famous for its unique fashion culture and trendsetting youth, Harajuku is a hotspot for shopping, dining, and people-watching, attracting a younger crowd. | Takeshita Street, Meiji Jingu Shrine, Omotesando, Yoyogi Park, Harajuku's unique shops |
| Ueno | Ueno is known for its park, museums, and zoo. It attracts families and culture enthusiasts, making it a great spot for cultural tourism. | Ueno Park, Tokyo National Museum, Ueno Zoo, Ameyoko Shopping Street, Tokyo Metropolitan Art Museum |
| Roppongi | Famous for its nightlife and cultural scene, Roppongi attracts both tourists and expats, making it an appealing choice for short-term rentals. | Roppongi Hills, Mori Art Museum, Tokyo Tower, National Art Center, Nightclubs and bars |
Because Tokyo has a high regulation profile, confirming that short-term rental permits are available in your target neighborhood is a critical first step before committing to a property purchase. Regulation can vary at the neighborhood or district level even within the same city.
What Types of Properties Are on Airbnb in Tokyo?
Room Type Distribution
Property Type Distribution
Market Composition Insights for Tokyo
- The Tokyo Airbnb market composition is heavily skewed towards Entire Home/Apt listings, which make up 81.6% of the 15,369 active rentals. This indicates strong guest preference for privacy and space.
- Looking at the property type distribution in Tokyo, Apartment/Condo properties are the most common (71.9%), reflecting the local real estate landscape.
- Houses represent a significant 18.8% portion, catering likely to families or larger groups.
- The presence of 8.6% Hotel/Boutique listings indicates integration with traditional hospitality.
- Smaller segments like outdoor/unique, others, unique stays (combined 0.7%) offer potential for unique stay experiences.
Tokyo Airbnb Room Capacity Analysis (2026): Bedroom Distribution
Distribution of Listings by Number of Bedrooms
Room Capacity Insights for Tokyo
- The dominant room capacity in Tokyo is 1 bedroom listings, making up 61% of the market. This suggests a strong demand for properties suitable for couples or solo travelers.
- Together, 1 bedroom and 2 bedrooms properties represent 76.8% of the active Airbnb listings in Tokyo, indicating a high concentration in these sizes.
- With over half the market (61%) consisting of studios or 1-bedroom units, Tokyo is particularly well-suited for individuals or couples.
Tokyo Vacation Rental Guest Capacity Trends (2026)
Distribution of Listings by Guest Capacity
Guest Capacity Insights for Tokyo
- The most common guest capacity trend in Tokyo vacation rentals is listings accommodating 2 guests (22.2%). This suggests the primary traveler segment is likely couples or solo travelers.
- Properties designed for 2 guests and 4 guests dominate the Tokyo STR market, accounting for 39.5% of listings.
- 27.0% of properties accommodate 6+ guests, serving the market segment for larger families or group travel in Tokyo.
- On average, properties in Tokyo are equipped to host 4.0 guests.
What Amenities Do Airbnb Guests Expect in Tokyo?
Amenity Prevalence
Amenity Insights for Tokyo
- Essential amenities in Tokyo that guests expect include: Air conditioning, Wifi, Smoke alarm, Hair dryer, Shampoo. Lacking these (any) could significantly impact bookings.
- Popular amenities like Washer, Hot water, Essentials are common but not universal. Offering these can provide a competitive edge.
Recommendations for Hosts
- Ensure your listing includes all essential amenities for Tokyo: Air conditioning, Wifi, Smoke alarm, Hair dryer, Shampoo.
- Prioritize adding missing essentials: Air conditioning, Wifi, Smoke alarm, Hair dryer, Shampoo.
- Consider adding popular differentiators like Washer or Hot water to increase appeal.
- Highlight unique or less common amenities you offer (e.g., hot tub, dedicated workspace, EV charger) in your listing description and photos.
- Regularly check competitor amenities in Tokyo to stay competitive.
Dive Deeper: Advanced Tokyo STR Market Data (2026)
Ready to unlock more insights? AirROI provides access to advanced metrics and comprehensive Airbnb data for Tokyo. Explore detailed analytics beyond this report to refine your investment strategy, optimize pricing, and maximize your vacation rental profits.
Explore Advanced MetricsTokyo Airbnb Guest Demographics & Profile Analysis (2026)
Guest Profile Summary for Tokyo
- The typical guest profile for Airbnb in Tokyo consists of predominantly international visitors (95%), with top international origins including Australia, typically belonging to the Post-2000s (Gen Z/Alpha) group (50%), primarily speaking English or Chinese.
- Domestic travelers account for 5.3% of guests.
- Key international markets include United States (27.1%) and Australia (8.4%).
- Top languages spoken are English (47.2%) followed by Chinese (11.5%).
- A significant demographic segment is the Post-2000s (Gen Z/Alpha) group, representing 50% of guests.
Recommendations for Hosts
- Focus marketing internationally, particularly towards travelers from Australia.
- Tailor amenities and listing descriptions to appeal to the dominant Post-2000s (Gen Z/Alpha) demographic (e.g., highlight fast WiFi, smart home features, local guides).
- Highlight unique local experiences or amenities relevant to the primary guest profile.
- Consider seasonal promotions aligned with peak travel times for key origin markets.
Tokyo Airbnb Booking Patterns (2026): Available vs. Booked Days
Available Days Distribution
Booked Days Distribution
Booking Pattern Insights for Tokyo
- The most common availability pattern in Tokyo falls within the 181-270 days range, representing 32.2% of listings. This suggests many properties have significant open periods on their calendars.
- Approximately 54.4% of listings show high availability (181+ days open annually), indicating potential for increased bookings or specific owner usage patterns.
- For booked days, the 91-180 days range is most frequent in Tokyo (32.3%), reflecting common guest stay durations or potential owner blocking patterns.
- A notable 46.7% of properties secure long booking periods (181+ days booked per year), highlighting successful long-term rental strategies or significant owner usage.
How Far in Advance Do Guests Book Airbnb in Tokyo?
Average Booking Lead Time by Month
Booking Lead Time Insights for Tokyo
- The overall average booking lead time for vacation rentals in Tokyo is 51 days.
- Guests book furthest in advance for stays during April (average 80 days), likely coinciding with peak travel demand or local events.
- The shortest booking windows occur for stays in July (average 34 days), indicating more last-minute travel plans during this time.
- Seasonally, Spring (68 days avg.) sees the longest lead times, while Summer (43 days avg.) has the shortest, reflecting typical travel planning cycles.
Recommendations for Hosts
- Use the overall average lead time (51 days) as a baseline for your pricing and availability strategy in Tokyo.
- For April stays, consider implementing length-of-stay discounts or slightly higher rates for bookings made less than 80 days out to capitalize on advance planning.
- Target marketing efforts for the Spring season well in advance (at least 68 days) to capture early planners.
- Monitor your own booking lead times against these Tokyo averages to identify opportunities for dynamic pricing adjustments.
Tokyo Airbnb Minimum Stay Requirements Analysis
Distribution of Listings by Minimum Night Requirement
1 Night
5801 listings
38.8% of total
2 Nights
3110 listings
20.8% of total
3 Nights
674 listings
4.5% of total
4-6 Nights
429 listings
2.9% of total
7-29 Nights
759 listings
5.1% of total
30+ Nights
4190 listings
28% of total
Key Insights
- The most prevalent minimum stay requirement in Tokyo is 1 Night, adopted by 38.8% of listings. This highlights the market's preference for shorter, flexible bookings.
- A significant segment (28%) caters to monthly stays (30+ nights) in Tokyo, pointing to opportunities in the extended-stay market.
Recommendations
- Align with the market by considering a 1 Night minimum stay, as 38.8% of Tokyo hosts use this setting.
- Explore offering discounts for stays of 30+ nights to attract the 28% of the market seeking extended stays.
- Adjust minimum nights based on seasonality – potentially shorter during low season and longer during peak demand periods in Tokyo.
Tokyo Airbnb Cancellation Policy Trends Analysis (2026)
Super Strict 60 Days
151 listings
1.1% of total
Super Strict 30 Days
72 listings
0.5% of total
Refundable
44 listings
0.3% of total
Non-refundable
20 listings
0.1% of total
Flexible
1328 listings
9.3% of total
Moderate
2416 listings
16.9% of total
Firm
2777 listings
19.4% of total
Strict
7502 listings
52.4% of total
Cancellation Policy Insights for Tokyo
- The prevailing Airbnb cancellation policy trend in Tokyo is Strict, used by 52.4% of listings.
- A majority (71.8%) of hosts in Tokyo utilize Firm or Strict policies, indicating a market where hosts prioritize booking security.
Recommendations for Hosts
- Consider adopting a Strict policy to align with the 52.4% market standard in Tokyo.
- With 52.4% using Strict terms, this is a viable option in Tokyo, particularly for high-value properties or during peak demand periods.
- Regularly review your cancellation policy against competitors and market demand shifts in Tokyo.
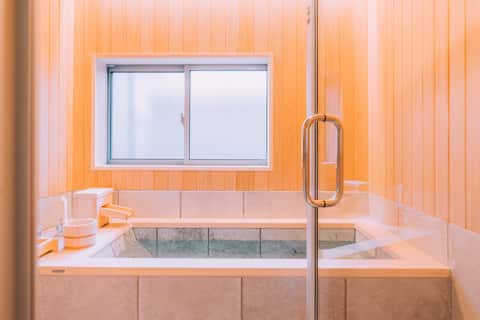
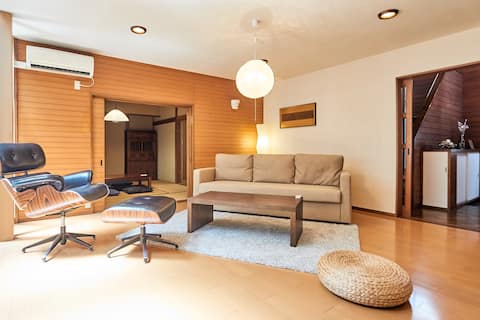
What Do the Top Airbnb Listings in Tokyo Look Like?
Benchmark your potential! Explore examples of top-performing Airbnb properties in Tokyobased on Trailing Twelve Month (TTM) revenue. Analyze their characteristics, revenue, occupancy rate, and ADR to understand what drives success in this market.
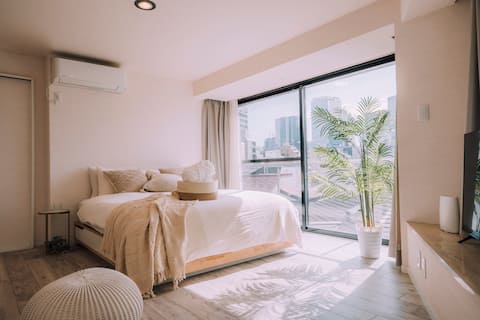
One Shibuya Hill: Urban Oasis
Entire Place • 6 bedrooms
One Harajuku: Private Oasis
Entire Place • 3 bedrooms
Perfect base for Tokyo sightseeing in a secluded mansion, a location in the center of Shibuya, and a
Entire Place • 5 bedrooms
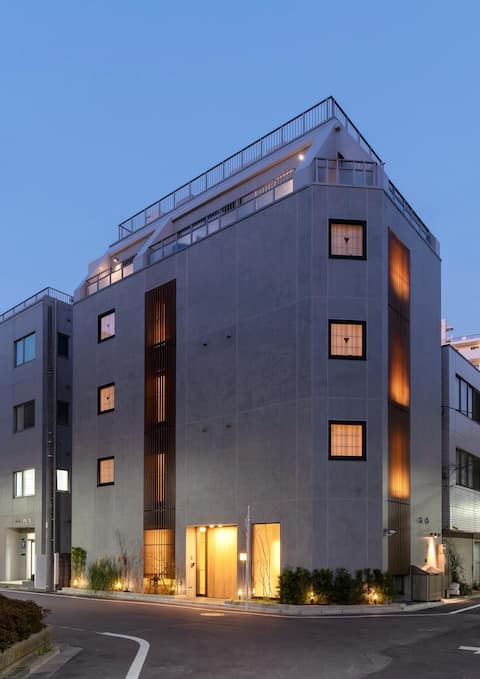
![[ Entire Building Rental] Musashi Condo Shinjuku](https://a0.muscache.com/im/pictures/7e541ada-e322-413a-8664-50bf52576d82.jpg?im_w=480&im_format=avif)
[ Entire Building Rental] Musashi Condo Shinjuku
Entire Place • 3 bedrooms
Modern Japanese-style sui (close to Ueno Park, National Museum, Western Art Museum, Asakusa)
Entire Place • 7 bedrooms
JR Yamanote Line Shin-Okubo Station 40sec/132 ㎡/2 Shower
Entire Place • 4 bedrooms
Note: Performance varies based on location, size, amenities, seasonality, and management quality. Data reflects the past 12 months.
Who Are the Top Airbnb Hosts in Tokyo?
Learn from the best! This table showcases top-performing Airbnb hosts in Tokyo based on the number of properties managed and estimated total revenue over the past year. Analyze their scale and performance metrics.
| Host Name | Properties | Grossing Revenue | Stay Reviews | Avg Rating |
|---|---|---|---|---|
| Chisaki | 98 | $4,596,010 | 4752 | 4.80/5.0 |
| Eric | 90 | $4,048,597 | 4476 | 4.85/5.0 |
| Jang | 43 | $4,036,302 | 1444 | 4.86/5.0 |
| 宅東 | 124 | $3,619,396 | 3152 | 4.75/5.0 |
| 雅人 | 86 | $2,809,433 | 2729 | 4.61/5.0 |
| UI Home Company | 74 | $2,805,451 | 2159 | 4.53/5.0 |
| Ken'S Place | 68 | $2,460,886 | 2323 | 4.70/5.0 |
| Junko | 50 | $2,313,841 | 1990 | 4.87/5.0 |
| 宅東 | 70 | $2,122,397 | 1357 | 4.82/5.0 |
| エルエー3 | 33 | $2,005,141 | 1977 | 4.62/5.0 |
Analyzing the strategies of top hosts, such as their property selection, pricing, and guest communication, can offer valuable lessons for optimizing your own Airbnb operations in Tokyo.
How Does Tokyo's Airbnb Market Compare to Nearby Cities?
How does the Tokyo Airbnb market stack up against its neighbors? Compare key performance metrics like average monthly revenue, ADR, and occupancy rates in surrounding areas to understand the broader regional STR landscape.
Compared with Tsuru, Tokyo has 5 percentage points higher occupancy and about $54 lower ADR. That helps frame whether this market is winning more on demand, pricing, or both.
| Market | Active Properties | Monthly Revenue | Daily Rate | Avg. Occupancy |
|---|---|---|---|---|
| Hakone | 306 | $4,230 | $314.00 | 51% |
| Futtsu | 29 | $4,091 | $393.45 | 39% |
| Kamogawa | 32 | $3,975 | $310.10 | 41% |
| Fujikawaguchiko | 428 | $3,905 | $268.73 | 54% |
| Karuizawa | 114 | $3,901 | $409.25 | 41% |
| Kusatsu | 27 | $3,889 | $371.38 | 38% |
| Miyota | 39 | $3,763 | $297.79 | 46% |
| Kyonan | 14 | $3,444 | $430.70 | 40% |
| Oshino | 11 | $3,358 | $529.52 | 32% |
| Tsuru | 21 | $3,300 | $231.33 | 55% |
Frequently Asked Questions About Airbnb in Tokyo
These quick answers summarize the most common investor and operator questions using AirROI's latest market data for Tokyo.
How much do Airbnb hosts make in Tokyo?
Tokyo hosts earn about $30,362 per year on average, with an average nightly rate of $177 and RevPAR of N/A. Those figures describe the typical revenue environment for active listings in Tokyo, Tokyo, not the ceiling for the best operators. Source: AirROI 2025 data, Tokyo market, June 2024 to May 2025.
What is the average Airbnb occupancy rate in Tokyo?
The average Airbnb occupancy rate in Tokyo is 60.4%. April is the strongest month and September is the softest, so hosts should expect demand to move meaningfully throughout the year rather than stay flat.
What is the average Airbnb daily rate in Tokyo?
Listings in Tokyo average $177 per night. The broader pricing spread also matters: lower-performing listings cluster closer to the lower quartiles, while premium homes can price materially above the city average when demand spikes or listing quality stands out.
How many Airbnb listings are active in Tokyo?
Tokyo currently has about 15,369 active Airbnb listings in AirROI's market dataset. That supply count helps explain how competitive the market is, how much depth there is for benchmarking, and whether the market behaves like a niche destination or a scaled urban market.
How strict are short-term rental regulations in Tokyo?
AirROI currently classifies the short-term rental regulation level in Tokyo as High. The dataset also shows about 74.9% of listings with registration evidence. That is a market signal, not legal advice, so hosts should still confirm current licensing and compliance rules locally before listing.
What is the RevPAR for Airbnb in Tokyo?
RevPAR in Tokyo is about N/A. That metric combines pricing and occupancy into one efficiency number, so it is often a better quick benchmark than ADR alone when investors want to compare how well listings convert nightly rates into realized revenue.
Is Airbnb profitable in Tokyo?
At 60.4% occupancy, Tokyo can be profitable — but margins depend heavily on operating costs, property acquisition price, and how well hosts optimize pricing across seasons. Average annual revenue is $30,362, but individual returns depend on property type, location within the city, and the host's operating efficiency.
How far in advance do guests book Airbnb in Tokyo?
The average booking lead time in Tokyo is about 51 days — a longer planning horizon typical of destination or vacation markets where travelers book well in advance. Hosts who understand their market's booking cadence can adjust minimum stays and pricing windows accordingly.
What are the best neighborhoods for Airbnb in Tokyo?
Based on AirROI's analysis, some of the top neighborhoods for short-term rentals in Tokyo include Shinjuku, Shibuya, Asakusa. Each area attracts different guest profiles — from business travelers to leisure visitors — so the best location depends on the property type and target audience a host is aiming for. See the full neighborhood breakdown above.
What type of property performs best on Airbnb in Tokyo?
entire_home listings make up 81.6% of the active supply in Tokyo. The most common configuration does not always mean the most profitable — operators who identify underserved property types or bedroom counts can sometimes outperform the market average by filling a gap in local supply.
How does Tokyo compare to nearby Airbnb markets?
Among neighboring markets, Hakone posts $50,761 in average annual revenue with 50.7% occupancy, compared to Tokyo's $30,362 and 60.4%. Comparing nearby markets helps investors understand whether a destination's performance reflects local demand or broader regional trends.
When is the peak season for Airbnb in Tokyo?
April is the highest-revenue month in Tokyo, while September is the softest. The revenue spread between them indicates moderate seasonality with a clear peak period, giving hosts opportunities to maximize rates during high demand without facing dramatic off-season drops.
About AirROI Market Data
AirROI tracks over 20 million properties across 190+ countries and maintains 15+ years of historical performance data, making it one of the deepest Airbnb and STR intelligence platforms available. The analytics pipeline aggregates listing-level data monthly — revenue, occupancy, nightly rates, RevPAR, guest demographics, booking patterns, and competitive supply — so investors and operators can benchmark any market against its own history and against neighboring destinations.
Real estate investors, property managers, financial institutions, hedge funds, tourism boards, hospitality consultants, tech platforms, and academic researchers rely on AirROI data to underwrite acquisitions, optimize pricing, model macro trends, and conduct peer-reviewed research. Data is available through in-depth market reports like this one and the Airbnb API with 22 endpoints and an Airbnb MCP Server for AI agents.
AirROI proprietary analytics as of 2025-05-31. Metrics reflect trailing twelve-month aggregates from active listings. Revenue figures are market averages, not projections. Neighborhood descriptions are AI-generated and reviewed for accuracy. For full methodology, see the data methodology page.