Safra, Keserwan-Jbeil Governorate Airbnb Market Data 2025: STR Report & Statistics
How much can you earn on Airbnb in Safra, Keserwan-Jbeil Governorate? Based on AirROI's 2025 dataset (June 2024 – May 2025), the short answer is $2,325 per year — at a $111 nightly rate, 18.5% occupancy, and a N/A RevPAR.
With just 20 active listings, Safra is a micro-market where selective demand that rewards strong listing quality and pricing strategy. Supply grew 122.2% and nightly rates have risen, creating an environment where the most bookable listings stand to capture outsized share. Hosts who pair competitive pricing with strong guest experience are well-positioned to convert the growing traveler base into consistent bookings.
Regulation is high, and hosts should factor licensing costs and compliance timelines into their launch plan. In a market this size, differentiated listings with strong reviews can capture outsized returns relative to the competition.

Table of Contents [hide] [show]
What Are the Key Airbnb Metrics in Safra?
In Safra, the headline Airbnb metrics are $2,325 in average annual revenue,18.5% occupancy, $111 ADR, and $0 in RevPAR, and guests book about 14 days in advance.
How Much Do Airbnb Hosts Earn Monthly in Safra?
Understanding the monthly revenue variations for Airbnb listings in Safra is key to maximizing your short term rental income potential. Seasonality significantly impacts earnings. Our analysis, based on data from the past 12 months, shows that the peak revenue month for STRs in Safra is typically July, while March often presents the lowest earnings, highlighting opportunities for strategic pricing adjustments during shoulder and low seasons. Explore the typical Airbnb income in Safra across different performance tiers:
- Best-in-class properties (Top 10%) achieve $1,204+ monthly, often utilizing dynamic pricing and superior guest experiences.
- Strong performing properties (Top 25%) earn $657 or more, indicating effective management and desirable locations/amenities.
- Typical properties (Median) generate around $342 per month, representing the average market performance.
- Entry-level properties (Bottom 25%) see earnings around $209, often with potential for optimization.
Average Monthly Airbnb Earnings Trend in Safra
What Is the Monthly Airbnb Occupancy Rate in Safra?
Maximize your bookings by understanding the Safra STR occupancy trends. Seasonal demand shifts significantly influence how often properties are booked. Typically, Julysees the highest demand (peak season occupancy), while March experiences the lowest (low season). Effective strategies, like adjusting minimum stays or offering promotions, can boost occupancy during slower periods. Here's how different property tiers perform in Safra:
- Best-in-class properties (Top 10%) achieve 45%+ occupancy, indicating high desirability and potentially optimized availability.
- Strong performing properties (Top 25%) maintain 26% or higher occupancy, suggesting good market fit and guest satisfaction.
- Typical properties (Median) have an occupancy rate around 12%.
- Entry-level properties (Bottom 25%) average 8% occupancy, potentially facing higher vacancy.
Average Monthly Occupancy Rate Trend in Safra
What Is the Average Airbnb Nightly Rate in Safra?
Effective short term rental pricing strategy in Safra involves understanding monthly ADR fluctuations. The Average Daily Rate (ADR) for Airbnb in Safra typically peaks in May and dips lowest during June. Leveraging Airbnb dynamic pricing tools or strategies based on this seasonality can significantly boost revenue. Here's a look at the typical nightly rates achieved:
- Best-in-class properties (Top 10%) command rates of $182+ per night, often due to premium features or locations.
- Strong performing properties (Top 25%) achieve nightly rates of $137 or more.
- Typical properties (Median) charge around $80 per night.
- Entry-level properties (Bottom 25%) earn around $56 per night.
Average Daily Rate (ADR) Trend by Month in Safra
What Is the RevPAR for Airbnb in Safra?
RevPAR in Safra is currently N/A. Because RevPAR combines nightly rates with realized occupancy, it is one of the cleanest ways to compare how efficiently listings turn demand into revenue across the market.
- Entry-level properties (Bottom 25%) see N/A RevPAR.
- Typical properties (Median) generate N/A RevPAR.
- Strong performers (Top 25%) earn N/A RevPAR.
- Best-in-class (Top 10%) achieve N/A RevPAR.
Average Monthly RevPAR Trend in Safra
RevPAR Insights for Safra
- RevPAR peaks in Jan and bottoms out in Jan, mirroring the broader seasonal demand pattern and suggesting opportunities for dynamic pricing.
Recommendations for Hosts
- Track your own RevPAR monthly against these Safra benchmarks. If your RevPAR falls below the median of N/A, examine whether low occupancy or low ADR is the primary drag.
- Use RevPAR rather than revenue alone when comparing properties of different sizes — it normalizes for available nights and gives a more accurate picture of performance.
Get Live Safra Market Intelligence 👇
Explore Real-time Analytics
When Is the Peak Season for Airbnb in Safra?
Safra's peak Airbnb season falls in July, August, October, while the softest stretch is January, February, March. Overall, the market shows highly seasonal trends requiring careful strategy, which should guide pricing, minimum stays, and cash-flow planning.
Peak Season (July, August, October)
- Revenue averages $888 per month
- Occupancy rates average 36.3%
- Daily rates average $85
Shoulder Season
- Revenue averages $495 per month
- Occupancy maintains around 17.5%
- Daily rates hold near $95
Low Season (January, February, March)
- Revenue drops to average $241 per month
- Occupancy decreases to average 7.9%
- Daily rates adjust to average $116
Seasonality Insights for Safra
- Airbnb seasonality in Safra is pronounced. Revenue swings sharply between peak and low months, which means pricing strategy, minimum-stay settings, and cash reserves all need to account for extended slower periods.
- During the high season, the absolute peak month showcases Safra's highest earning potential, with monthly revenues climbing to $1,101, occupancy reaching 43.4%, and ADRs peaking at $119.
- Conversely, the slowest single month marks the market's lowest point — revenue may dip to $137, occupancy could drop to 4.9%, and ADRs may adjust to $82.
- Lower occupancy paired with meaningful seasonality means hosts in Safra need to maximize every peak-season booking and seriously consider whether off-season pricing adjustments or minimum-stay changes can capture incremental revenue.
Seasonal Strategies for Maximizing Profit
- Peak Season: Maximize revenue through premium pricing. In a high-regulation market like Safra, ensure your permit covers the number of nights you plan to book — some jurisdictions cap annual rental days.
- Low Season: Offer competitive pricing, extended-stay discounts, and flexible cancellation policies. Target off-season travelers like remote workers, budget-conscious guests, and travelers with flexible schedules.
- Shoulder Seasons: Implement dynamic pricing that bridges peak and low rates. Target weekend travelers, local events, and business visitors. Slightly more flexible terms than peak season can help maintain occupancy without deep discounting.
- In a highly seasonal market like Safra, building a cash reserve during the top months is essential for covering fixed costs during the slow period. Automated pricing tools can help capture demand shifts in real time.
Do You Need a License for Airbnb in Safra?
Safra, Keserwan-Jbeil Governorate, Lebanon has a high regulation classification, yet only 45% of listings show registration evidence. That gap between regulation on the books and compliance on the ground can shift quickly — municipalities often tighten enforcement in waves, putting unregistered operators at risk of fines or delisting. Always verify the latest short-term rental regulations and Airbnb license requirements directly with local government authorities for Safra to ensure full compliance before hosting.
(Source: AirROI data, 2026, based on 45% licensed listings)
What Are the Best Neighborhoods for Airbnb in Safra?
With a compact short-term rental market, Safra gives early-mover hosts an advantage in the right neighborhoods. The areas listed below are where guest demand and local attractions converge — a useful lens for investors evaluating whether to enter this market and where to position their listing.
| Neighborhood / Area | Why Host Here? (Target Guests & Appeal) | Key Attractions & Landmarks |
|---|---|---|
| Jbeil (Byblos) | Historical coastal city with UNESCO World Heritage sites, Jbeil is a favorite among tourists seeking history, culture, and beautiful beaches. | Byblos Castle, Old Souk of Byblos, Roman Theater, St. John-Marc Cathedral, Byblos Beaches |
| Faraya | Popular ski resort area in winter and a hiking destination in summer, attracting tourists year-round for adventure and nature activities. | Mzaar Kfardebian Ski Resort, Faraya Village, Hiking trails, Lebanon’s highest peak, Restaurant and cafes with views |
| Chekha | A serene mountain village known for its stunning views and tranquility, appealing to those looking for a peaceful retreat. | Nature walks, Local vineyards, Lebanese cuisine restaurants |
| Kfardebian | Known for its ski resorts and summer tourism, Kfardebian attracts outdoor enthusiasts and tourists looking for a getaway. | Skiing at Mzaar, Hiking in the summer, Local restaurants and cafes, Beautiful mountain scenery |
| Saidon | A historic area with archaeological sites and beautiful coastal views, popular among culture and history enthusiasts. | Sidon Sea Castle, Saint George Church, The Soap Museum, Local souks |
| Amchit | Coastal town known for its beaches and friendly atmosphere, perfect for families and beach lovers. | Amchit Beaches, Amchit Village, Local seafood restaurants |
| Aamchit | A neighbor of Amchit, this area is quiet and offers stunning landscapes and hiking options, attracting nature lovers. | Scenic viewpoints, Hiking trails, Quiet beaches |
| Zahle | Rich in gastronomy and wine production, Zahle is known for its natural beauty and is a favorite among foodies and wine enthusiasts. | The Beqaa Valley, Local wineries, Rive Gauche restaurants, Historical churches |
Because Safra has a high regulation profile, confirming that short-term rental permits are available in your target neighborhood is a critical first step before committing to a property purchase. Regulation can vary at the neighborhood or district level even within the same city.
What Types of Properties Are on Airbnb in Safra?
Room Type Distribution
Property Type Distribution
Market Composition Insights for Safra
- The Safra Airbnb market composition is heavily skewed towards Entire Home/Apt listings, which make up 90% of the 20 active rentals. This indicates strong guest preference for privacy and space.
- Looking at the property type distribution in Safra, Apartment/Condo properties are the most common (85%), reflecting the local real estate landscape.
- The presence of 10% Hotel/Boutique listings indicates integration with traditional hospitality.
Safra Airbnb Room Capacity Analysis (2026): Bedroom Distribution
Distribution of Listings by Number of Bedrooms
Room Capacity Insights for Safra
- The dominant room capacity in Safra is 1 bedroom listings, making up 45% of the market. This suggests a strong demand for properties suitable for couples or solo travelers.
- Together, 1 bedroom and 2 bedrooms properties represent 80.0% of the active Airbnb listings in Safra, indicating a high concentration in these sizes.
Safra Vacation Rental Guest Capacity Trends (2026)
Distribution of Listings by Guest Capacity
Guest Capacity Insights for Safra
- The most common guest capacity trend in Safra vacation rentals is listings accommodating 4 guests (30%). This suggests the primary traveler segment is likely small families or groups.
- Properties designed for 4 guests and 8+ guests dominate the Safra STR market, accounting for 50.0% of listings.
- 30.0% of properties accommodate 6+ guests, serving the market segment for larger families or group travel in Safra.
- On average, properties in Safra are equipped to host 4.5 guests.
What Amenities Do Airbnb Guests Expect in Safra?
Amenity Prevalence
Amenity Insights for Safra
- Essential amenities in Safra that guests expect include: TV, Air conditioning, Wifi, Hot water, Free parking on premises, Essentials. Lacking these (any) could significantly impact bookings.
- Popular amenities like Kitchen, Heating, Washer are common but not universal. Offering these can provide a competitive edge.
Recommendations for Hosts
- Ensure your listing includes all essential amenities for Safra: TV, Air conditioning, Wifi, Hot water, Free parking on premises, Essentials.
- Prioritize adding missing essentials: Hot water, Free parking on premises, Essentials.
- Consider adding popular differentiators like Kitchen or Heating to increase appeal.
- Highlight unique or less common amenities you offer (e.g., hot tub, dedicated workspace, EV charger) in your listing description and photos.
- Regularly check competitor amenities in Safra to stay competitive.
Dive Deeper: Advanced Safra STR Market Data (2026)
Ready to unlock more insights? AirROI provides access to advanced metrics and comprehensive Airbnb data for Safra. Explore detailed analytics beyond this report to refine your investment strategy, optimize pricing, and maximize your vacation rental profits.
Explore Advanced MetricsSafra Airbnb Guest Demographics & Profile Analysis (2026)
Guest Profile Summary for Safra
- The typical guest profile for Airbnb in Safra consists of a mix of domestic (40%) and international guests, with top international origins including United States, typically belonging to the Post-2000s (Gen Z/Alpha) group (50%), primarily speaking English or Arabic.
- Domestic travelers account for 40.0% of guests.
- Key international markets include Lebanon (40%) and United States (13.3%).
- Top languages spoken are English (36.4%) followed by Arabic (30.9%).
- A significant demographic segment is the Post-2000s (Gen Z/Alpha) group, representing 50% of guests.
Recommendations for Hosts
- Balance marketing efforts between domestic and international channels based on the guest mix.
- Tailor amenities and listing descriptions to appeal to the dominant Post-2000s (Gen Z/Alpha) demographic (e.g., highlight fast WiFi, smart home features, local guides).
- Highlight unique local experiences or amenities relevant to the primary guest profile.
- Consider seasonal promotions aligned with peak travel times for key origin markets.
Safra Airbnb Booking Patterns (2026): Available vs. Booked Days
Available Days Distribution
Booked Days Distribution
Booking Pattern Insights for Safra
- The most common availability pattern in Safra falls within the 271-366 days range, representing 95% of listings. This suggests many properties have significant open periods on their calendars.
- Approximately 100.0% of listings show high availability (181+ days open annually), indicating potential for increased bookings or specific owner usage patterns.
- For booked days, the 1-30 days range is most frequent in Safra (75%), reflecting common guest stay durations or potential owner blocking patterns.
How Far in Advance Do Guests Book Airbnb in Safra?
Average Booking Lead Time by Month
Booking Lead Time Insights for Safra
- The overall average booking lead time for vacation rentals in Safra is 14 days.
- Guests book furthest in advance for stays during August (average 28 days), likely coinciding with peak travel demand or local events.
- The shortest booking windows occur for stays in February (average 2 days), indicating more last-minute travel plans during this time.
- Seasonally, Summer (20 days avg.) sees the longest lead times, while Fall (9 days avg.) has the shortest, reflecting typical travel planning cycles.
Recommendations for Hosts
- Use the overall average lead time (14 days) as a baseline for your pricing and availability strategy in Safra.
- For August stays, consider implementing length-of-stay discounts or slightly higher rates for bookings made less than 28 days out to capitalize on advance planning.
- During February, focus on last-minute booking availability and promotions, as guests book with very short notice (2 days avg.).
- Target marketing efforts for the Summer season well in advance (at least 20 days) to capture early planners.
- Monitor your own booking lead times against these Safra averages to identify opportunities for dynamic pricing adjustments.
Safra Airbnb Minimum Stay Requirements Analysis
Distribution of Listings by Minimum Night Requirement
1 Night
14 listings
70% of total
2 Nights
3 listings
15% of total
3 Nights
1 listings
5% of total
4-6 Nights
1 listings
5% of total
7-29 Nights
1 listings
5% of total
Key Insights
- The most prevalent minimum stay requirement in Safra is 1 Night, adopted by 70% of listings. This highlights the market's preference for shorter, flexible bookings.
- A strong majority (85.0%) of the Safra Airbnb data shows acceptance of very short stays (1-2 nights), indicating a dynamic, high-turnover market.
Recommendations
- Align with the market by considering a 1 Night minimum stay, as 70% of Safra hosts use this setting.
- Adjust minimum nights based on seasonality – potentially shorter during low season and longer during peak demand periods in Safra.
Safra Airbnb Cancellation Policy Trends Analysis (2026)
Flexible
3 listings
16.7% of total
Moderate
4 listings
22.2% of total
Firm
7 listings
38.9% of total
Strict
4 listings
22.2% of total
Cancellation Policy Insights for Safra
- The prevailing Airbnb cancellation policy trend in Safra is Firm, used by 38.9% of listings.
- A majority (61.1%) of hosts in Safra utilize Firm or Strict policies, indicating a market where hosts prioritize booking security.
Recommendations for Hosts
- Consider adopting a Firm policy to align with the 38.9% market standard in Safra.
- Regularly review your cancellation policy against competitors and market demand shifts in Safra.
What Do the Top Airbnb Listings in Safra Look Like?
Benchmark your potential! Explore examples of top-performing Airbnb properties in Safrabased on Trailing Twelve Month (TTM) revenue. Analyze their characteristics, revenue, occupancy rate, and ADR to understand what drives success in this market.

2-BR Netflix Garden 24/7E Jounieh kichinet+bar
Entire Place • 2 bedrooms
Outstanding chalet with a million-dollar view
Entire Place • 2 bedrooms
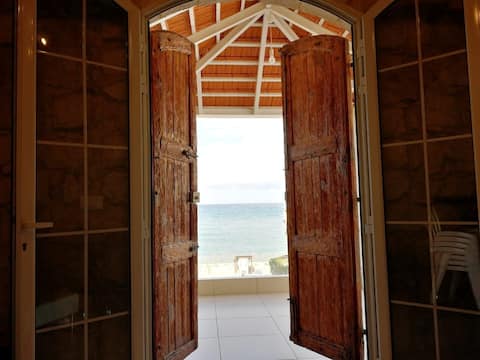
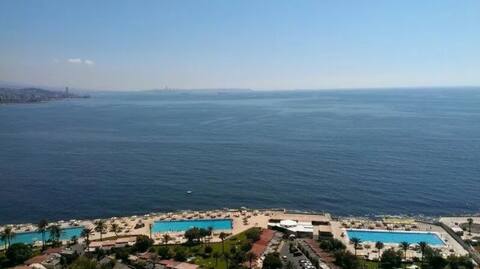
Traditional Lebanese Beach house
Entire Place • 1 bedroom

Vip Luxe
Entire Place • 3 bedrooms
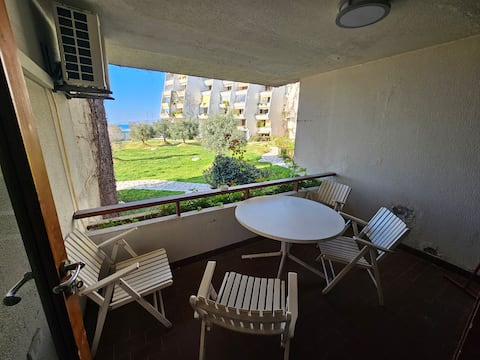
Cozy pool and beach chalet
Entire Place • 1 bedroom

Big Seaview studio, 24h electricity, beach + pool
Entire Place • 1 bedroom
Note: Performance varies based on location, size, amenities, seasonality, and management quality. Data reflects the past 12 months.
Who Are the Top Airbnb Hosts in Safra?
Learn from the best! This table showcases top-performing Airbnb hosts in Safra based on the number of properties managed and estimated total revenue over the past year. Analyze their scale and performance metrics.
| Host Name | Properties | Grossing Revenue | Stay Reviews | Avg Rating |
|---|---|---|---|---|
| Teram | 2 | $10,355 | 92 | 4.90/5.0 |
| Celine | 1 | $8,913 | 5 | 5.00/5.0 |
| Host #528740273 | 3 | $6,965 | 0 | Not Rated |
| Pierre | 7 | $6,725 | 4 | Not Rated |
| Joseph | 1 | $4,551 | 38 | 5.00/5.0 |
| Host #264559632 | 1 | $2,560 | 0 | Not Rated |
| Ralph | 1 | $2,341 | 6 | 5.00/5.0 |
| Jad | 1 | $2,089 | 3 | 5.00/5.0 |
| Host #284039661 | 1 | $994 | 0 | Not Rated |
| Elie | 1 | $703 | 6 | 5.00/5.0 |
Analyzing the strategies of top hosts, such as their property selection, pricing, and guest communication, can offer valuable lessons for optimizing your own Airbnb operations in Safra.
How Does Safra's Airbnb Market Compare to Nearby Cities?
How does the Safra Airbnb market stack up against its neighbors? Compare key performance metrics like average monthly revenue, ADR, and occupancy rates in surrounding areas to understand the broader regional STR landscape.
Compared with Dbayeh, Safra has 26 percentage points lower occupancy and about $36 lower ADR. That helps frame whether this market is winning more on demand, pricing, or both.
| Market | Active Properties | Monthly Revenue | Daily Rate | Avg. Occupancy |
|---|---|---|---|---|
| Aannaya | 11 | $2,257 | $523.45 | 20% |
| Paralimni | 1,235 | $1,532 | $227.87 | 39% |
| Maale Yosef Regional Council | 67 | $1,125 | $388.77 | 22% |
| Dbayeh | 25 | $1,110 | $146.90 | 44% |
| Mayrouba | 18 | $1,057 | $191.45 | 25% |
| Mevoot HaHermon Regional Council | 87 | $1,040 | $330.59 | 23% |
| Mar Maroun | 30 | $1,013 | $190.37 | 28% |
| Jumayza | 35 | $960 | $130.53 | 40% |
| Galil Elyon Regional Council | 93 | $791 | $294.00 | 24% |
| Sinn El Fil | 18 | $762 | $156.18 | 40% |
Frequently Asked Questions About Airbnb in Safra
These quick answers summarize the most common investor and operator questions using AirROI's latest market data for Safra.
How much do Airbnb hosts make in Safra?
Safra hosts earn about $2,325 per year on average, with an average nightly rate of $111 and RevPAR of N/A. Those figures describe the typical revenue environment for active listings in Safra, Keserwan-Jbeil Governorate, not the ceiling for the best operators. Source: AirROI 2025 data, Safra market, June 2024 to May 2025.
What is the average Airbnb occupancy rate in Safra?
The average Airbnb occupancy rate in Safra is 18.5%. July is the strongest month and March is the softest, so hosts should expect demand to move meaningfully throughout the year rather than stay flat.
What is the average Airbnb daily rate in Safra?
Listings in Safra average $111 per night. The broader pricing spread also matters: lower-performing listings cluster closer to the lower quartiles, while premium homes can price materially above the city average when demand spikes or listing quality stands out.
How many Airbnb listings are active in Safra?
Safra currently has about 20 active Airbnb listings in AirROI's market dataset. That supply count helps explain how competitive the market is, how much depth there is for benchmarking, and whether the market behaves like a niche destination or a scaled urban market.
How strict are short-term rental regulations in Safra?
AirROI currently classifies the short-term rental regulation level in Safra as High. The dataset also shows about 45.0% of listings with registration evidence. That is a market signal, not legal advice, so hosts should still confirm current licensing and compliance rules locally before listing.
What is the RevPAR for Airbnb in Safra?
RevPAR in Safra is about N/A. That metric combines pricing and occupancy into one efficiency number, so it is often a better quick benchmark than ADR alone when investors want to compare how well listings convert nightly rates into realized revenue.
Is Airbnb profitable in Safra?
Occupancy of 18.5% means Safra is a more selective market. Profitability is achievable but requires careful cost management, premium positioning, or targeting longer stays to reduce turnover. Average annual revenue is $2,325, but individual returns depend on property type, location within the city, and the host's operating efficiency.
How far in advance do guests book Airbnb in Safra?
The average booking lead time in Safra is about 14 days — a relatively short booking window, meaning most guests decide within a few weeks of their trip — dynamic pricing can capture late demand. Hosts who understand their market's booking cadence can adjust minimum stays and pricing windows accordingly.
What are the best neighborhoods for Airbnb in Safra?
Based on AirROI's analysis, some of the top neighborhoods for short-term rentals in Safra include Jbeil (Byblos), Faraya, Chekha. Each area attracts different guest profiles — from business travelers to leisure visitors — so the best location depends on the property type and target audience a host is aiming for. See the full neighborhood breakdown above.
What type of property performs best on Airbnb in Safra?
entire_home listings make up 90.0% of the active supply in Safra. The most common configuration does not always mean the most profitable — operators who identify underserved property types or bedroom counts can sometimes outperform the market average by filling a gap in local supply.
How does Safra compare to nearby Airbnb markets?
Among neighboring markets, Aannaya posts $27,085 in average annual revenue with 19.5% occupancy, compared to Safra's $2,325 and 18.5%. Comparing nearby markets helps investors understand whether a destination's performance reflects local demand or broader regional trends.
When is the peak season for Airbnb in Safra?
July is the highest-revenue month in Safra, while March is the softest. The revenue spread between them indicates a highly seasonal market — revenue in the peak month is more than double the low month, so cash-flow planning and pricing automation are critical.
About AirROI Market Data
AirROI tracks over 20 million properties across 190+ countries and maintains 15+ years of historical performance data, making it one of the deepest Airbnb and STR intelligence platforms available. The analytics pipeline aggregates listing-level data monthly — revenue, occupancy, nightly rates, RevPAR, guest demographics, booking patterns, and competitive supply — so investors and operators can benchmark any market against its own history and against neighboring destinations.
Real estate investors, property managers, financial institutions, hedge funds, tourism boards, hospitality consultants, tech platforms, and academic researchers rely on AirROI data to underwrite acquisitions, optimize pricing, model macro trends, and conduct peer-reviewed research. Data is available through in-depth market reports like this one and the Airbnb API with 22 endpoints and an Airbnb MCP Server for AI agents.
AirROI proprietary analytics as of 2025-05-31. Metrics reflect trailing twelve-month aggregates from active listings. Revenue figures are market averages, not projections. Neighborhood descriptions are AI-generated and reviewed for accuracy. For full methodology, see the data methodology page.