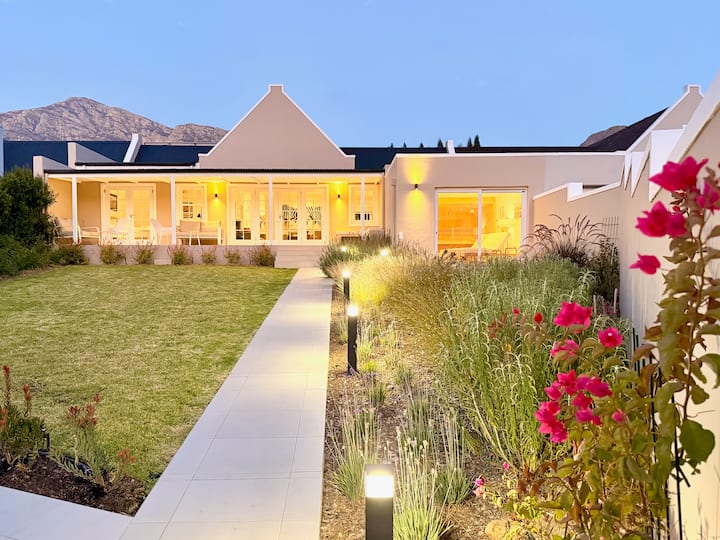
 winelands living - house with sauna and pool Entire home · 3 bedrooms Rated 4.98
 - Revenue
- R 1.6M
- Occupancy
- 68.5%
- Daily rate
- R 8,666
Airbnb market data · 202612 months to September 2026
The average Airbnb in Franschhoek brought in R 473,021 over the 12 months through September 2026, about 69% more than the Western Cape average of R 279,702.
The short answer
Both rates and bookings run ahead of the Western Cape average. Listings averaged R 5,291 a night and were booked on 47% of available nights, against R 2,920 and 39% for the Western Cape average.
Timing matters: in January, the best month, the average listing earned about 4.6 times as much as in September, the slowest.
With 72 active listings, Franschhoek is the 38th-largest of 65 Western Cape markets AirROI tracks.
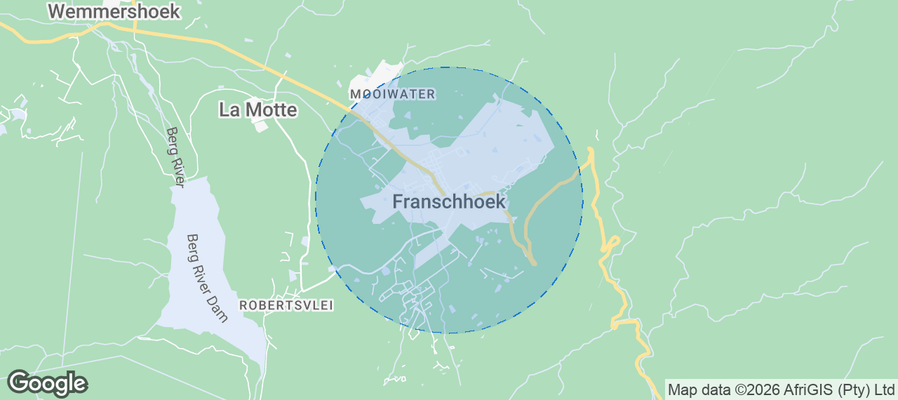 Browse the live Franschhoek Airbnb market See Every Franschhoek Listing
Revenue
Gross bookings per Franschhoek listing averaged R 473,021 over the 12 months to September 2026 (Western Cape average: R 279,702), before cleaning, platform and management costs and taxes.
The average Franschhoek listing brought in R 110,000 in January, its best month, and R 23,900 in September, its slowest. The three strongest months bring in 37% of a full year's revenue, where an even calendar would give any three months 25%.
In a typical month, a top-quarter listing earns at least 3.4 times as much as a bottom-quarter one.
These are monthly figures for listings active in each month. The annual average above also counts listings that operated for only part of the year, so it runs below twelve times these figures.
January earned about 4.6 times what September did
Average revenue per active listing, by month, September 2025 to August 2026
The dashed line is the average of the months shown, R 62,900.
Latest 12 months in the September 2026 data. September's figures are still coming in, so the rows run to August.
January 2026 led on revenue. Nightly rates peaked in May 2026 and bookings in November 2025, so the best-paying month is not always the busiest or the priciest.
| Month | Avg. Revenue | Occupancy | Avg. Nightly Rate | RevPAR | Booking Lead Time | Avg. Length of Stay |
|---|---|---|---|---|---|---|
| Sep 2025 | R 23,905 | 52.2% | R 5,021 | R 797 | 26 days | 2.7 nights |
| Oct 2025 | R 67,647 | 68.1% | R 5,056 | R 2,182 | 46 days | 6.9 nights |
| Nov 2025 | R 79,925 | 76.7% | R 5,088 | R 2,664 | 94 days | 6.9 nights |
| Dec 2025 | R 84,982 | 53.7% | R 5,195 | R 2,741 | 31 days | 5.7 nights |
| Jan 2026 | R 109,967 | 69.4% | R 5,141 | R 3,547 | 42 days | 7.2 nights |
| Feb 2026 | R 85,525 | 69.5% | R 5,040 | R 3,054 | 49 days | 4.7 nights |
| Mar 2026 | R 85,427 | 64.2% | R 5,041 | R 2,756 | 55 days | 3.3 nights |
| Apr 2026 | R 51,243 | 40.1% | R 5,041 | R 1,708 | 48 days | 2.5 nights |
| May 2026 | R 33,910 | 27.7% | R 5,590 | R 1,094 | 57 days | 2.4 nights |
| Jun 2026 | R 40,843 | 31.6% | R 5,221 | R 1,361 | 27 days | 3.9 nights |
| Jul 2026 | R 50,854 | 33.6% | R 5,257 | R 1,640 | 46 days | 4.2 nights |
| Aug 2026 | R 40,955 | 31.1% | R 5,305 | R 1,321 | 45 days | 2.5 nights |
Averages per active listing in each month. Highlighted: the highest-revenue month of the 12. RevPAR is the month's revenue spread over its nights, booked or not. Booking lead time is the days between booking and check-in, and length of stay the nights per booking, for stays in that month.
The typical Franschhoek listing earns about R 50,200 a month, but one property can land well above or below that. The Airbnb calculator gives a range for a specific address, built from the comparable listings around it.
Profit
Yes, when it's run well. The average Franschhoek Airbnb took in R 473,021 in the 12 months to September 2026, and run by its owner at everyday costs, about R 27,900 a month of that is left after running costs, so a home that costs less than that to own or rent makes money. A listing in the top quarter leaves about R 48,900 a month.
Cleaning it yourself keeps the R 16,600 a year guests pay in cleaning fees, for about R 29,200 a month. Handing the listing to a co-host at about 10% of nightly bookings still leaves about R 24,100 a month.
These amounts come before housing costs. Where the mortgage or rent is less each month, the difference is profit; a home owned outright keeps it all after property tax, home insurance and any building or condo fees.
| Line | Average listing | Top-quarter listing |
|---|---|---|
| Money in | ||
| Nightly bookings | R 456,421 | R 793,400 |
| Cleaning fees guests pay4% of Franschhoek bookings | R 16,600 | R 28,800 |
| Gross bookings | R 473,021 | R 822,200 |
| Running costs | ||
| Airbnb's feeAbout 14%: 15.5% for the 90% of Franschhoek listings on Simplified Pricing, 3% for the rest | −R 67,600 | −R 117,400 |
| Cleaning and laundryPaid for by the cleaning fee; R 0 if you clean yourself | −R 16,600 | −R 28,800 |
| Utilities and internetAbout 5% of bookings | −R 23,700 | −R 41,100 |
| Guest suppliesToiletries, coffee, paper goods: about 2% | −R 9,500 | −R 16,400 |
| Repairs and upkeepIncluding linens and small replacements: about 3% | −R 14,200 | −R 24,700 |
| Short-term rental insuranceOne policy, on top of Airbnb's free AirCover | −R 4,700 | −R 4,700 |
| Permit and registrationWhere one is required | −R 2,400 | −R 2,400 |
| ManagementR 0 when you run it; co-hosts charge from about 10% of nightly bookings | R 0 | R 0 |
| Pricing and messaging toolsOptional; Airbnb's own tools are free | R 0 | R 0 |
| Lodging taxesAdded to the guest's bill and passed on | R 0 | R 0 |
| Total running costsAbout 26% of bookings, plus cleaning paid for by the cleaning fee | −R 138,700 | −R 235,500 |
| Left for housing costs, then profit | R 334,321about R 27,900 a month | R 586,700about R 48,900 a month |
| Housing costs | ||
| Mortgage or rent, property tax, home insurance, building or condo fees | Depend on the home | |
The estimate starts from Franschhoek's average listing, run by its owner. Change how the listing performs, who runs it and who cleans to see what is left for the mortgage or rent.
To work out the profit on one Franschhoek home, with its price, its mortgage or rent and your own costs, use the Airbnb profit calculator. It starts from the comparable listings around the address.
What a listing keeps comes down to the figures this page measures: nightly rate, nights booked and the months it's open. A listing at the top-quarter mark takes in about R 68,500 a month, against R 39,400 for the average one.
Occupancy
Franschhoek listings were booked on 47% of the nights they were open over the past year, 8 percentage points above the Western Cape average (39%) and 12 points above the South Africa average (35%). Occupancy swings from 28% in May to 77% in November.
The busiest tenth of listings are booked about 2.7 times as often as the bottom quarter.
November was the busiest month in Franschhoek, May the quietest
Share of open nights booked, by month, September 2025 to August 2026
The 12-month rate of 47% averages each listing's whole year, slow months included; each month here counts only the listings booked in it.
Nightly rates
The average nightly rate in Franschhoek, known as ADR (average daily rate), was R 5,291 over the past year, about 81% above the Western Cape average of R 2,920 and about 2.2 times the South Africa average of R 2,425. Rates peak in May at about R 5,590 and bottom out in February and September at about R 5,020.
Prices span a wide range: the top 10% charge about four times the rate of the bottom quarter.
May rates ran 11% above September's
Average nightly rate (ADR), by month, September 2025 to August 2026
The dashed line is the average of the months shown, R 5,170.
RevPAR, or revenue per available night, divides a listing's income by every night it was open to book, so it rises with both price and bookings. In Franschhoek it averaged R 2,410 over the past year, from about R 797 in September to about R 3,550 in January.
Per open night, by tier:
January RevPAR was about 4.5 times September's
Revenue per open night (RevPAR), by month, September 2025 to August 2026
The dashed line is the average of the months shown, R 2,070. The 12-month RevPAR of R 2,410 averages each listing's whole year, slow months included; each month here counts only the listings booked in it.
Seasonality
Franschhoek has one high season, November through March, which makes it a highly seasonal market. Business is slowest from April to September. A listing earns about 2.1 times as much a month in December through February as in June through August.
| Season | Revenue per month | Occupancy | Nightly rate |
|---|---|---|---|
| High seasonNovember–March | R 89,200 | 67% | R 5,101 |
| Shoulder seasonOctober | R 67,600 | 68% | R 5,056 |
| Low seasonApril–September | R 40,300 | 36% | R 5,239 |
Seasons are grouped by revenue per listing, so a better-paying season can fill fewer nights when higher rates carry it.
Guests book Franschhoek stays 43 days ahead on average (about six weeks). November stays are booked furthest out, about 94 days ahead, and September stays closest to arrival, about 26 days. A typical November booking is made in mid-August.
November stays are booked furthest ahead
Average days between booking and check-in, by month of stay, September 2025 to August 2026
The 12-month figure of 43 days averages each listing's year as a whole; each month here averages only the listings with stays in it.
Permits
None of the 72 active listings in Franschhoek display a registration, permit or license number. That doesn't mean no rules apply: some places don't ask hosts to show a number on the listing, and listing data doesn't capture every scheme.
Registration, permit, zoning and tourist-tax rules vary by address and change often, so confirm them with the local authority before buying or listing in Franschhoek.
Neighborhoods
AirROI's area guide picks eight Franschhoek neighborhoods that draw short-term rental guests, led by Main Road, Wine Estates and Village Center. The picks reflect guest appeal, not earnings data or permit eligibility, so check local permit rules for a specific address before buying.
| Area | Who it suits | Landmarks nearby |
|---|---|---|
| Main Road | The heart of Franschhoek, lined with gourmet restaurants, boutiques, and art galleries. Ideal for tourists who want to experience the culinary delights of the region and enjoy easy access to attractions. | Franschhoek Wine Tram, Huguenot Memorial Museum, Franschhoek Market, Domain Chandon, Rickety Bridge Wine Estate |
| Wine Estates | Franschhoek is known for its beautiful wine estates that offer stunning views and luxurious accommodations. A great choice for vacationers seeking a scenic and relaxing getaway. | La Motte Wine Estate, Vineyards, Boschendal Wine Estate, Château Mon驡, L'Omarins |
| Village Center | Offers a charming small-town atmosphere with picturesque streets and local shops. Great for families and couples looking for an intimate setting with close proximity to attractions. | Franschhoek Village, Heritage Square, Art Gallery, The Chocolate Shop, Local Cafes |
| Pine Forest | A serene area surrounded by nature, perfect for those seeking peace and quiet away from the hustle and bustle. Ideal for nature lovers and outdoor enthusiasts. | Hiking Trails, Biking Paths, Scenic Overlooks, Spas, Nature Reserves |
| Huguenot Heights | A residential area with incredible views of the mountains and vineyards. Suited for travelers who want a more secluded yet luxurious experience. | Hiking Trails, Scenic Overlooks, Nearby Wine Estates, Gourmet Restaurants |
| Gourmet Capital | Franschhoek is known as the gastronomic capital of South Africa, making it a hotspot for foodies and wine lovers. It hosts numerous culinary festivals and events throughout the year. | Gourmandé Dine, Food and Wine Festivals, Cooking Classes, Local Cheese Shops, Gastronomy Tours |
| Art and Culture Hub | Franschhoek has a vibrant arts scene with many galleries and cultural events. Great for tourists interested in the arts, enjoying galleries, and live performances. | Franschhoek Art House, Local Craft Market, Theatre Performances, Art Walks |
| Luxury Retreats | Franschhoek offers luxury accommodations from boutique hotels to exclusive guesthouses, making it attractive for high-end travelers looking for comfort and style amidst natur. | Luxury Spa Resorts, Gourmet Dining Experiences, Exclusive Wine Tastings, Private Tours |
Area descriptions are AI-assisted from public sources and are not checked against zoning.
Listings
Entire homes make up 78% of listings in Franschhoek, alongside 16 private-room listings (22%). Houses are the most common property type at 54%, about 2.8 times the share of apartments and condos (19%).
Mostly entire homes, with a private-room segment
Franschhoek Airbnb listings by room type
| Room type | Share of listings | Listings |
|---|---|---|
| Entire home | 77.8% | 56 |
| Private room | 22.2% | 16 |
Listings by property type
Franschhoek Airbnb listings by property type
| Property type | Share of listings | Listings |
|---|---|---|
| House | 54.2% | 39 |
| Apartment/Condo | 19.4% | 14 |
| Hotel/Boutique | 16.7% | 12 |
| Cabin/Outdoor | 8.3% | 6 |
| Others | 1.4% | 1 |
Two-bedroom homes are the most common size in Franschhoek (36% of entire homes), and 36% have three or more bedrooms. Shares are of the 55 entire homes that give a bedroom count; rented rooms are left out.
Franschhoek entire homes by number of bedrooms
Entire homes with each number of bedrooms, of those with a bedroom count on file
| Bedrooms | Share of entire homes with a bedroom count | Entire homes |
|---|---|---|
| 1 bedroom | 27.3% | 15 |
| 2 bedrooms | 36.4% | 20 |
| 3 bedrooms | 18.2% | 10 |
| 4 bedrooms | 14.5% | 8 |
| 5+ bedrooms | 3.6% | 2 |
A typical one-bedroom home in Franschhoek earned R 280,000 over the past year, against R 828,000 for a three-bedroom home.
| Home size | Listings | Typical annual revenue (median) | Average annual revenue | Avg. nightly rate | Occupancy |
|---|---|---|---|---|---|
| 1 bedroom | 15 | R 280,000 | R 309,000 | R 2,788 | 50% |
| 2 bedrooms | 20 | R 406,000 | R 456,000 | R 4,914 | 46% |
| 3 bedrooms | 10 | R 828,000 | R 868,000 | R 9,477 | 55% |
Most Franschhoek listings are sized for couples and small families: 68% sleep four guests or fewer, and just 16% take eight or more. Shares are of the 63 listings with a guest capacity on file (88% of the market).
Franschhoek listings by guest capacity
Share of listings by the number of guests they sleep, of those with a capacity on file
| Guest capacity | Share of listings with a capacity on file | Listings |
|---|---|---|
| 2 guests | 34.9% | 22 |
| 4 guests | 33.3% | 21 |
| 5 guests | 1.6% | 1 |
| 6 guests | 14.3% | 9 |
| 8+ guests | 15.9% | 10 |
Franschhoek hosts set up an average of 2.2 beds per listing, close to one bed per bedroom. About four in ten listings (39%) show their exact location on the listing map; the rest show an approximate area.
Pools are common in Franschhoek: 61% of listings have one, and 43% have a fireplace.
Share of Franschhoek listings with each common amenity
Guests
Franschhoek runs on foreign visitors: 72% of guests who left reviews live outside South Africa. The United Kingdom sends the most guests from abroad, with 25% of reviewers, ahead of Germany at 12%. Guests speak a mix of languages: English leads at 54%, followed by German and French.
72% of Franschhoek guests come from abroad
Where guests who left reviews live
Where Franschhoek guests come from: top cities
Share of guests who left reviews
| Origin city | Share of guests |
|---|---|
| Cape Town | 13.4% |
| London | 8.3% |
| Johannesburg | 2.4% |
| Pretoria | 2.4% |
Where Franschhoek guests come from: top countries
Share of guests who left reviews
| Origin country | Share of guests |
|---|---|
| South Africa | 27.8% |
| United Kingdom | 25.1% |
| Germany | 12.2% |
| United States | 7.2% |
| Netherlands | 6.2% |
Languages spoken by Franschhoek guests
Share of guests who left reviews
| Language | Share of guests |
|---|---|
| English | 53.6% |
| German | 13.1% |
| French | 8.9% |
| Afrikaans | 6.0% |
| Spanish | 4.9% |
Franschhoek Airbnbs average 4.86 stars, and 47% of listings hold Airbnb's Guest Favorite badge. Guests are toughest on value for money: it scores 4.76, against 4.93 for cleanliness.
Cleanliness scores highest in Franschhoek; value is lowest
Average guest rating out of 5 by category; the bars start at 4.0
| Category | Average rating (out of 5) |
|---|---|
| Accuracy | 4.88 |
| Cleanliness | 4.93 |
| Communication | 4.85 |
| Location | 4.92 |
| Check-in | 4.88 |
| Value | 4.76 |
Booking patterns
About nine in ten Franschhoek listings are open to guests more than 180 days a year, but only 10% are booked or blocked that many days. The most common booked-or-blocked total is 91 to 180 days a year, covering 47% of listings; blocked nights include any the host closes off.
Days a year Franschhoek listings are open to guests
Share of listings by days a year
| Days a year | Share of listings | Listings |
|---|---|---|
| 271-366 days | 45.8% | 33 |
| 181-270 days | 44.4% | 32 |
| 91-180 days | 5.6% | 4 |
| 31-90 days | 4.2% | 3 |
Days a year Franschhoek listings are booked or blocked
Share of listings by days a year
| Days a year | Share of listings | Listings |
|---|---|---|
| 271-366 days | 5.6% | 4 |
| 181-270 days | 4.2% | 3 |
| 91-180 days | 47.2% | 34 |
| 31-90 days | 33.3% | 24 |
| 1-30 days | 9.7% | 7 |
The average Franschhoek booking lasts 4.4 nights, longest in January and shortest in May. Listings took about 26 bookings each over the year, some 1,860 in all. 55% of listings that give a check-in time set it at 2 p.m., with check-out usually at 10 a.m.
Average length of stay by month in Franschhoek
Average nights per booking, by month of stay
More than nine in ten listings in Franschhoek accept stays of one or two nights.
Minimum stay set by Franschhoek listings
Share of listings by the shortest stay they accept, from one night to 30 or more
Firm is the most common cancellation policy in Franschhoek, used by 47% of listings; it refunds guests in full only if they cancel at least 30 days before check-in. Hosts here lean strict: nearly half of listings use Firm or stricter terms, against 33% on Flexible or Moderate.
Cancellation policies of Franschhoek listings, from most to least flexible
Share of listings by the policy they use
About seven in ten Franschhoek listings charge a cleaning fee. The typical fee is about R 530. Spread over the average stay of 4.4 nights, that adds roughly R 120 a night to what guests pay. For listings that charge one, cleaning fees make up about 4% of gross revenue.
Top earners
The top-grossing Airbnb in Franschhoek, a three-bedroom home, took in R 1,590,000 over the past year, about 3.4 times the city's average of R 473,000.
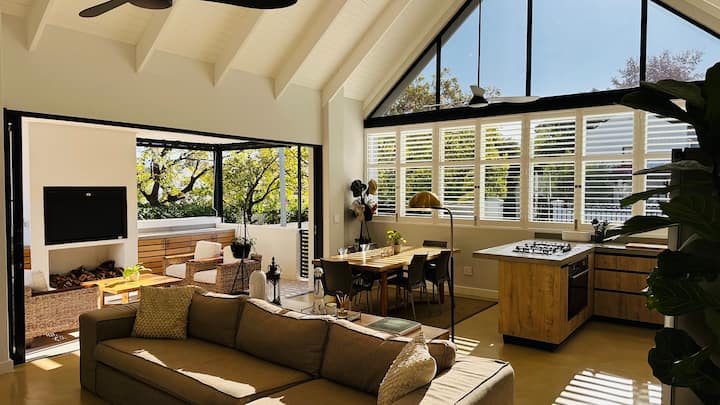
winelands living - house with sauna and pool Entire home · 3 bedrooms Rated 4.98 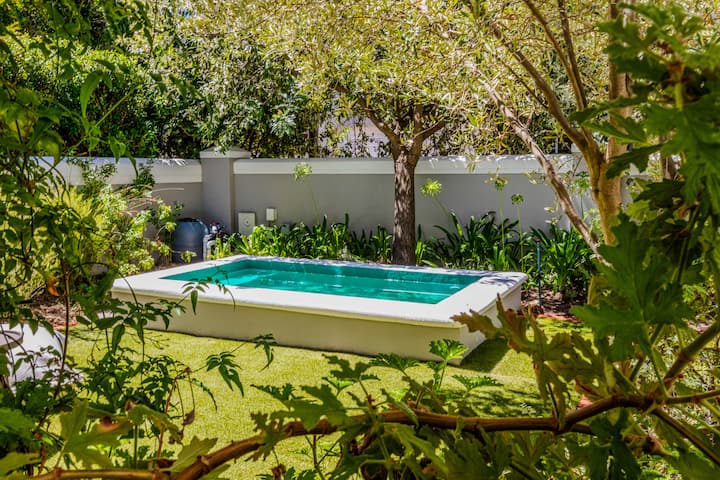 Lush Garden (incl. breakfast & service) Entire home · 3 bedrooms Rated 5.00
 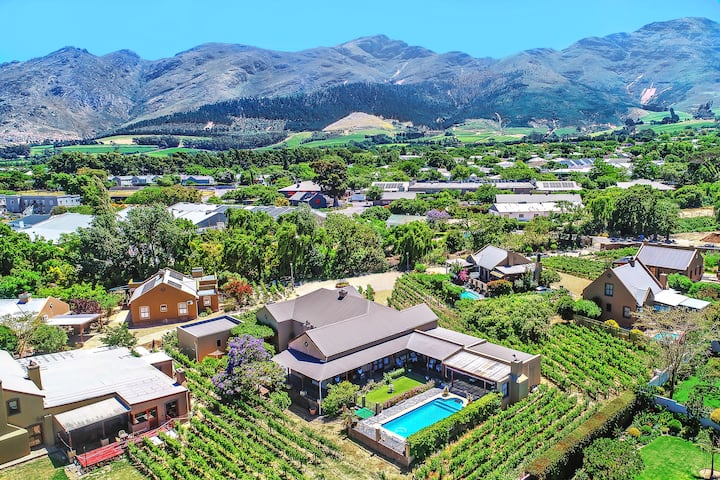 The Manor House @ Roubaix Estate Entire home · 5 bedrooms Rated 4.86
  Franschhoek Chic | Comfort 2-Bedroom Stay Entire home · 2 bedrooms Rated 4.85
 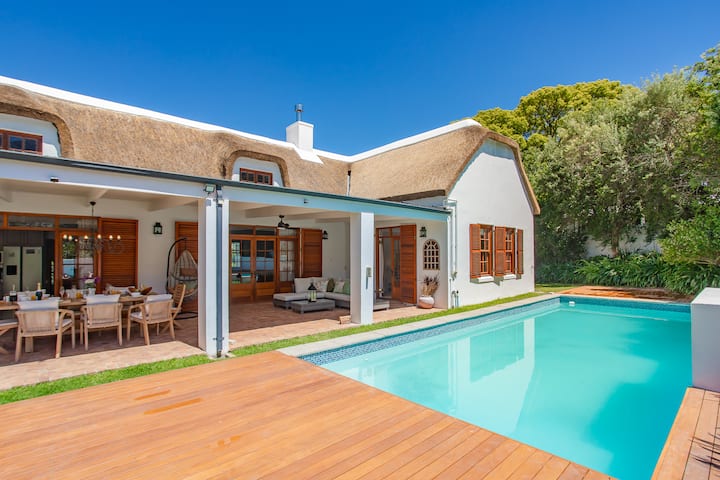 Thatch & Vine House Entire home · 4 bedrooms Rated 4.93
 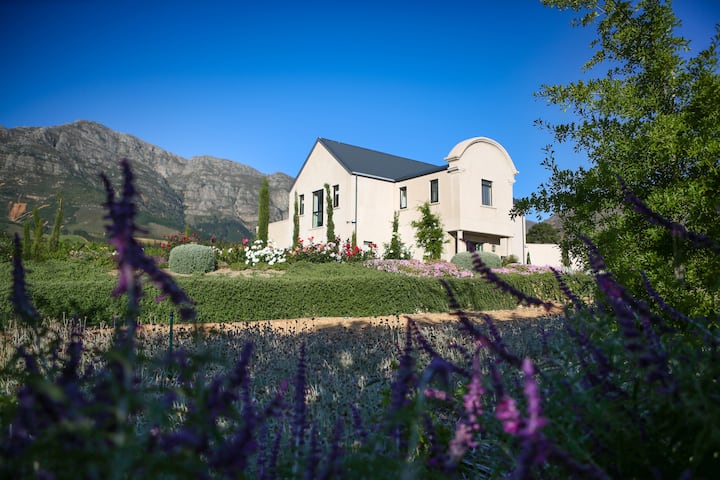 Mountain View Manor Entire home · 4 bedrooms
 Professional management companies run 17% of Franschhoek listings and owners run the rest, though 33% of listings have a co-host. Superhosts run 53% of listings. Airbnb's Simplified Pricing, where the host pays the whole service fee and guests see one price with no separate Airbnb charge, covers 90% of listings.
Nearby markets
Franschhoek out-earns every one of the eight nearby markets in the table, all within 37 km; the best of them, Stellenbosch Local Municipality, averaged about 16% less per listing.
| Market | Listings | Avg. annual revenue | Avg. nightly rate | Occupancy |
|---|---|---|---|---|
| Cape Winelands District Municipality 17 km | 78 | R 190,101 | R 2,882 | 29% |
| Stellenbosch Local Municipality 17 km | 1,225 | R 396,781 | R 3,517 | 44% |
| Paarl 24 km | 76 | R 114,892 | R 1,879 | 32% |
| Stellenbosch 25 km | 248 | R 266,618 | R 3,038 | 46% |
| Drakenstein Local Municipality 25 km | 413 | R 231,341 | R 2,737 | 33% |
| Somerset West 31 km | 395 | R 203,152 | R 2,236 | 39% |
| Strand 35 km | 275 | R 160,074 | R 1,742 | 36% |
| Theewaterskloof Local Municipality 37 km | 270 | R 203,119 | R 2,084 | 30% |
FAQ
An active Franschhoek Airbnb grossed R 473,021 on average in the 12 months to September 2026, according to AirROI's tracking of 72 active listings. That is before cleaning, management, taxes and financing. Busier, better-run listings do far better: the top quarter took in R 87,200 or more in a typical month.
It depends most on the home's size, location and how it's run. The middle half of Franschhoek listings earn between R 25,100 and R 87,200 in a typical month, and the top tenth R 130,000 or more. For one home, enter its address and bedroom count in the Airbnb income calculator: it compares the home with similar listings nearby.
Listings in Franschhoek were booked on 47% of available nights over the past year. That compares with 39% for the Western Cape average. November was the busiest month.
The average booked night in Franschhoek cost R 5,291 before fees. Half of listings charge between R 2,395 and R 5,225; a few high-priced homes pull the average above that range.
None of the active Franschhoek listings display a registration, permit or license number. That doesn't mean no rules apply, so confirm registration, permit and tourist-tax rules with the local authority before buying.
Yes, when it's run well. The average Franschhoek Airbnb grossed R 473,021 in the 12 months to September 2026, 69% above the Western Cape average of R 279,702. Run by its owner, with the cleaning fee covering the cleaner and everyday costs for Airbnb's fee, utilities, supplies, upkeep and insurance, R 334,321 a year (about R 27,900 a month) is left before the mortgage or rent. A home that costs less than that to own or rent makes a profit, and a listing at the top-quarter mark leaves about R 48,900 a month. Check a specific home in the Airbnb estimator.
January paid best over the past year, at R 110,000 per active listing, and September paid least. The month-by-month table above shows how rates and bookings each move.
Each night a Franschhoek listing was open to book earned R 2,410 on average over the past year, booked or not. That figure, revenue per available night (RevPAR), folds price and occupancy into one number; the top 10% of listings made R 4,330 or more.
Franschhoek stays were booked 43 days (about six weeks) before arrival on average over the past year, so most of a month is booked well before it starts.
The average Franschhoek Airbnb stay lasted 4.4 nights over the past year. A listing took 26 reservations over the year on average.
Guests rate Franschhoek Airbnbs 4.86 out of 5 on average. Guests score cleanliness highest and value lowest.
Main Road, Wine Estates and Village Center draw the most short-term rental interest in Franschhoek. The neighborhood guide explains what brings guests to each.
AirROI counted 72 active Airbnb listings in Franschhoek as of September 2026. The closest tracked market is Cape Winelands District Municipality, 17 km away.
In Franschhoek, about seven in ten listings add a cleaning fee, and the typical fee is about R 530.
Method
Figures on this page cover 72 active Airbnb listings in Franschhoek from October 2025 to September 2026 (trailing twelve months). AirROI refreshes them monthly from listing-level booking and calendar data covering 20+ million properties worldwide. AirROI measures bookings in US dollars; this page shows them in South African rand at R 16.6 per US$, the typical rate from October 2025 to September 2026. Annual revenue averages every listing active during the period, including those listed for only part of it; monthly figures average the listings active in each month; the tier lists show the spread. Neighborhood descriptions are AI-assisted. See the methodology for definitions.
Need this programmatically? The same metrics are available through the AirROI Airbnb Data API and bulk downloads in the data portal.