Icheon-si, Gyeonggi Province Airbnb Market Data 2026: STR Report & Statistics
How much can you earn on Airbnb in Icheon-si, Gyeonggi Province? Based on AirROI's 2026 dataset (July 2025 – June 2026), the short answer is $10,433 per year — at a $149 nightly rate, 32.6% occupancy, and a $38 RevPAR that reflects a wider gap between nightly rates and realized revenue that rewards occupancy-focused strategies.
With just 29 active listings, Icheon-si is a micro-market where selective demand that rewards strong listing quality and pricing strategy. The market trimmed 12.1% of its supply while nightly rates moved higher — fewer listings competing for the same travelers, and those travelers are paying more. Hosts who can unlock occupancy through standout listings, flexible policies, and targeted marketing have clear revenue upside.
Regulation is high and 72% of listings show active registration — compliance is the cost of entry. In a market this size, differentiated listings with strong reviews can capture outsized returns relative to the competition.
Table of Contents [hide] [show]
What Are the Key Airbnb Metrics in Icheon-si?
In Icheon-si, the headline Airbnb metrics are $10,433 in average annual revenue,32.6% occupancy, $149 ADR, and $38 in RevPAR, and guests book about 20 days in advance.
How Much Do Airbnb Hosts Earn Monthly in Icheon-si?
Understanding the monthly revenue variations for Airbnb listings in Icheon-si is key to maximizing your short term rental income potential. Seasonality significantly impacts earnings. Our analysis, based on data from the past 12 months, shows that the peak revenue month for STRs in Icheon-si is typically October, while June often presents the lowest earnings, highlighting opportunities for strategic pricing adjustments during shoulder and low seasons. Explore the typical Airbnb income in Icheon-si across different performance tiers:
- Best-in-class properties (Top 10%) achieve $3,475+ monthly, often utilizing dynamic pricing and superior guest experiences.
- Strong performing properties (Top 25%) earn $1,835 or more, indicating effective management and desirable locations/amenities.
- Typical properties (Median) generate around $1,023 per month, representing the average market performance.
- Entry-level properties (Bottom 25%) see earnings around $574, often with potential for optimization.
Average Monthly Airbnb Earnings Trend in Icheon-si
What Is the Monthly Airbnb Occupancy Rate in Icheon-si?
Maximize your bookings by understanding the Icheon-si STR occupancy trends. Seasonal demand shifts significantly influence how often properties are booked. Typically, Januarysees the highest demand (peak season occupancy), while June experiences the lowest (low season). Effective strategies, like adjusting minimum stays or offering promotions, can boost occupancy during slower periods. Here's how different property tiers perform in Icheon-si:
- Best-in-class properties (Top 10%) achieve 73%+ occupancy, indicating high desirability and potentially optimized availability.
- Strong performing properties (Top 25%) maintain 56% or higher occupancy, suggesting good market fit and guest satisfaction.
- Typical properties (Median) have an occupancy rate around 36%.
- Entry-level properties (Bottom 25%) average 18% occupancy, potentially facing higher vacancy.
Average Monthly Occupancy Rate Trend in Icheon-si
What Is the Average Airbnb Nightly Rate in Icheon-si?
Effective short term rental pricing strategy in Icheon-si involves understanding monthly ADR fluctuations. The Average Daily Rate (ADR) for Airbnb in Icheon-si typically peaks in February and dips lowest during November. Leveraging Airbnb dynamic pricing tools or strategies based on this seasonality can significantly boost revenue. Here's a look at the typical nightly rates achieved:
- Best-in-class properties (Top 10%) command rates of $278+ per night, often due to premium features or locations.
- Strong performing properties (Top 25%) achieve nightly rates of $121 or more.
- Typical properties (Median) charge around $78 per night.
- Entry-level properties (Bottom 25%) earn around $62 per night.
Average Daily Rate (ADR) Trend by Month in Icheon-si
What Is the RevPAR for Airbnb in Icheon-si?
RevPAR in Icheon-si is currently $38. Because RevPAR combines nightly rates with realized occupancy, it is one of the cleanest ways to compare how efficiently listings turn demand into revenue across the market.
- Entry-level properties (Bottom 25%) see $22 RevPAR.
- Typical properties (Median) generate $32 RevPAR.
- Strong performers (Top 25%) earn $39 RevPAR.
- Best-in-class (Top 10%) achieve $111 RevPAR.
Average Monthly RevPAR Trend in Icheon-si
RevPAR Insights for Icheon-si
- The average RevPAR in Icheon-si is $38. This metric combines nightly rates with realized occupancy, making it one of the best single-number indicators of market efficiency.
- The gap between the top 10% ($111) and bottom 25% ($22) is $89, suggesting a relatively compressed market where operational differences yield moderate returns.
- RevPAR peaks in Feb and bottoms out in Jun, mirroring the broader seasonal demand pattern and suggesting opportunities for dynamic pricing.
Recommendations for Hosts
- Track your own RevPAR monthly against these Icheon-si benchmarks. If your RevPAR falls below the median of $32, examine whether low occupancy or low ADR is the primary drag.
- Top-quartile listings achieve $39+ RevPAR through a combination of competitive pricing, strong reviews, and strategic amenities. Target this tier through incremental improvements.
- Use RevPAR rather than revenue alone when comparing properties of different sizes — it normalizes for available nights and gives a more accurate picture of performance.
Get Live Icheon-si Market Intelligence 👇
Explore Real-time Analytics
When Is the Peak Season for Airbnb in Icheon-si?
Icheon-si's peak Airbnb season falls in October, February, January, while the softest stretch is April, June, September. Overall, the market shows highly seasonal trends requiring careful strategy, which should guide pricing, minimum stays, and cash-flow planning.
Peak Season (October, February, January)
- Revenue averages $1,943 per month
- Occupancy rates average 50.7%
- Daily rates average $125
Shoulder Season
- Revenue averages $1,394 per month
- Occupancy maintains around 36.5%
- Daily rates hold near $125
Low Season (April, June, September)
- Revenue drops to average $1,108 per month
- Occupancy decreases to average 29.2%
- Daily rates adjust to average $128
Seasonality Insights for Icheon-si
- Airbnb seasonality in Icheon-si is pronounced. Revenue swings sharply between peak and low months, which means pricing strategy, minimum-stay settings, and cash reserves all need to account for extended slower periods.
- During the high season, the absolute peak month showcases Icheon-si's highest earning potential, with monthly revenues climbing to $2,001, occupancy reaching 53.4%, and ADRs peaking at $133.
- Conversely, the slowest single month marks the market's lowest point — revenue may dip to $973, occupancy could drop to 23.3%, and ADRs may adjust to $118.
- Lower occupancy paired with meaningful seasonality means hosts in Icheon-si need to maximize every peak-season booking and seriously consider whether off-season pricing adjustments or minimum-stay changes can capture incremental revenue.
Seasonal Strategies for Maximizing Profit
- Peak Season: Maximize revenue through premium pricing. In a high-regulation market like Icheon-si, ensure your permit covers the number of nights you plan to book — some jurisdictions cap annual rental days.
- Low Season: Offer competitive pricing, extended-stay discounts, and flexible cancellation policies. Target off-season travelers like remote workers, budget-conscious guests, and travelers with flexible schedules.
- Shoulder Seasons: Implement dynamic pricing that bridges peak and low rates. Target weekend travelers, local events, and business visitors. Slightly more flexible terms than peak season can help maintain occupancy without deep discounting.
- In a highly seasonal market like Icheon-si, building a cash reserve during the top months is essential for covering fixed costs during the slow period. Automated pricing tools can help capture demand shifts in real time.
Do You Need a License for Airbnb in Icheon-si?
Yes, Icheon-si, Gyeonggi Province, South Korea enforces high STR regulations and 72% of active listings show registration evidence — indicating that enforcement is active and compliance is a prerequisite for operating legally. Hosts entering this market should budget for permit fees, inspections, and potential occupancy tax obligations as part of their startup costs. Always verify the latest short-term rental regulations and Airbnb license requirements directly with local government authorities for Icheon-si to ensure full compliance before hosting.
(Source: AirROI data, 2026, based on 72% licensed listings)
What Are the Best Neighborhoods for Airbnb in Icheon-si?
With a compact short-term rental market, Icheon-si gives early-mover hosts an advantage in the right neighborhoods. The areas listed below are where guest demand and local attractions converge — a useful lens for investors evaluating whether to enter this market and where to position their listing.
| Neighborhood / Area | Why Host Here? (Target Guests & Appeal) | Key Attractions & Landmarks |
|---|---|---|
| Icheon Termeden | A popular thermal spa complex attracting visitors seeking relaxation and wellness. Ideal for hosting guests who wish to take advantage of the health benefits of hot springs. | Icheon Terminus, Icheon Spa Park, Korean Traditional Tea Experience, Icheon National Museum, Korean Ceramic Museum |
| Icheon World Ceramic Centre | A hub for art and culture, showcasing traditional and modern ceramics. Attracts art lovers and tourists interested in Korea's rich cultural heritage. | Icheon World Ceramic Centre, Ceramic Experience Studio, Icheon Ceramic Village |
| Gwangsang Park | A well-known urban park in Icheon, perfect for family outings and leisure activities. Great location for accommodating guests looking to enjoy outdoor activities. | Walking Trails, Picnic Areas, Rose Garden, Children's Playground |
| Hansol Oak Valley | A scenic valley area with beautiful nature and outdoor activities. Popular for guests interested in hiking and nature education. | Hiking Trails, Nature Center, Campsites |
| Simchung Kwan | A historical site that offers a glimpse into Korea's past. Attracts visitors interested in cultural tourism and history. | Historical Exhibits, Traditional Korean Architecture, Guided Tours |
| Icheon Traditional Market | A vibrant local market offering authentic Korean food and handmade goods. Popular among tourists looking to experience local culture. | Local Food Stalls, Traditional Crafts, Street Performances |
| Icheon Sports Park | A multi-sport complex suitable for sports enthusiasts and families. Ideal for groups looking for active leisure. | Athletic Fields, Courts, Fitness Facilities |
| Icheon City Hall Area | The central area of Icheon with easy access to various city amenities. Convenient for tourists who want to explore the city. | City Hall Park, Local Restaurants, Shopping |
Because Icheon-si has a high regulation profile, confirming that short-term rental permits are available in your target neighborhood is a critical first step before committing to a property purchase. Regulation can vary at the neighborhood or district level even within the same city.
What Types of Properties Are on Airbnb in Icheon-si?
Room Type Distribution
Property Type Distribution
Market Composition Insights for Icheon-si
- The Icheon-si Airbnb market composition is heavily skewed towards Entire Home/Apt listings, which make up 75.9% of the 29 active rentals. This indicates strong guest preference for privacy and space.
- Looking at the property type distribution in Icheon-si, House properties are the most common (51.7%), reflecting the local real estate landscape.
- Houses represent a significant 51.7% portion, catering likely to families or larger groups.
- The presence of 31% Hotel/Boutique listings indicates integration with traditional hospitality.
Icheon-si Airbnb Room Capacity Analysis (2026): Bedroom Distribution
Distribution of Listings by Number of Bedrooms
Room Capacity Insights for Icheon-si
- The dominant room capacity in Icheon-si is 1 bedroom listings, making up 41.4% of the market. This suggests a strong demand for properties suitable for couples or solo travelers.
- Together, 1 bedroom and 2 bedrooms properties represent 62.1% of the active Airbnb listings in Icheon-si, indicating a high concentration in these sizes.
- A significant 24.1% of listings offer 3+ bedrooms, catering to larger groups and families seeking more space in Icheon-si.
Icheon-si Vacation Rental Guest Capacity Trends (2026)
Distribution of Listings by Guest Capacity
Guest Capacity Insights for Icheon-si
- The most common guest capacity trend in Icheon-si vacation rentals is listings accommodating 2 guests (37.9%). This suggests the primary traveler segment is likely couples or solo travelers.
- Properties designed for 2 guests and 8+ guests dominate the Icheon-si STR market, accounting for 58.6% of listings.
- 34.4% of properties accommodate 6+ guests, serving the market segment for larger families or group travel in Icheon-si.
- On average, properties in Icheon-si are equipped to host 3.9 guests.
How Do Listings in Icheon-si Compare on Quality?
Listing quality in Icheon-si can be approximated through presentation depth, bedroom count, and how often hosts disclose exact locations. These signals show how professionally the local supply base is merchandised.
Listing Quality Insights for Icheon-si
- At 49.5 photos per listing on average, Icheon-si hosts invest well in visual presentation. Listings with 20+ photos consistently outperform in search ranking and conversion.
- 24.1% of listings show their exact location. Lower disclosure rates can increase booking hesitation — guests want to know exactly where they are staying.
Recommendations for Hosts
- Enable exact location if possible — it removes a common source of guest uncertainty and can improve your listing's position in map-based searches.
- Use these quality indicators as a self-audit checklist. Listings that exceed the Icheon-si averages across all three metrics are better positioned for premium pricing.
What Amenities Do Airbnb Guests Expect in Icheon-si?
Amenity Prevalence
Amenity Insights for Icheon-si
- Essential amenities in Icheon-si that guests expect include: Air conditioning, Free parking on premises, Kitchen, Wifi, Hair dryer. Lacking these (any) could significantly impact bookings.
- Popular amenities like Fire extinguisher, TV, Heating are common but not universal. Offering these can provide a competitive edge.
Recommendations for Hosts
- Ensure your listing includes all essential amenities for Icheon-si: Air conditioning, Free parking on premises, Kitchen, Wifi, Hair dryer.
- Prioritize adding missing essentials: Air conditioning, Free parking on premises, Hair dryer.
- Consider adding popular differentiators like Fire extinguisher or TV to increase appeal.
- Highlight unique or less common amenities you offer (e.g., hot tub, dedicated workspace, EV charger) in your listing description and photos.
- Regularly check competitor amenities in Icheon-si to stay competitive.
Which Airbnb Amenities Boost Revenue in Icheon-si?
Not every amenity matters equally. This table focuses on the amenities most associated with higher revenue in Icheon-si, which makes it more useful for prioritizing upgrades than a simple popularity list alone.
| Amenity | Prevalence | Revenue With | Revenue Without | Revenue Uplift |
|---|---|---|---|---|
Cooking basics | 82.8% | $11,747 | $4,129 | 184.5% |
Refrigerator | 79.3% | $11,870 | $4,926 | 141.0% |
BBQ grill | 41.4% | $15,772 | $6,665 | 136.6% |
Backyard | 27.6% | $17,058 | $7,910 | 115.7% |
Iron | 37.9% | $15,559 | $7,301 | 113.1% |
Essentials | 79.3% | $11,704 | $5,562 | 110.4% |
Barbecue utensils | 31.0% | $15,604 | $8,106 | 92.5% |
Outdoor dining area | 37.9% | $14,834 | $7,744 | 91.6% |
Hot water kettle | 48.3% | $13,709 | $7,376 | 85.9% |
Rice maker | 31.0% | $14,438 | $8,631 | 67.3% |
Revenue Impact Insights for Icheon-si
- Cooking basics tops the revenue impact list with a 184.5% uplift — listings with this amenity earn $11,747 vs. $4,129 without it.
- Cooking basics — while widespread — still correlate with meaningful revenue gains, making it table stakes rather than true differentiators.
Recommendations for Hosts
- Focus your upgrade budget on amenities in the top half of this table. Below-median amenities may improve guest experience but contribute less to revenue growth.
- Highlight revenue-impacting amenities prominently in your listing title, photos, and description — guests can't value what they don't notice.
Dive Deeper: Advanced Icheon-si STR Market Data (2026)
Ready to unlock more insights? AirROI provides access to advanced metrics and comprehensive Airbnb data for Icheon-si. Explore detailed analytics beyond this report to refine your investment strategy, optimize pricing, and maximize your vacation rental profits.
Explore Advanced MetricsIcheon-si Airbnb Guest Demographics & Profile Analysis (2026)
Guest Profile Summary for Icheon-si
- The typical guest profile for Airbnb in Icheon-si consists of primarily domestic travelers (81%), often arriving from nearby Seoul, typically belonging to the Post-2000s (Gen Z/Alpha) group (50%), primarily speaking Korean or English.
- Domestic travelers account for 80.9% of guests.
- Key international markets include South Korea (80.9%) and United States (4.6%).
- Top languages spoken are Korean (45.7%) followed by English (36.2%).
- A significant demographic segment is the Post-2000s (Gen Z/Alpha) group, representing 50% of guests.
Recommendations for Hosts
- Target domestic marketing efforts towards travelers from Seoul and Suwon-si.
- Tailor amenities and listing descriptions to appeal to the dominant Post-2000s (Gen Z/Alpha) demographic (e.g., highlight fast WiFi, smart home features, local guides).
- Highlight unique local experiences or amenities relevant to the primary guest profile.
- Consider seasonal promotions aligned with peak travel times for key origin markets.
What Are Airbnb Guest Ratings in Icheon-si?
Listings in Icheon-si average 4.75 out of 5 overall, with about 101.8 reviews per active listing and 41.4% of listings carrying the Guest Favorite badge.
Rating Breakdown by Category
Guest Rating Insights for Icheon-si
- An average rating of 4.75 places Icheon-si in solid territory. Most guests leave satisfied, though there is room for hosts to push toward the top tier.
- The strongest subcategory is Check-in (4.87), while Value (4.68) trails behind — a useful signal for hosts looking to prioritize upgrades.
- 41.4% of listings carry the Guest Favorite badge, a strong trust signal that can meaningfully lift click-through and booking rates.
Recommendations for Hosts
- Focus improvement efforts on Value — even small gains in the weakest subcategory can lift overall ratings and search ranking.
- Encourage guests to leave reviews after checkout. Listings with more reviews rank higher in search results and convert browsers into bookers more effectively.
Icheon-si Airbnb Booking Patterns (2026): Available vs. Booked Days
Available Days Distribution
Booked Days Distribution
Booking Pattern Insights for Icheon-si
- The most common availability pattern in Icheon-si falls within the 271-366 days range, representing 58.6% of listings. This suggests many properties have significant open periods on their calendars.
- Approximately 82.7% of listings show high availability (181+ days open annually), indicating potential for increased bookings or specific owner usage patterns.
- For booked days, the 1-30 days range is most frequent in Icheon-si (31%), reflecting common guest stay durations or potential owner blocking patterns.
- A notable 17.2% of properties secure long booking periods (181+ days booked per year), highlighting successful long-term rental strategies or significant owner usage.
How Far in Advance Do Guests Book Airbnb in Icheon-si?
Average Booking Lead Time by Month
Booking Lead Time Insights for Icheon-si
- The overall average booking lead time for vacation rentals in Icheon-si is 20 days.
- Guests book furthest in advance for stays during November (average 30 days), likely coinciding with peak travel demand or local events.
- The shortest booking windows occur for stays in March (average 16 days), indicating more last-minute travel plans during this time.
- Seasonally, Fall (25 days avg.) sees the longest lead times, while Winter (19 days avg.) has the shortest, reflecting typical travel planning cycles.
Recommendations for Hosts
- Use the overall average lead time (20 days) as a baseline for your pricing and availability strategy in Icheon-si.
- Target marketing efforts for the Fall season well in advance (at least 25 days) to capture early planners.
- Monitor your own booking lead times against these Icheon-si averages to identify opportunities for dynamic pricing adjustments.
What Is the Average Length of Stay for Airbnb in Icheon-si?
Guests in Icheon-si stay about 2.2 nights on average, generating roughly 388 reservations and 13.9 bookings per listing in the latest AirROI dataset. The most common check-in time is 3:00 PM and check-out is 11:00 AM.
Monthly Length of Stay in Icheon-si
Check-in Time Distribution
Check-out Time Distribution
Stay Pattern Insights for Icheon-si
- Very short stays drive high turnover. Cleaning costs, consumable restocking, and check-in coordination become significant operational factors at this frequency.
- 13.9 bookings per listing is a manageable pace that balances revenue with operational overhead.
- Stay lengths peak in Jun (2.8 nights) and shorten in Sep (1.4 nights). Adjust minimum-night requirements seasonally to match.
Recommendations for Hosts
- With shorter average stays, focus on streamlining turnover. Self-check-in, reliable cleaning crews, and pre-staged amenities can reduce per-booking operational costs.
- Set your check-in time to match or beat the market standard of 3:00 PM. Offering early check-in flexibility can be a low-cost differentiator.
- Monitor length-of-stay seasonality to adjust minimum-night requirements — longer minimums during peak periods maximize revenue while shorter minimums fill gaps in shoulder seasons.
Icheon-si Airbnb Minimum Stay Requirements Analysis
Distribution of Listings by Minimum Night Requirement
1 Night
26 listings
89.7% of total
30+ Nights
3 listings
10.3% of total
Key Insights
- The most prevalent minimum stay requirement in Icheon-si is 1 Night, adopted by 89.7% of listings. This highlights the market's preference for shorter, flexible bookings.
- A strong majority (89.7%) of the Icheon-si Airbnb data shows acceptance of very short stays (1-2 nights), indicating a dynamic, high-turnover market.
- A significant segment (10.3%) caters to monthly stays (30+ nights) in Icheon-si, pointing to opportunities in the extended-stay market.
Recommendations
- Align with the market by considering a 1 Night minimum stay, as 89.7% of Icheon-si hosts use this setting.
- Explore offering discounts for stays of 30+ nights to attract the 10.3% of the market seeking extended stays.
- Adjust minimum nights based on seasonality – potentially shorter during low season and longer during peak demand periods in Icheon-si.
Icheon-si Airbnb Cancellation Policy Trends Analysis (2026)
Flexible
4 listings
13.8% of total
Moderate
11 listings
37.9% of total
Firm
13 listings
44.8% of total
Strict
1 listings
3.4% of total
Cancellation Policy Insights for Icheon-si
- The prevailing Airbnb cancellation policy trend in Icheon-si is Firm, used by 44.8% of listings.
- There's a relatively balanced mix between guest-friendly (51.7%) and stricter (48.2%) policies, offering choices for different guest needs.
- Strict cancellation policies are quite rare (3.4%), potentially making listings with this policy less competitive unless justified by high demand or property type.
Recommendations for Hosts
- Consider adopting a Firm policy to align with the 44.8% market standard in Icheon-si.
- Using a Strict policy might deter some guests, as only 3.4% of listings use it. Evaluate if potential revenue protection outweighs possible lower booking rates.
- Regularly review your cancellation policy against competitors and market demand shifts in Icheon-si.
How Much Are Airbnb Cleaning Fees in Icheon-si?
Cleaning fees in Icheon-si are meaningful operating levers, not just pass-through charges. What matters most is how often hosts charge them, how high they run relative to market norms, and how large a share of gross revenue they consume.
Cleaning Fee Insights for Icheon-si
- About 44.8% of Icheon-si listings charge a cleaning fee — a mixed market where some hosts absorb the cost into nightly rates while others break it out.
- The average cleaning fee of $14 is close to the median ($12), suggesting a relatively consistent fee structure across the market.
- Cleaning fees represent 2.7% of gross revenue on average — a modest component of the overall booking price.
Recommendations for Hosts
- Price your cleaning fee competitively against the Icheon-si median of $12. Fees significantly above market norms can deter bookings, especially for shorter stays.
- Monitor competitor cleaning fees regularly. Airbnb's search algorithm factors in total price, so a well-calibrated cleaning fee can improve your listing's ranking.
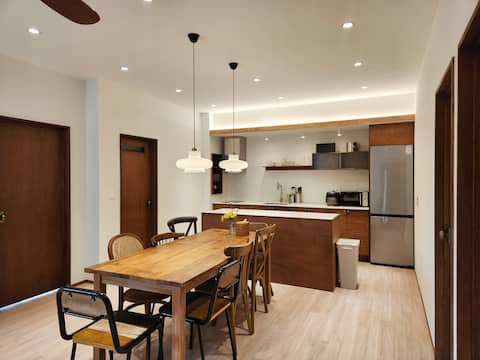
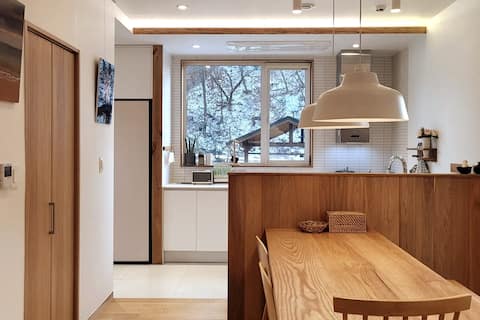
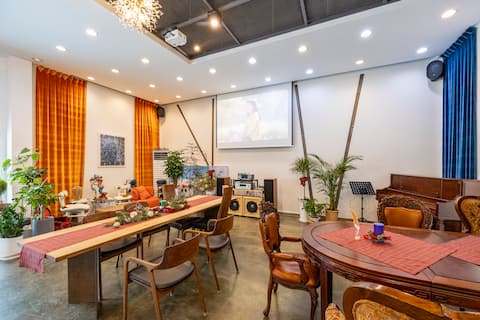
What Do the Top Airbnb Listings in Icheon-si Look Like?
Benchmark your potential! Explore examples of top-performing Airbnb properties in Icheon-sibased on Trailing Twelve Month (TTM) revenue. Analyze their characteristics, revenue, occupancy rate, and ADR to understand what drives success in this market.
Al House (No. 2)
Entire Place • 3 bedrooms
Al House (No. 1)
Entire Place • 3 bedrooms
20 people sleeping/20 cars parked/Wow! It's summer/Swimming pool open/Birthday party - (Buffet conne
Entire Place • 2 bedrooms

2,000-pyeong countryside camp, 100-pyeong yard, 2-3-story loft-style house full of sunlight (+ 2 lar
Entire Place • 2 bedrooms
이천 최고의 호수 뷰 | 'Dos' 신축|발코니 석양|이천 중심
Entire Place • 1 bedroom

'Uno'|Lake View Balcony Stay|Icheon Center
Entire Place • 1 bedroom
Note: Performance varies based on location, size, amenities, seasonality, and management quality. Data reflects the past 12 months.
Who Are the Top Airbnb Hosts in Icheon-si?
Learn from the best! This table showcases top-performing Airbnb hosts in Icheon-si based on the number of properties managed and estimated total revenue over the past year. Analyze their scale and performance metrics.
| Host Name | Properties | Grossing Revenue | Stay Reviews | Avg Rating |
|---|---|---|---|---|
| Hyewon | 2 | $82,417 | 157 | 4.92/5.0 |
| Sophie | 3 | $41,205 | 768 | 4.97/5.0 |
| 윤숙 | 1 | $40,350 | 160 | 4.93/5.0 |
| 다다 | 2 | $20,046 | 262 | 4.96/5.0 |
| 혜승 | 1 | $19,015 | 336 | 4.92/5.0 |
| 휴티스 스테이 | 2 | $14,900 | 34 | 4.79/5.0 |
| 포근한 하루 | 2 | $11,456 | 85 | 5.00/5.0 |
| MinZoe | 1 | $10,103 | 10 | 4.80/5.0 |
| 룸브리즈Op | 1 | $9,647 | 24 | 4.83/5.0 |
| 골든플래닛호텔 | 1 | $8,866 | 12 | 4.67/5.0 |
Analyzing the strategies of top hosts, such as their property selection, pricing, and guest communication, can offer valuable lessons for optimizing your own Airbnb operations in Icheon-si.
Who Are the Airbnb Hosts in Icheon-si?
Icheon-si is a quality-focused market, with a high Superhost share and fairly mature operating standards.
Host Profile Insights for Icheon-si
- With 65.5% Superhosts, Icheon-si has an experienced host base that sets high guest expectations. New entrants should plan for competitive quality standards.
- 3.4% of listings have Instant Book enabled. Lower Instant Book adoption means many guests must request approval, which can slow conversions.
- 79.3% of listings use Airbnb's simplified pricing (host-only fee), where the host pays the entire platform service fee and the guest sees one all-in price with no separate Airbnb service charge. High adoption signals a professional, PMS-connected host base — Airbnb mandates simplified pricing for software-connected listings.
Recommendations for Hosts
- Consider enabling Instant Book — it reduces booking friction and Airbnb's algorithm tends to favor Instant Book listings in search results.
- With 41.4% cohosted listings, there may be a growing local market for property management services.
- Benchmark your host metrics against these Icheon-si averages regularly and adjust your hosting strategy based on what top performers do differently.
How Does Icheon-si's Airbnb Market Compare to Nearby Cities?
How does the Icheon-si Airbnb market stack up against its neighbors? Compare key performance metrics like average monthly revenue, ADR, and occupancy rates in surrounding areas to understand the broader regional STR landscape.
Compared with Seoul, Icheon-si has 19 percentage points lower occupancy and about $51 higher ADR. That helps frame whether this market is winning more on demand, pricing, or both.
| Market | Active Properties | Monthly Revenue | Daily Rate | Avg. Occupancy |
|---|---|---|---|---|
| Wondeok-ri | 10 | $2,288 | $236.28 | 33% |
| Sang | 14 | $1,714 | $251.82 | 21% |
| Yeoju-si | 26 | $1,452 | $222.76 | 24% |
| Nomun-ri | 13 | $1,407 | $348.97 | 18% |
| Namyangju-si | 46 | $1,401 | $198.53 | 27% |
| Jeongbae-ri | 11 | $1,373 | $191.35 | 32% |
| Chunyang-myeon | 15 | $1,233 | $127.08 | 40% |
| Sangju-si | 12 | $1,180 | $200.33 | 21% |
| Yangpyeong-gun | 21 | $1,166 | $246.38 | 23% |
| Seoul | 17,693 | $1,118 | $98.53 | 52% |
Frequently Asked Questions About Airbnb in Icheon-si
These quick answers summarize the most common investor and operator questions using AirROI's latest market data for Icheon-si.
How much do Airbnb hosts make in Icheon-si?
Icheon-si hosts earn about $10,433 per year on average, with an average nightly rate of $149 and RevPAR of $38. Those figures describe the typical revenue environment for active listings in Icheon-si, Gyeonggi Province, not the ceiling for the best operators. Source: AirROI 2026 data, Icheon-si market, July 2025 to June 2026.
What is the average Airbnb occupancy rate in Icheon-si?
The average Airbnb occupancy rate in Icheon-si is 32.6%. October is the strongest month and June is the softest, so hosts should expect demand to move meaningfully throughout the year rather than stay flat.
What is the average Airbnb daily rate in Icheon-si?
Listings in Icheon-si average $149 per night. The broader pricing spread also matters: lower-performing listings cluster closer to the lower quartiles, while premium homes can price materially above the city average when demand spikes or listing quality stands out.
How many Airbnb listings are active in Icheon-si?
Icheon-si currently has about 29 active Airbnb listings in AirROI's market dataset. That supply count helps explain how competitive the market is, how much depth there is for benchmarking, and whether the market behaves like a niche destination or a scaled urban market.
How strict are short-term rental regulations in Icheon-si?
AirROI currently classifies the short-term rental regulation level in Icheon-si as High. The dataset also shows about 72.4% of listings with registration evidence. That is a market signal, not legal advice, so hosts should still confirm current licensing and compliance rules locally before listing.
What is the RevPAR for Airbnb in Icheon-si?
RevPAR in Icheon-si is about $38. That metric combines pricing and occupancy into one efficiency number, so it is often a better quick benchmark than ADR alone when investors want to compare how well listings convert nightly rates into realized revenue.
Is Airbnb profitable in Icheon-si?
Occupancy of 32.6% means Icheon-si is a more selective market. Profitability is achievable but requires careful cost management, premium positioning, or targeting longer stays to reduce turnover. Average annual revenue is $10,433, but individual returns depend on property type, location within the city, and the host's operating efficiency.
How far in advance do guests book Airbnb in Icheon-si?
The average booking lead time in Icheon-si is about 20 days — a relatively short booking window, meaning most guests decide within a few weeks of their trip — dynamic pricing can capture late demand. Hosts who understand their market's booking cadence can adjust minimum stays and pricing windows accordingly.
What are the best neighborhoods for Airbnb in Icheon-si?
Based on AirROI's analysis, some of the top neighborhoods for short-term rentals in Icheon-si include Icheon Termeden, Icheon World Ceramic Centre, Gwangsang Park. Each area attracts different guest profiles — from business travelers to leisure visitors — so the best location depends on the property type and target audience a host is aiming for. See the full neighborhood breakdown above.
What type of property performs best on Airbnb in Icheon-si?
entire_home listings make up 75.9% of the active supply in Icheon-si. The most common configuration does not always mean the most profitable — operators who identify underserved property types or bedroom counts can sometimes outperform the market average by filling a gap in local supply.
How does Icheon-si compare to nearby Airbnb markets?
Among neighboring markets, Wondeok-ri posts $27,451 in average annual revenue with 33.2% occupancy, compared to Icheon-si's $10,433 and 32.6%. Comparing nearby markets helps investors understand whether a destination's performance reflects local demand or broader regional trends.
What is the average length of stay in Icheon-si?
The average Airbnb stay length in Icheon-si is about 2.2 nights. That matters for turnover, cleaning operations, and pricing strategy because shorter stays increase changeovers while longer stays can smooth occupancy and reduce operational friction.
What is the average Airbnb guest rating in Icheon-si?
Airbnb listings in Icheon-si average 4.75 out of 5 overall. About 41.4% of listings carry the guest favorite badge, which suggests a meaningful share of inventory is competing on review quality rather than price alone.
Which amenities boost Airbnb revenue in Icheon-si?
Cooking basics and Refrigerator are among the strongest revenue-linked amenities in Icheon-si. In AirROI's latest dataset, listings with these amenities outperform those without on average revenue, which makes amenities analysis useful for prioritizing investment and listing upgrades.
Do Airbnb hosts charge cleaning fees in Icheon-si?
Yes. About 44.8% of active Airbnb listings in Icheon-si charge a cleaning fee, and the average fee is $14. The more important operating benchmark is how much of gross revenue that fee consumes, not just the absolute dollar amount.
What percentage of Airbnb hosts are Superhosts in Icheon-si?
A 65.5% Superhost rate signals a highly competitive market where review quality and responsiveness are table stakes, not differentiators.
About AirROI Market Data
AirROI tracks over 20 million properties across 190+ countries and maintains 15+ years of historical performance data, making it one of the deepest Airbnb and STR intelligence platforms available. The analytics pipeline aggregates listing-level data monthly — revenue, occupancy, nightly rates, RevPAR, guest demographics, booking patterns, and competitive supply — so investors and operators can benchmark any market against its own history and against neighboring destinations.
Real estate investors, property managers, financial institutions, hedge funds, tourism boards, hospitality consultants, tech platforms, and academic researchers rely on AirROI data to underwrite acquisitions, optimize pricing, model macro trends, and conduct peer-reviewed research. Data is available through in-depth market reports like this one and the Airbnb API with 22 endpoints and an Airbnb MCP Server for AI agents.
AirROI proprietary analytics as of 2026-06-30. Metrics reflect trailing twelve-month aggregates from active listings. Revenue figures are market averages, not projections. Neighborhood descriptions are AI-generated and reviewed for accuracy. For full methodology, see the data methodology page.