Ashley, England Airbnb Market Data 2025: STR Report & Statistics
How much can you earn on Airbnb in Ashley, England? Based on AirROI's 2025 dataset (March 2024 – February 2025), the short answer is $52,246 per year — at a $322 nightly rate, 50.6% occupancy, and a N/A RevPAR.
With just 17 active listings, Ashley is a micro-market where solid booking activity throughout the year. The market trimmed 19.0% of its supply as weaker listings exited. For hosts in Ashley, fewer competitors means an opportunity to capture share through operational excellence, smart pricing, and tapping underserved guest segments before the next growth cycle.
Regulation is low with minimal registration requirements, pointing to an operator-friendly environment. In a market this size, differentiated listings with strong reviews can capture outsized returns relative to the competition.
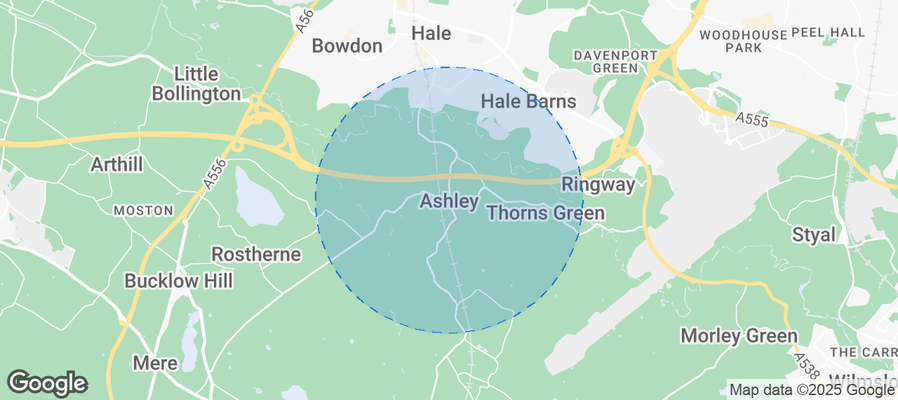
Table of Contents [hide] [show]
What Are the Key Airbnb Metrics in Ashley?
In Ashley, the headline Airbnb metrics are $52,246 in average annual revenue,50.6% occupancy, $322 ADR, and $0 in RevPAR, and guests book about 85 days in advance.
How Much Do Airbnb Hosts Earn Monthly in Ashley?
Understanding the monthly revenue variations for Airbnb listings in Ashley is key to maximizing your short term rental income potential. Seasonality significantly impacts earnings. Our analysis, based on data from the past 12 months, shows that the peak revenue month for STRs in Ashley is typically December, while January often presents the lowest earnings, highlighting opportunities for strategic pricing adjustments during shoulder and low seasons. Explore the typical Airbnb income in Ashley across different performance tiers:
- Best-in-class properties (Top 10%) achieve $13,842+ monthly, often utilizing dynamic pricing and superior guest experiences.
- Strong performing properties (Top 25%) earn $5,710 or more, indicating effective management and desirable locations/amenities.
- Typical properties (Median) generate around $2,753 per month, representing the average market performance.
- Entry-level properties (Bottom 25%) see earnings around $1,921, often with potential for optimization.
Average Monthly Airbnb Earnings Trend in Ashley
What Is the Monthly Airbnb Occupancy Rate in Ashley?
Maximize your bookings by understanding the Ashley STR occupancy trends. Seasonal demand shifts significantly influence how often properties are booked. Typically, Decembersees the highest demand (peak season occupancy), while March experiences the lowest (low season). Effective strategies, like adjusting minimum stays or offering promotions, can boost occupancy during slower periods. Here's how different property tiers perform in Ashley:
- Best-in-class properties (Top 10%) achieve 86%+ occupancy, indicating high desirability and potentially optimized availability.
- Strong performing properties (Top 25%) maintain 70% or higher occupancy, suggesting good market fit and guest satisfaction.
- Typical properties (Median) have an occupancy rate around 42%.
- Entry-level properties (Bottom 25%) average 27% occupancy, potentially facing higher vacancy.
Average Monthly Occupancy Rate Trend in Ashley
What Is the Average Airbnb Nightly Rate in Ashley?
Effective short term rental pricing strategy in Ashley involves understanding monthly ADR fluctuations. The Average Daily Rate (ADR) for Airbnb in Ashley typically peaks in July and dips lowest during January. Leveraging Airbnb dynamic pricing tools or strategies based on this seasonality can significantly boost revenue. Here's a look at the typical nightly rates achieved:
- Best-in-class properties (Top 10%) command rates of $856+ per night, often due to premium features or locations.
- Strong performing properties (Top 25%) achieve nightly rates of $383 or more.
- Typical properties (Median) charge around $178 per night.
- Entry-level properties (Bottom 25%) earn around $135 per night.
Average Daily Rate (ADR) Trend by Month in Ashley
What Is the RevPAR for Airbnb in Ashley?
RevPAR in Ashley is currently N/A. Because RevPAR combines nightly rates with realized occupancy, it is one of the cleanest ways to compare how efficiently listings turn demand into revenue across the market.
- Entry-level properties (Bottom 25%) see N/A RevPAR.
- Typical properties (Median) generate N/A RevPAR.
- Strong performers (Top 25%) earn N/A RevPAR.
- Best-in-class (Top 10%) achieve N/A RevPAR.
Average Monthly RevPAR Trend in Ashley
RevPAR Insights for Ashley
- RevPAR peaks in Jan and bottoms out in Jan, mirroring the broader seasonal demand pattern and suggesting opportunities for dynamic pricing.
Recommendations for Hosts
- Track your own RevPAR monthly against these Ashley benchmarks. If your RevPAR falls below the median of N/A, examine whether low occupancy or low ADR is the primary drag.
- Use RevPAR rather than revenue alone when comparing properties of different sizes — it normalizes for available nights and gives a more accurate picture of performance.
Get Live Ashley Market Intelligence 👇
Explore Real-time Analytics
When Is the Peak Season for Airbnb in Ashley?
Ashley's peak Airbnb season falls in December, July, May, while the softest stretch is January, March, September. Overall, the market shows moderate seasonality with distinct peak and low periods, which should guide pricing, minimum stays, and cash-flow planning.
Peak Season (December, July, May)
- Revenue averages $6,599 per month
- Occupancy rates average 55.4%
- Daily rates average $371
Shoulder Season
- Revenue averages $5,444 per month
- Occupancy maintains around 48.6%
- Daily rates hold near $355
Low Season (January, March, September)
- Revenue drops to average $4,481 per month
- Occupancy decreases to average 41.8%
- Daily rates adjust to average $354
Seasonality Insights for Ashley
- The Airbnb seasonality pattern in Ashley shows moderate seasonality with distinct peak and low periods. While the sections above show seasonal averages, it is also insightful to look at the extremes:
- During the high season, the absolute peak month showcases Ashley's highest earning potential, with monthly revenues climbing to $6,987, occupancy reaching 61.3%, and ADRs peaking at $391.
- Conversely, the slowest single month marks the market's lowest point — revenue may dip to $4,180, occupancy could drop to 41.5%, and ADRs may adjust to $306.
- Understanding both the seasonal averages and these monthly peaks and troughs in revenue, occupancy, and ADR is crucial for maximizing your Airbnb profit potential in Ashley.
Seasonal Strategies for Maximizing Profit
- Peak Season: Maximize revenue through premium pricing and potentially longer minimum stays. Ensure high availability and consider tightening cancellation policies to reduce last-minute gaps.
- Low Season: Offer competitive pricing, extended-stay discounts, and flexible cancellation policies. Target off-season travelers like remote workers, budget-conscious guests, and travelers with flexible schedules.
- Shoulder Seasons: Implement dynamic pricing that bridges peak and low rates. Target weekend travelers, local events, and business visitors. Slightly more flexible terms than peak season can help maintain occupancy without deep discounting.
- Regularly analyze your own performance against these Ashley seasonality benchmarks and adjust your pricing and availability strategy accordingly.
Do You Need a License for Airbnb in Ashley?
Low regulation and minimal registration activity in Ashley, England, United Kingdom point to an operator-friendly environment. That said, even low-regulation markets may have tax collection requirements, safety standards, or HOA rules that affect short-term rental operations. Always verify the latest short-term rental regulations and Airbnb license requirements directly with local government authorities for Ashley to ensure full compliance before hosting.
(Source: AirROI data, 2026, finding no licensed listings among those analyzed)
What Are the Best Neighborhoods for Airbnb in Ashley?
With a compact short-term rental market, Ashley gives early-mover hosts an advantage in the right neighborhoods. The areas listed below are where guest demand and local attractions converge — a useful lens for investors evaluating whether to enter this market and where to position their listing.
| Neighborhood / Area | Why Host Here? (Target Guests & Appeal) | Key Attractions & Landmarks |
|---|---|---|
| Southampton | A bustling port city with rich maritime history and proximity to the New Forest and the Isle of Wight. Ideal for tourists and travelers looking to explore southern England's attractions. | SeaCity Museum, Tudor House and Garden, Mayflower Park, Southampton Common, West Quay Shopping Centre |
| Bournemouth | A popular seaside resort known for its beautiful beaches, gardens, and vibrant nightlife. Attracts beachgoers and families during the summer months. | Bournemouth Pier, Bournemouth Gardens, Oceanarium, Boscombe Beach, Russell-Cotes Art Gallery & Museum |
| Winchester | Historic city with a rich heritage, famous for its medieval architecture and the stunning Winchester Cathedral. Appeals to those interested in history and culture. | Winchester Cathedral, The Great Hall, Winchester Science Centre and Planetarium, Jane Austen's House Museum, The River Itchen |
| New Forest National Park | A beautiful natural park offering outdoor activities such as hiking, cycling, and wildlife spotting. Popular with nature lovers and those seeking a peaceful retreat. | Lyndhurst, Beaulieu, Exbury Gardens, Brockenhurst, The New Forest Cider |
| Portsmouth | Home to the historic dockyard and naval attractions, Portsmouth appeals to history enthusiasts and families. It also has beaches and a vibrant waterfront. | Portsmouth Historic Dockyard, Spinnaker Tower, Charles Dickens' Birthplace Museum, South Parade Pier, Clarence Pier |
| Salisbury | Known for its stunning medieval cathedral and proximity to Stonehenge, Salisbury attracts tourists interested in history and mystery. | Salisbury Cathedral, Stonehenge, Old Sarum, The Salisbury Museum, River Avon |
| Chichester | A charming city with Roman roots and a famous festival theatre, Chichester attracts those looking for culture and beautiful countryside. | Chichester Cathedral, Fishbourne Roman Palace, Pallant House Gallery, Goodwood House, Chichester Festival Theatre |
| Brighton | A vibrant coastal city known for its bohemian culture, piers, and nightlife. Extremely popular with tourists of all ages. | Brighton Pier, The Lanes, Royal Pavilion, Brighton Beach, British Airways i360 |
With 8 distinct neighborhoods showing meaningful short-term rental activity, Ashley offers diversification within a single market. Investors can tailor their strategy — from high-turnover tourist zones to quieter residential areas that attract longer stays and remote workers.
What Types of Properties Are on Airbnb in Ashley?
Room Type Distribution
Property Type Distribution
Market Composition Insights for Ashley
- The Ashley Airbnb market composition is heavily skewed towards Entire Home/Apt listings, which make up 94.1% of the 17 active rentals. This indicates strong guest preference for privacy and space.
- Looking at the property type distribution in Ashley, House properties are the most common (70.6%), reflecting the local real estate landscape.
- Houses represent a significant 70.6% portion, catering likely to families or larger groups.
Ashley Airbnb Room Capacity Analysis (2026): Bedroom Distribution
Distribution of Listings by Number of Bedrooms
Room Capacity Insights for Ashley
- The dominant room capacity in Ashley is 1 bedroom listings, making up 47.1% of the market. This suggests a strong demand for properties suitable for couples or solo travelers.
- Together, 1 bedroom and 2 bedrooms properties represent 70.6% of the active Airbnb listings in Ashley, indicating a high concentration in these sizes.
- A significant 29.4% of listings offer 3+ bedrooms, catering to larger groups and families seeking more space in Ashley.
Ashley Vacation Rental Guest Capacity Trends (2026)
Distribution of Listings by Guest Capacity
Guest Capacity Insights for Ashley
- The most common guest capacity trend in Ashley vacation rentals is listings accommodating 2 guests (29.4%). This suggests the primary traveler segment is likely couples or solo travelers.
- Properties designed for 2 guests and 8+ guests dominate the Ashley STR market, accounting for 58.8% of listings.
- 35.3% of properties accommodate 6+ guests, serving the market segment for larger families or group travel in Ashley.
- On average, properties in Ashley are equipped to host 4.5 guests.
What Amenities Do Airbnb Guests Expect in Ashley?
Amenity Prevalence
Amenity Insights for Ashley
- Essential amenities in Ashley that guests expect include: Wifi, Kitchen, Smoke alarm, Heating, Essentials, Carbon monoxide alarm, Refrigerator. Lacking these (any) could significantly impact bookings.
- Popular amenities like Private entrance, Free parking on premises, Dishes and silverware are common but not universal. Offering these can provide a competitive edge.
Recommendations for Hosts
- Ensure your listing includes all essential amenities for Ashley: Wifi, Kitchen, Smoke alarm, Heating, Essentials, Carbon monoxide alarm, Refrigerator.
- Consider adding popular differentiators like Private entrance or Free parking on premises to increase appeal.
- Highlight unique or less common amenities you offer (e.g., hot tub, dedicated workspace, EV charger) in your listing description and photos.
- Regularly check competitor amenities in Ashley to stay competitive.
Dive Deeper: Advanced Ashley STR Market Data (2026)
Ready to unlock more insights? AirROI provides access to advanced metrics and comprehensive Airbnb data for Ashley. Explore detailed analytics beyond this report to refine your investment strategy, optimize pricing, and maximize your vacation rental profits.
Explore Advanced MetricsAshley Airbnb Guest Demographics & Profile Analysis (2026)
Guest Profile Summary for Ashley
- The typical guest profile for Airbnb in Ashley consists of primarily domestic travelers (82%), often arriving from nearby England, typically belonging to the Post-2000s (Gen Z/Alpha) group (50%), primarily speaking English or French.
- Domestic travelers account for 82.0% of guests.
- Key international markets include United Kingdom (82%) and Australia (5%).
- Top languages spoken are English (70.3%) followed by French (8.8%).
- A significant demographic segment is the Post-2000s (Gen Z/Alpha) group, representing 50% of guests.
Recommendations for Hosts
- Target domestic marketing efforts towards travelers from England and London.
- Tailor amenities and listing descriptions to appeal to the dominant Post-2000s (Gen Z/Alpha) demographic (e.g., highlight fast WiFi, smart home features, local guides).
- Highlight unique local experiences or amenities relevant to the primary guest profile.
- Consider seasonal promotions aligned with peak travel times for key origin markets.
Ashley Airbnb Booking Patterns (2026): Available vs. Booked Days
Available Days Distribution
Booked Days Distribution
Booking Pattern Insights for Ashley
- The most common availability pattern in Ashley falls within the 181-270 days range, representing 41.2% of listings. This suggests many properties have significant open periods on their calendars.
- Approximately 70.6% of listings show high availability (181+ days open annually), indicating potential for increased bookings or specific owner usage patterns.
- For booked days, the 91-180 days range is most frequent in Ashley (41.2%), reflecting common guest stay durations or potential owner blocking patterns.
- A notable 29.4% of properties secure long booking periods (181+ days booked per year), highlighting successful long-term rental strategies or significant owner usage.
How Far in Advance Do Guests Book Airbnb in Ashley?
Average Booking Lead Time by Month
Booking Lead Time Insights for Ashley
- The overall average booking lead time for vacation rentals in Ashley is 85 days.
- Guests book furthest in advance for stays during August (average 121 days), likely coinciding with peak travel demand or local events.
- The shortest booking windows occur for stays in November (average 64 days), indicating more last-minute travel plans during this time.
- Seasonally, Summer (108 days avg.) sees the longest lead times, while Fall (86 days avg.) has the shortest, reflecting typical travel planning cycles.
Recommendations for Hosts
- Use the overall average lead time (85 days) as a baseline for your pricing and availability strategy in Ashley.
- For August stays, consider implementing length-of-stay discounts or slightly higher rates for bookings made less than 121 days out to capitalize on advance planning.
- Target marketing efforts for the Summer season well in advance (at least 108 days) to capture early planners.
- Monitor your own booking lead times against these Ashley averages to identify opportunities for dynamic pricing adjustments.
Ashley Airbnb Minimum Stay Requirements Analysis
Distribution of Listings by Minimum Night Requirement
2 Nights
4 listings
36.4% of total
7-29 Nights
2 listings
18.2% of total
30+ Nights
5 listings
45.5% of total
Key Insights
- The most prevalent minimum stay requirement in Ashley is 30+ Nights, adopted by 45.5% of listings. This highlights the market's preference for longer commitments.
- A significant segment (45.5%) caters to monthly stays (30+ nights) in Ashley, pointing to opportunities in the extended-stay market.
Recommendations
- Align with the market by considering a 30+ Nights minimum stay, as 45.5% of Ashley hosts use this setting.
- A 2-night minimum appears standard (36.4%). Consider this for weekends or peak periods.
- Explore offering discounts for stays of 30+ nights to attract the 45.5% of the market seeking extended stays.
- Adjust minimum nights based on seasonality – potentially shorter during low season and longer during peak demand periods in Ashley.
Ashley Airbnb Cancellation Policy Trends Analysis (2026)
Flexible
1 listings
7.7% of total
Moderate
2 listings
15.4% of total
Firm
6 listings
46.2% of total
Strict
4 listings
30.8% of total
Cancellation Policy Insights for Ashley
- The prevailing Airbnb cancellation policy trend in Ashley is Firm, used by 46.2% of listings.
- A majority (77.0%) of hosts in Ashley utilize Firm or Strict policies, indicating a market where hosts prioritize booking security.
Recommendations for Hosts
- Consider adopting a Firm policy to align with the 46.2% market standard in Ashley.
- With 30.8% using Strict terms, this is a viable option in Ashley, particularly for high-value properties or during peak demand periods.
- Regularly review your cancellation policy against competitors and market demand shifts in Ashley.
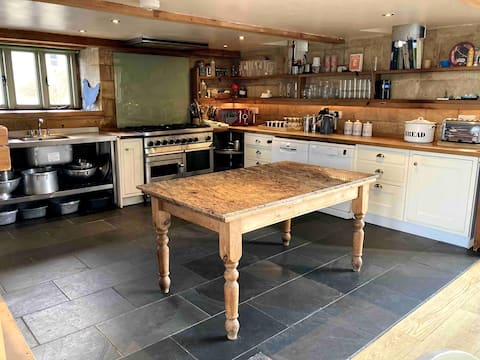
What Do the Top Airbnb Listings in Ashley Look Like?
Benchmark your potential! Explore examples of top-performing Airbnb properties in Ashleybased on Trailing Twelve Month (TTM) revenue. Analyze their characteristics, revenue, occupancy rate, and ADR to understand what drives success in this market.
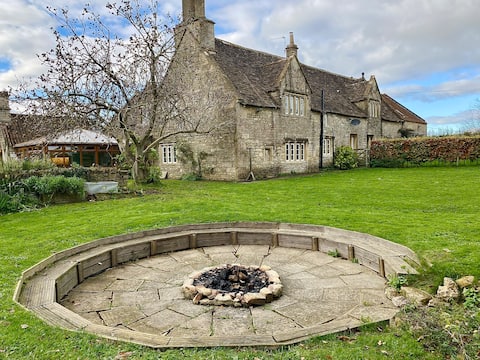
Hill House Farm - a cosy farmhouse (sleeps 15)
Entire Place • 5 bedrooms
The Barn and Apartment at Jamie's Farm (sleeps 9)
Entire Place • 2 bedrooms
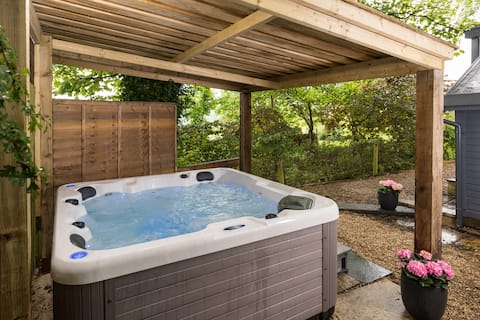
Mission Hall & The Vestry -Hot Tub
Entire Place • 5 bedrooms
Charming cottage getaway in Altrincham
Entire Place • 3 bedrooms
Birkin Farm - Spacious Farmhouse by Tatton Stays
Entire Place • 4 bedrooms

Bath Spa House, Perfect for a Family GetTogether
Entire Place • 6 bedrooms
Note: Performance varies based on location, size, amenities, seasonality, and management quality. Data reflects the past 12 months.
Who Are the Top Airbnb Hosts in Ashley?
Learn from the best! This table showcases top-performing Airbnb hosts in Ashley based on the number of properties managed and estimated total revenue over the past year. Analyze their scale and performance metrics.
| Host Name | Properties | Grossing Revenue | Stay Reviews | Avg Rating |
|---|---|---|---|---|
| Jamie'S Farm | 2 | $428,636 | 204 | 4.98/5.0 |
| The Large Holiday Rental Compa | 1 | $97,061 | 65 | 4.42/5.0 |
| Host #101718637 | 3 | $80,845 | 51 | 4.98/5.0 |
| Deb | 2 | $68,422 | 645 | 4.99/5.0 |
| Airready | 2 | $42,675 | 160 | 4.91/5.0 |
| Host #39735131 | 1 | $39,578 | 21 | 4.62/5.0 |
| Tatton Stays | 2 | $38,683 | 19 | 4.72/5.0 |
| Mark | 1 | $36,099 | 38 | 4.89/5.0 |
| Christabel | 1 | $27,356 | 231 | 4.99/5.0 |
| Ann | 1 | $22,894 | 16 | 5.00/5.0 |
Analyzing the strategies of top hosts, such as their property selection, pricing, and guest communication, can offer valuable lessons for optimizing your own Airbnb operations in Ashley.
How Does Ashley's Airbnb Market Compare to Nearby Cities?
How does the Ashley Airbnb market stack up against its neighbors? Compare key performance metrics like average monthly revenue, ADR, and occupancy rates in surrounding areas to understand the broader regional STR landscape.
Compared with Winsham, Ashley has 1 percentage points lower occupancy and about $179 lower ADR. That helps frame whether this market is winning more on demand, pricing, or both.
| Market | Active Properties | Monthly Revenue | Daily Rate | Avg. Occupancy |
|---|---|---|---|---|
| Englishcombe | 13 | $9,008 | $577.78 | 47% |
| Lambourn | 11 | $6,520 | $685.43 | 29% |
| Chew Magna | 14 | $6,511 | $396.91 | 46% |
| Long Sutton | 18 | $6,146 | $388.97 | 49% |
| Stoke St. Michael | 10 | $5,885 | $436.98 | 43% |
| Oldland Common | 13 | $5,483 | $364.10 | 45% |
| Winsham | 10 | $5,271 | $501.11 | 52% |
| Crai | 22 | $5,064 | $451.09 | 44% |
| Flore | 10 | $4,920 | $364.39 | 40% |
| Limpley Stoke | 10 | $4,790 | $513.89 | 51% |
Frequently Asked Questions About Airbnb in Ashley
These quick answers summarize the most common investor and operator questions using AirROI's latest market data for Ashley.
How much do Airbnb hosts make in Ashley?
Ashley hosts earn about $52,246 per year on average, with an average nightly rate of $322 and RevPAR of N/A. Those figures describe the typical revenue environment for active listings in Ashley, England, not the ceiling for the best operators. Source: AirROI 2025 data, Ashley market, March 2024 to February 2025.
What is the average Airbnb occupancy rate in Ashley?
The average Airbnb occupancy rate in Ashley is 50.6%. December is the strongest month and January is the softest, so hosts should expect demand to move meaningfully throughout the year rather than stay flat.
What is the average Airbnb daily rate in Ashley?
Listings in Ashley average $322 per night. The broader pricing spread also matters: lower-performing listings cluster closer to the lower quartiles, while premium homes can price materially above the city average when demand spikes or listing quality stands out.
How many Airbnb listings are active in Ashley?
Ashley currently has about 17 active Airbnb listings in AirROI's market dataset. That supply count helps explain how competitive the market is, how much depth there is for benchmarking, and whether the market behaves like a niche destination or a scaled urban market.
How strict are short-term rental regulations in Ashley?
AirROI currently classifies the short-term rental regulation level in Ashley as Low. The dataset also shows about 0.0% of listings with registration evidence. That is a market signal, not legal advice, so hosts should still confirm current licensing and compliance rules locally before listing.
What is the RevPAR for Airbnb in Ashley?
RevPAR in Ashley is about N/A. That metric combines pricing and occupancy into one efficiency number, so it is often a better quick benchmark than ADR alone when investors want to compare how well listings convert nightly rates into realized revenue.
Is Airbnb profitable in Ashley?
At 50.6% occupancy, Ashley can be profitable — but margins depend heavily on operating costs, property acquisition price, and how well hosts optimize pricing across seasons. Average annual revenue is $52,246, but individual returns depend on property type, location within the city, and the host's operating efficiency.
How far in advance do guests book Airbnb in Ashley?
The average booking lead time in Ashley is about 85 days — a longer planning horizon typical of destination or vacation markets where travelers book well in advance. Hosts who understand their market's booking cadence can adjust minimum stays and pricing windows accordingly.
What are the best neighborhoods for Airbnb in Ashley?
Based on AirROI's analysis, some of the top neighborhoods for short-term rentals in Ashley include Southampton, Bournemouth, Winchester. Each area attracts different guest profiles — from business travelers to leisure visitors — so the best location depends on the property type and target audience a host is aiming for. See the full neighborhood breakdown above.
What type of property performs best on Airbnb in Ashley?
entire_home listings make up 94.1% of the active supply in Ashley. The most common configuration does not always mean the most profitable — operators who identify underserved property types or bedroom counts can sometimes outperform the market average by filling a gap in local supply.
How does Ashley compare to nearby Airbnb markets?
Among neighboring markets, Englishcombe posts $108,093 in average annual revenue with 46.9% occupancy, compared to Ashley's $52,246 and 50.6%. Comparing nearby markets helps investors understand whether a destination's performance reflects local demand or broader regional trends.
When is the peak season for Airbnb in Ashley?
December is the highest-revenue month in Ashley, while January is the softest. The revenue spread between them indicates moderate seasonality with a clear peak period, giving hosts opportunities to maximize rates during high demand without facing dramatic off-season drops.
About AirROI Market Data
AirROI tracks over 20 million properties across 190+ countries and maintains 15+ years of historical performance data, making it one of the deepest Airbnb and STR intelligence platforms available. The analytics pipeline aggregates listing-level data monthly — revenue, occupancy, nightly rates, RevPAR, guest demographics, booking patterns, and competitive supply — so investors and operators can benchmark any market against its own history and against neighboring destinations.
Real estate investors, property managers, financial institutions, hedge funds, tourism boards, hospitality consultants, tech platforms, and academic researchers rely on AirROI data to underwrite acquisitions, optimize pricing, model macro trends, and conduct peer-reviewed research. Data is available through in-depth market reports like this one and the Airbnb API with 22 endpoints and an Airbnb MCP Server for AI agents.
AirROI proprietary analytics as of 2025-02-28. Metrics reflect trailing twelve-month aggregates from active listings. Revenue figures are market averages, not projections. Neighborhood descriptions are AI-generated and reviewed for accuracy. For full methodology, see the data methodology page.