AirROI ranking · 2026298 markets ranked
Best Places to Buy an Airbnb in England, UK (2026)
Cotswold District is the best place to buy an Airbnb in England in 2026, according to AirROI's ranking of 298 markets. Its listings averaged £42,100 in revenue over the 12 months to October 2026 and were booked on 45% of nights. It leads on the blend rather than on any one measure, placing in the top 5% of ranked markets for revenue per listing and market size and the top 20% for occupancy. West Oxfordshire and Bath come next.
- Markets tracked
- 1,130
- Active Airbnb listings
- 194,000
- Avg. revenue per listing
- £21,000
- Occupancy rate
- 41%
- Avg. nightly rate
- £195
- Revenue change, typical market
- +9%
The short answer
England Airbnb Market at a Glance
Across England, the 194,000 active Airbnb listings tracked by AirROI, a short-term-rental data firm, averaged £21,000 over the same period. They were booked on 41% of nights at about £195 a night; the ranking covers the 298 markets with at least 100 active listings. Revenue per listing rose in 213 of the 246 ranked markets with a comparable year of data, by 9% in the typical one.
The ranking weighs revenue per listing most, then occupancy and market size, then how evenly income spreads across the year and how it changed on the year. It reflects rental performance, not purchase prices or local short-term rental rules. How the ranking works.
Where the top 10 Airbnb markets in England are
Each dot is one of the 1,130 markets AirROI tracks in England (5 outlying ones fall outside the map), sized by active listings and coloured by average revenue per listing. Select a number to jump to its profile.
Money figures on this page are in British pounds, converted from US dollars at £0.74 per US$, the typical rate from November 2025 to October 2026.
Top 10
The Top 10 Airbnb Markets in England
Each profile draws on the market's full AirROI report: how it earns, when in the year, who books and what sells. Monthly figures are averages per listing active in that month, so twelve of them add up to more than the annual average, which also counts listings that operated for only part of the year.
| # | Market | Avg. revenue | Occupancy |
|---|---|---|---|
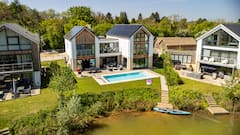 Cotswold District High earnings · Large market | £42,100 | 45% | |
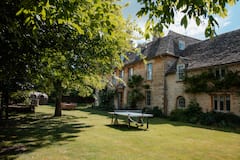 West Oxfordshire High earnings · High occupancy | £36,700 | 46% | |
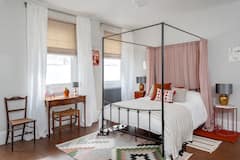 Bath High occupancy · High earnings | £34,800 | 50% | |
| 4 | 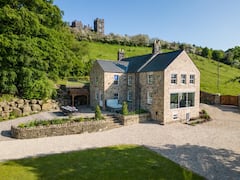 Derbyshire Dales High earnings · Large market | £32,100 | 46% |
| 5 |  City of Westminster High earnings · High occupancy | £54,500 | 48% |
| 6 | 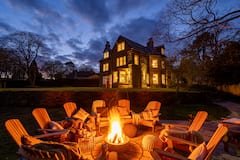 High Peak High occupancy · High earnings | £28,600 | 49% |
| 7 | 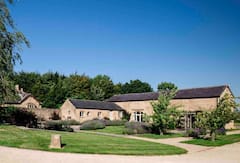 Stratford-on-Avon High occupancy · High earnings | £26,200 | 45% |
| 8 | 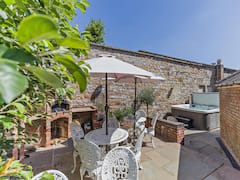 Staffordshire Moorlands High earnings · Growing revenue | £31,400 | 44% |
| 9 | 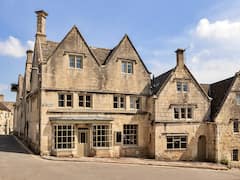 Stroud High earnings · High occupancy | £28,300 | 44% |
| 10 |  New Forest High earnings · Large market | £29,200 | 46% |
1. Cotswold District
Known for: High earnings · Large market
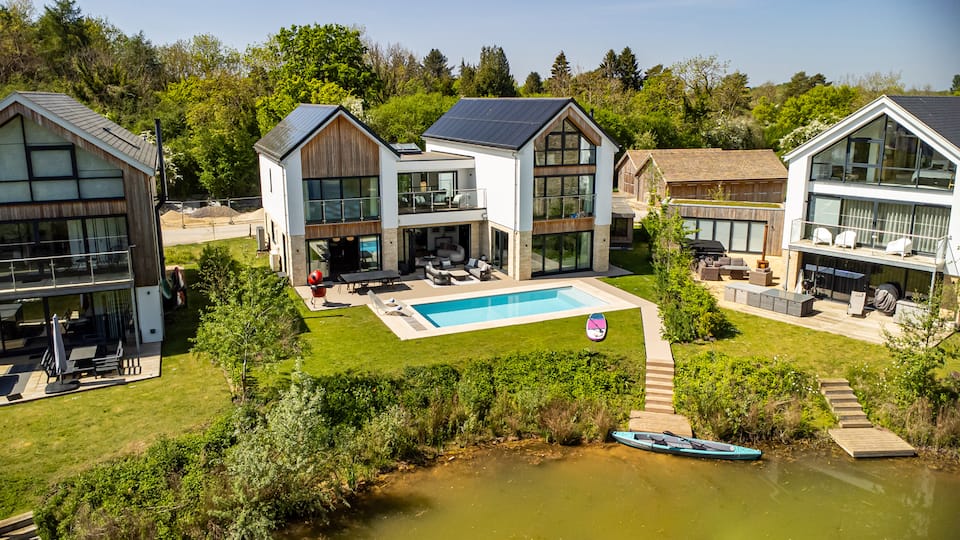


Top-earning Airbnb listings in Cotswold District - Avg. revenue
- £42,100 +15% vs. last year
- Occupancy
- 45%
- Nightly rate
- £320
- Active listings
- 1,700
Where it places among the 298 ranked markets in England
- Revenue Top 1%
- Occupancy Top 12%
- Market size Top 3%
- Year-round Top 50%
- Growth Top 20%
- How it earns
- Cotswold District commands premium rates, about £320 a night, and still books 45% of nights, 4 points above the England average. That adds up to £42,100 per listing over the year, the second-highest of the 298 ranked markets. A typical listing takes in about £3,180 a month; the top quarter clear £5,530 or more. Revenue per listing rose 15% over the year, helped by nightly rates 8% higher.
- When it earns
- Cotswold District's season runs from May to September, peaking in August at about £6,190 per listing; February, the quietest month, brings in about £2,960. Guests book early, about 79 days ahead against roughly 60 for the typical market in England, and stay about 4 nights.
- Who books
- About three in ten guests (30%) travel from abroad, most often from the United States and Australia.
- What sells
- The most common entire home has 2 bedrooms (28% of entire homes), and houses make up 73% of supply.
- Who it suits
- It suits buyers who can furnish and price for a premium stay.
Revenue per listing by month
£6,190 £2,960- Median listing
- £3,180/mo
- Top 25% of listings
- £5,530+/mo
- Booked ahead
- 79 days
- Average stay
- 4 nights
- Guests from abroad
- 30%
- Most common home size
- 2 bedrooms
Areas in the full report: Bourton-on-the-Water · Stow-on-the-Wold · Chipping Campden
Full Cotswold District Airbnb report2. West Oxfordshire
Known for: High earnings · High occupancy
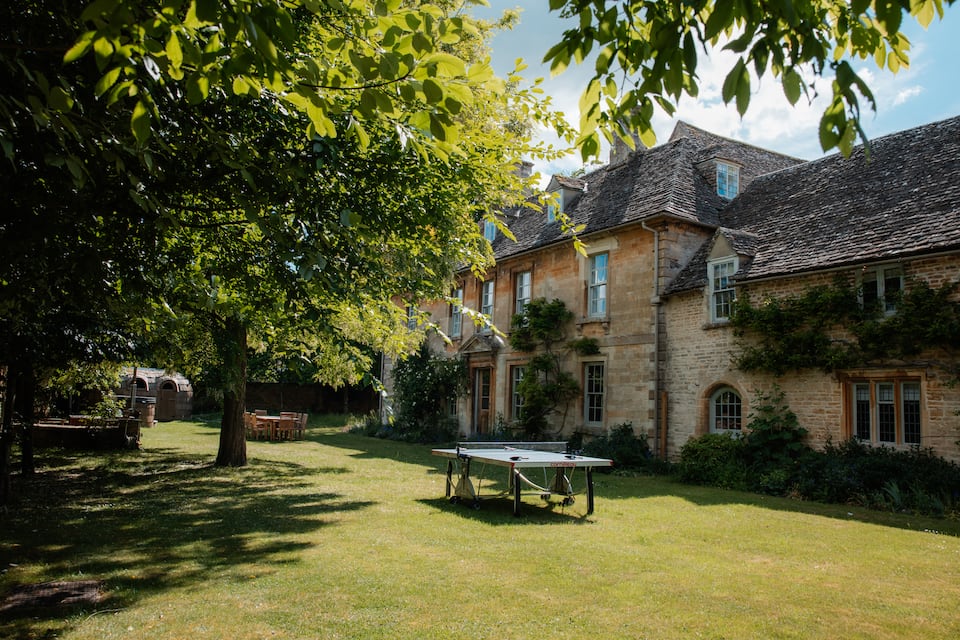
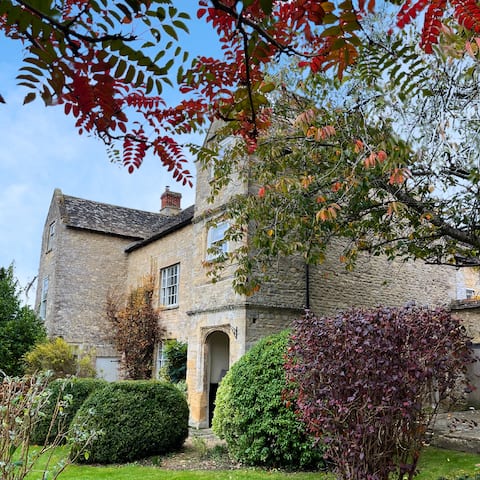
Top-earning Airbnb listings in West Oxfordshire - Avg. revenue
- £36,700 +17% vs. last year
- Occupancy
- 46%
- Nightly rate
- £300
- Active listings
- 708
Where it places among the 298 ranked markets in England
- Revenue Top 2%
- Occupancy Top 9%
- Market size Top 16%
- Year-round Top 36%
- Growth Top 14%
- How it earns
- West Oxfordshire earns on price and volume at once: guests pay about £300 a night, and listings are booked on 46% of nights, 5 points above the England average. Listings averaged £36,700 in revenue over the year, the fourth-highest of the 298 ranked markets. In a typical month the median listing brings in about £2,810, and the best quarter clear £4,530. Revenue per listing rose 17% over the year, helped by nightly rates 7% higher.
- When it earns
- Revenue in West Oxfordshire concentrates from May to September: August earns about £5,020 per listing, about twice as much as February. Stays are shorter than in most of England, about 3 nights, so listings turn over often; guests book about 70 days ahead.
- Who books
- Most guests are domestic (77%), and the United States and Australia send the most visitors from abroad.
- What sells
- One-bedroom homes lead the market (34% of entire homes), and houses make up 65% of supply.
- Who it suits
- Best for buyers who can furnish and price for a premium stay.
Revenue per listing by month
£5,020 £2,530- Median listing
- £2,810/mo
- Top 25% of listings
- £4,530+/mo
- Booked ahead
- 70 days
- Average stay
- 3 nights
- Most common home size
- 1 bedroom
- Superhosts
- 71%
Areas in the full report: Burford · Chipping Norton · Witney
Full West Oxfordshire Airbnb report3. Bath
Known for: High occupancy · High earnings
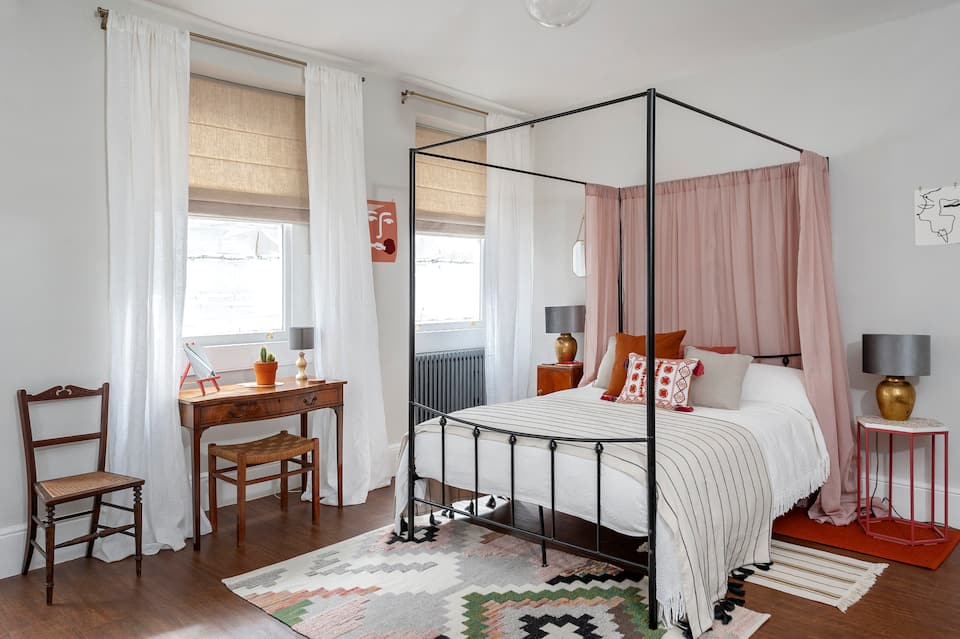

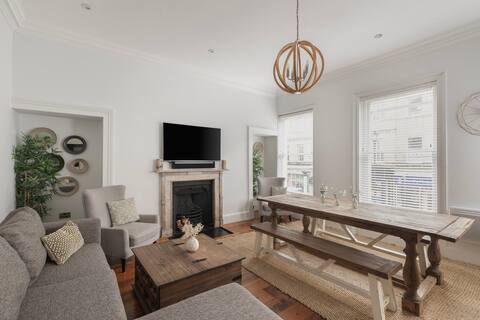
Top-earning Airbnb listings in Bath - Avg. revenue
- £34,800 +14% vs. last year
- Occupancy
- 50%
- Nightly rate
- £220
- Active listings
- 960
Where it places among the 298 ranked markets in England
- Revenue Top 2%
- Occupancy Top 1%
- Market size Top 11%
- Year-round Top 42%
- Growth Top 28%
- How it earns
- Bath fills more nights than most of England: 50% of them, the second-highest occupancy of the 298 ranked markets, at about £220 a night. Average revenue per listing came to £34,800, the fifth-highest of the 298 ranked markets. Month to month, the median listing earns about £2,830 and a top-quarter listing £4,440 or more. Revenue per listing rose 14% over the year, helped by nightly rates 4% higher.
- When it earns
- In Bath, the months from May to September earn above the yearly average, led by July at about £4,460 per listing; January is the low point at about £2,250. Visits are quick, about 3 nights on average against 5 nights for the typical market in England, booked about 68 days ahead. Most hosts take one- or two-night bookings (93% of listings), more than in the typical market.
- Who books
- About a third of guests (34%) travel from abroad, most often from the United States and Australia.
- What sells
- The most common entire home has 1 bedroom (37% of entire homes), and apartments and condos make up 52% of supply.
Revenue per listing by month
£4,460 £2,250- Median listing
- £2,830/mo
- Top 25% of listings
- £4,440+/mo
- Booked ahead
- 68 days
- Average stay
- 3 nights
- Guests from abroad
- 34%
- Most common home size
- 1 bedroom
Areas in the full report: Central Bath · Southgate · Lansdown
Full Bath Airbnb report4. Derbyshire Dales
Known for: High earnings · Large market
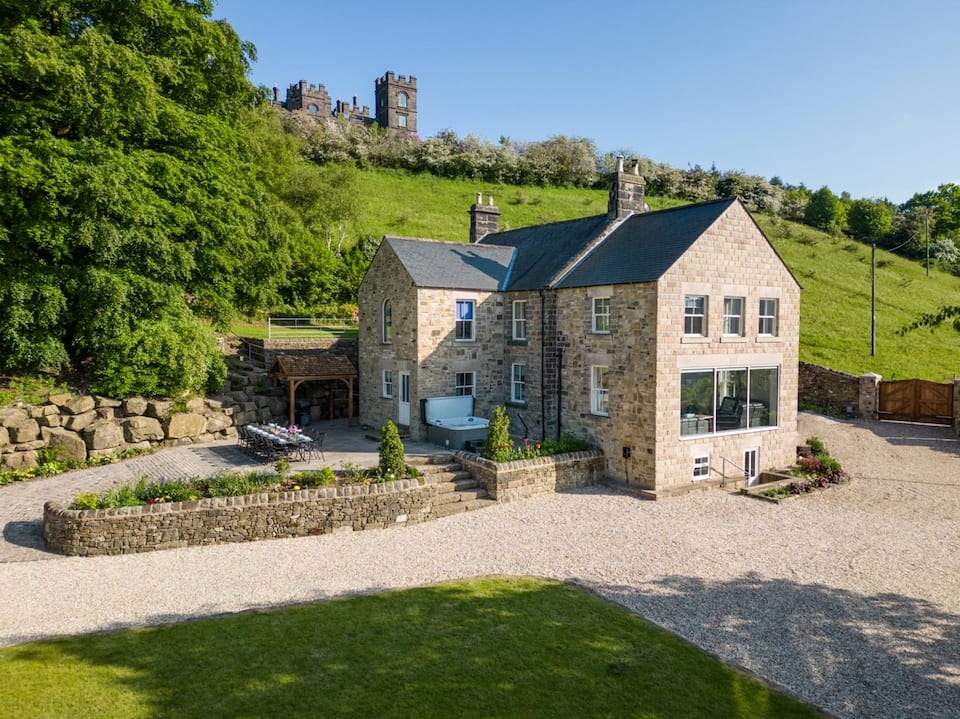

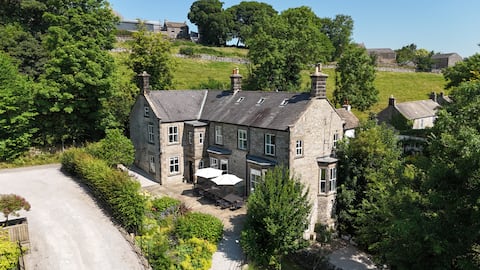
Top-earning Airbnb listings in Derbyshire Dales - Avg. revenue
- £32,100 +17% vs. last year
- Occupancy
- 46%
- Nightly rate
- £250
- Active listings
- 1,390
Where it places among the 298 ranked markets in England
- Revenue Top 4%
- Occupancy Top 7%
- Market size Top 5%
- Year-round Bottom 42%
- Growth Top 14%
- How it earns
- Listings in Derbyshire Dales are booked on 46% of nights, 5 points above the England average, at about £250 a night. That adds up to £32,100 per listing over the year, the tenth-highest of the 298 ranked markets. A typical listing takes in about £2,440 a month; the top quarter clear £3,750 or more. Revenue per listing rose 17% over the year, helped by nightly rates 10% higher.
- When it earns
- Derbyshire Dales' season runs from April to October, peaking in August at about £4,410 per listing; January, the quietest month, brings in about £1,990.
- Guest expectations
- Guests rate listings highly, 4.88 stars on average against 4.82 for the typical market in England, so reviews set a high bar.
- What sells
- Two-bedroom homes lead the market (35% of entire homes), and houses make up 75% of supply.
Revenue per listing by month
£4,410 £1,990- Median listing
- £2,440/mo
- Top 25% of listings
- £3,750+/mo
- Booked ahead
- 72 days
- Average stay
- 4 nights
- Most common home size
- 2 bedrooms
- Superhosts
- 59%
Areas in the full report: Bakewell · Matlock Bath · Ashbourne
Full Derbyshire Dales Airbnb report5. City of Westminster
Known for: High earnings · High occupancy
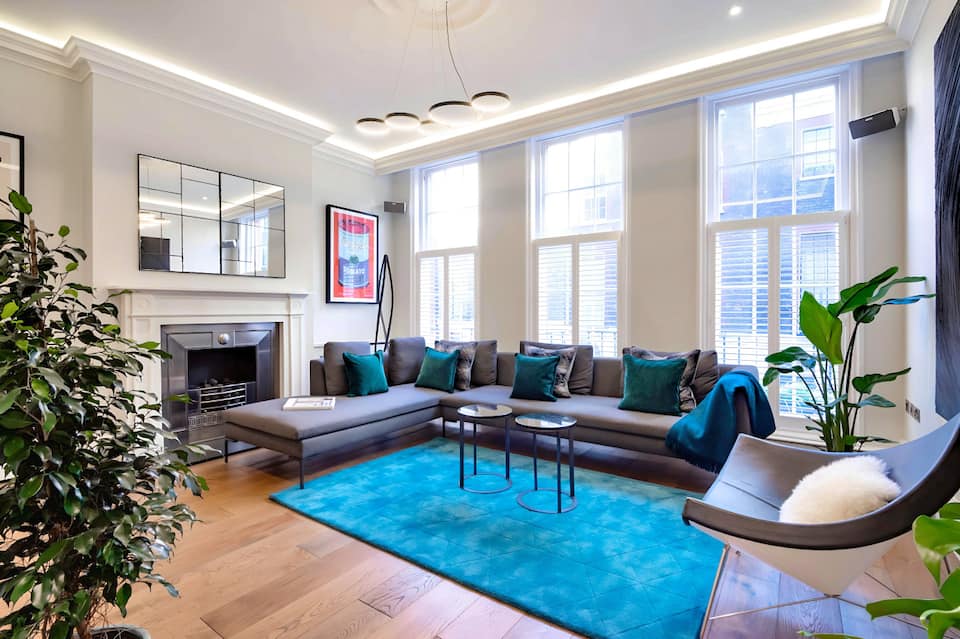
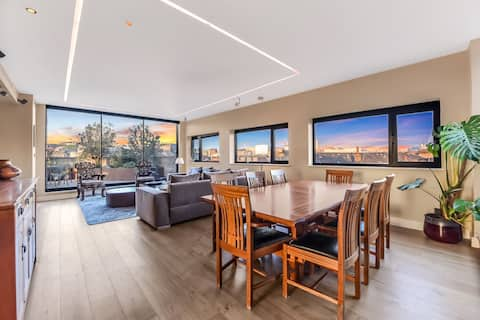

Top-earning Airbnb listings in City of Westminster - Avg. revenue
- £54,500 +4% vs. last year
- Occupancy
- 48%
- Nightly rate
- £410
- Active listings
- 1,150
Where it places among the 298 ranked markets in England
- Revenue Top 1%
- Occupancy Top 4%
- Market size Top 7%
- Year-round Top 32%
- Growth Bottom 26%
- How it earns
- Rates in City of Westminster run about £410 a night, about 2.1 times the England average, yet listings still fill 48% of nights. Listings averaged £54,500 in revenue over the year, the highest of the 298 ranked markets. In a typical month the median listing brings in about £5,160, and the best quarter clear £8,900.
- When it earns
- Revenue in City of Westminster concentrates from May to October: July earns about £8,960 per listing, about twice as much as January.
- Who books
- Most guests come from abroad (82%), led by visitors from the United States, France and Australia.
- Guest expectations
- Average ratings (4.70 stars) trail the typical market in England (4.82), which leaves room for a well-run listing to stand out.
- Who it suits
- A good fit for buyers who can furnish and price for a premium stay and prefer a smaller one- or two-bedroom place.
Revenue per listing by month
£8,960 £4,640- Median listing
- £5,160/mo
- Top 25% of listings
- £8,900+/mo
- Booked ahead
- 64 days
- Average stay
- 5 nights
- Guests from abroad
- 82%
- Most common home size
- 1 bedroom
Areas in the full report: Covent Garden · Soho · Mayfair
Full City of Westminster Airbnb report6. High Peak
Known for: High occupancy · High earnings
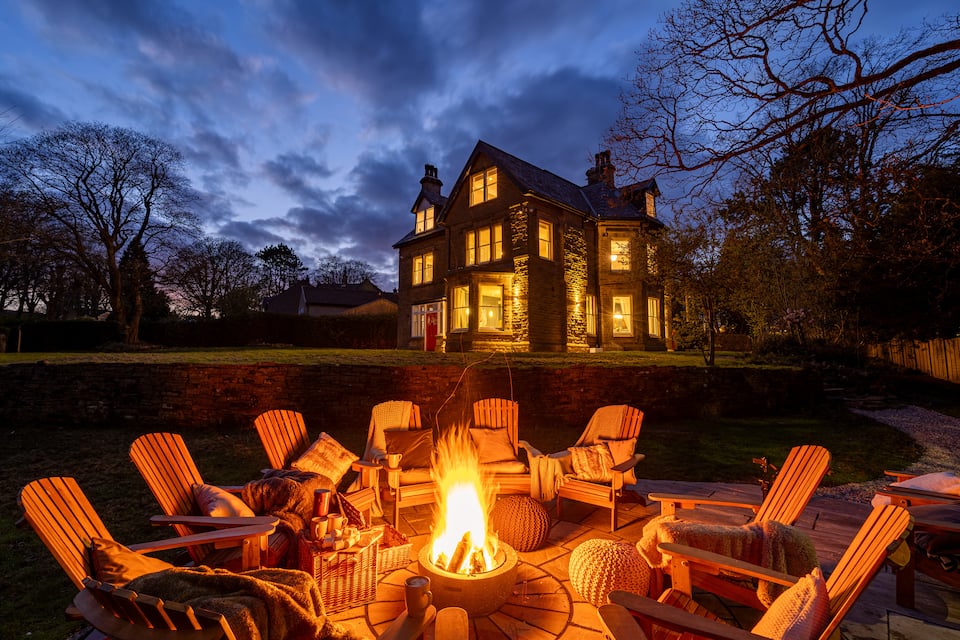
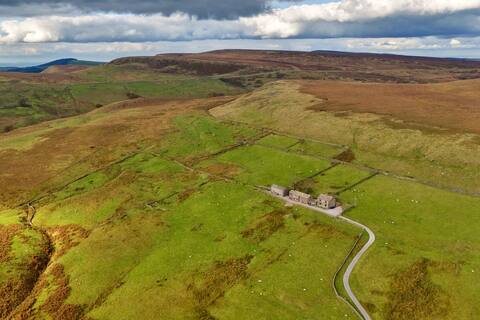
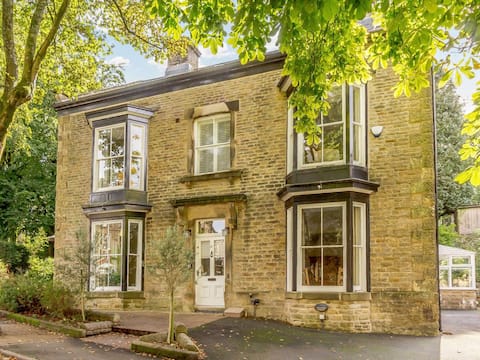
Top-earning Airbnb listings in High Peak - Avg. revenue
- £28,600 +14% vs. last year
- Occupancy
- 49%
- Nightly rate
- £195
- Active listings
- 562
Where it places among the 298 ranked markets in England
- Revenue Top 7%
- Occupancy Top 2%
- Market size Top 20%
- Year-round Top 32%
- Growth Top 24%
- How it earns
- Demand runs high in High Peak: 49% of nights booked, the fifth-highest occupancy of the 298 ranked markets, at about £195 a night. Average revenue per listing came to £28,600, 36% above the England average. Month to month, the median listing earns about £2,270 and a top-quarter listing £3,640 or more. Revenue per listing rose 14% over the year, helped by nightly rates 12% higher.
- When it earns
- In High Peak, the months from April to September earn above the yearly average, led by August at about £3,840 per listing; January is the low point at about £2,000.
- Guest expectations
- Guests rate listings highly, 4.88 stars on average against 4.82 for the typical market in England, so reviews set a high bar.
- What sells
- The most common entire home has 2 bedrooms (38% of entire homes), and houses make up 62% of supply.
Revenue per listing by month
£3,840 £2,000- Median listing
- £2,270/mo
- Top 25% of listings
- £3,640+/mo
- Booked ahead
- 69 days
- Average stay
- 4 nights
- Most common home size
- 2 bedrooms
- Superhosts
- 61%
Areas in the full report: Buxton · Castleton · Hope Valley
Full High Peak Airbnb report7. Stratford-on-Avon
Known for: High occupancy · High earnings
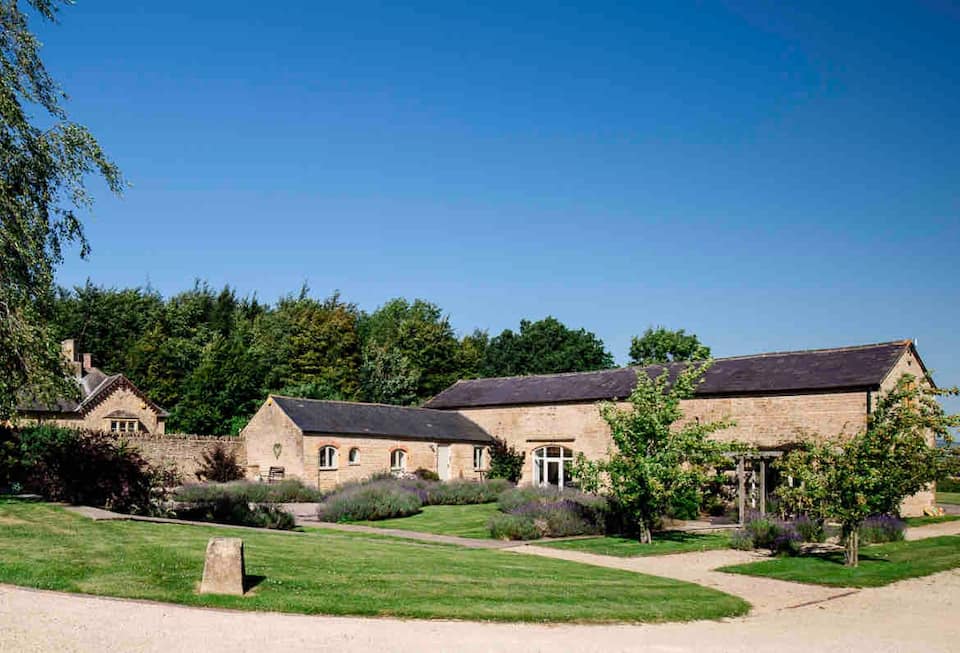
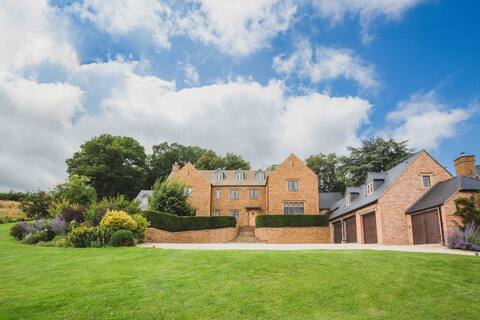

Top-earning Airbnb listings in Stratford-on-Avon - Avg. revenue
- £26,200 +14% vs. last year
- Occupancy
- 45%
- Nightly rate
- £200
- Active listings
- 692
Where it places among the 298 ranked markets in England
- Revenue Top 12%
- Occupancy Top 11%
- Market size Top 16%
- Year-round Top 26%
- Growth Top 26%
- How it earns
- Stratford-on-Avon books 45% of available nights, 4 points above the England average, and charges about £200 a night. That adds up to £26,200 per listing over the year, 25% above the England average. A typical listing takes in about £2,100 a month; the top quarter clear £3,400 or more. Revenue per listing rose 14% over the year, helped by nightly rates 7% higher.
- When it earns
- Stratford-on-Avon's season runs from May to September, peaking in August at about £3,480 per listing; January, the quietest month, brings in about £1,880.
- What sells
- Two-bedroom homes lead the market (38% of entire homes), and houses make up 54% of supply.
Revenue per listing by month
£3,480 £1,880- Median listing
- £2,100/mo
- Top 25% of listings
- £3,400+/mo
- Booked ahead
- 70 days
- Average stay
- 4 nights
- Most common home size
- 2 bedrooms
- Superhosts
- 66%
Areas in the full report: Shakespeare's Birthplace · Royal Shakespeare Theatre · Anne Hathaway's Cottage
Full Stratford-on-Avon Airbnb report8. Staffordshire Moorlands
Known for: High earnings · Growing revenue
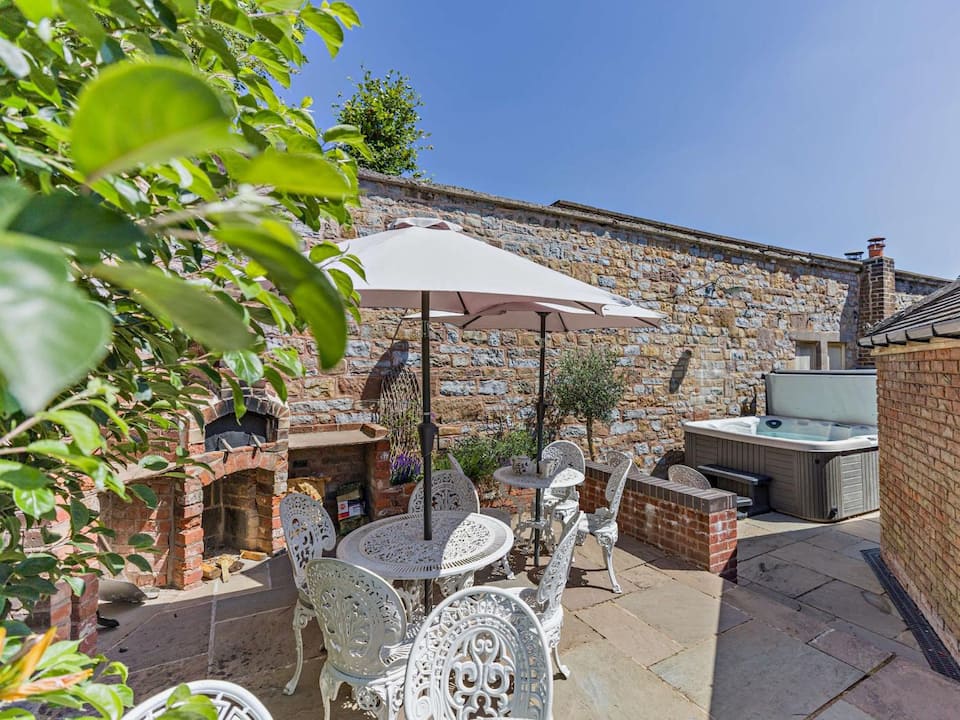
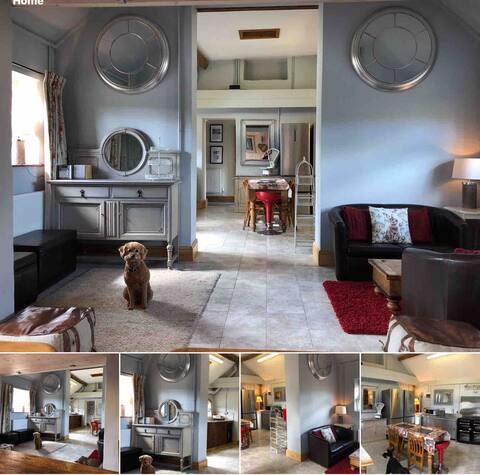
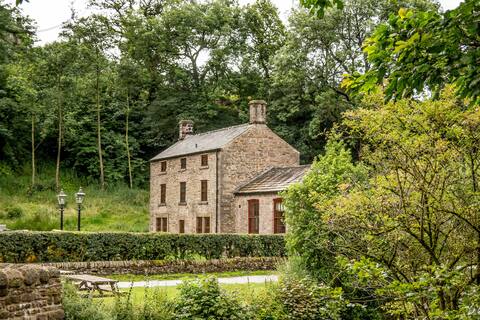
Top-earning Airbnb listings in Staffordshire Moorlands - Avg. revenue
- £31,400 +17% vs. last year
- Occupancy
- 44%
- Nightly rate
- £240
- Active listings
- 514
Where it places among the 298 ranked markets in England
- Revenue Top 4%
- Occupancy Top 17%
- Market size Top 22%
- Year-round Top 45%
- Growth Top 15%
- How it earns
- Staffordshire Moorlands fills more nights than most of England: 44% of them, 3 points above the England average, at about £240 a night. Listings averaged £31,400 in revenue over the year, 50% above the England average. In a typical month the median listing brings in about £2,330, and the best quarter clear £4,040. Revenue per listing rose 17% over the year, helped by nightly rates 7% higher.
- When it earns
- Revenue in Staffordshire Moorlands concentrates from April to October: August earns about £4,450 per listing, about twice as much as January. Stays are shorter than in most of England, about 3 nights, so listings turn over often; guests book about 69 days ahead.
- Guest expectations
- Guests rate listings highly, 4.89 stars on average against 4.82 for the typical market in England, so reviews set a high bar.
- Who books
- Guests are overwhelmingly domestic (93%); the most common home cities are England, London and Manchester.
Revenue per listing by month
£4,450 £2,160- Median listing
- £2,330/mo
- Top 25% of listings
- £4,040+/mo
- Booked ahead
- 69 days
- Average stay
- 3 nights
- Most common home size
- 1 bedroom
- Superhosts
- 55%
Areas in the full report: Leek · Buxworth · Whaley Bridge
Full Staffordshire Moorlands Airbnb report9. Stroud
Known for: High earnings · High occupancy
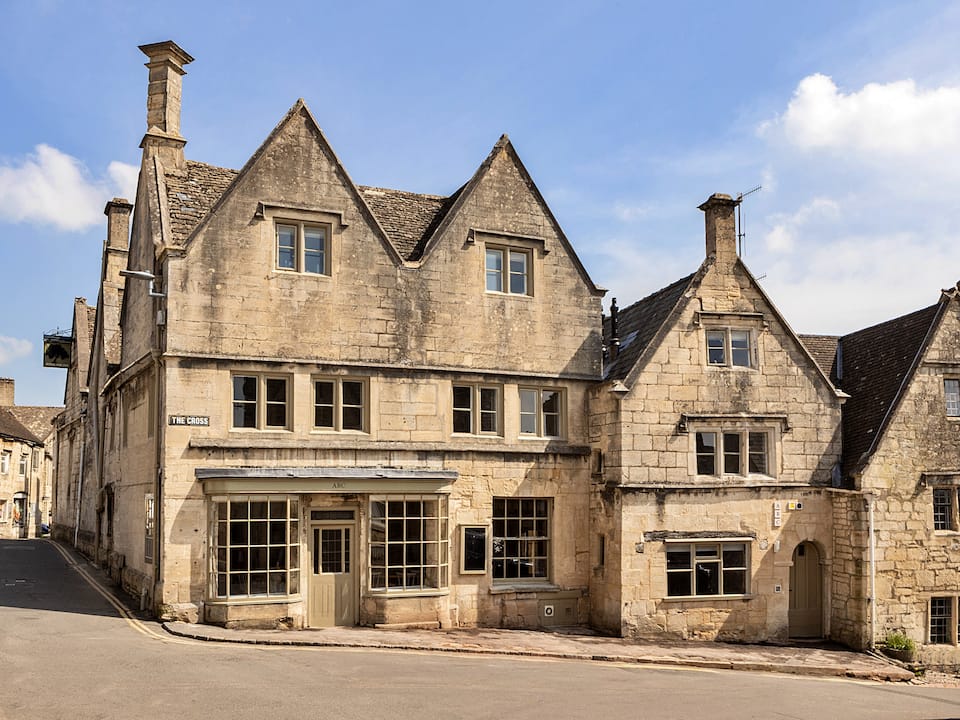
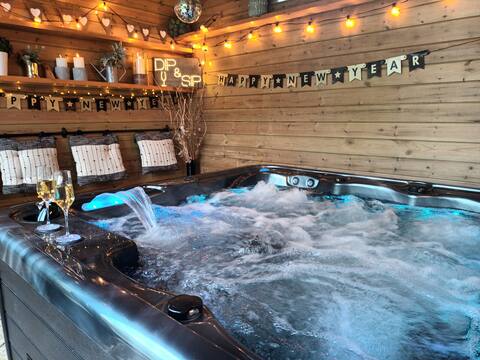

Top-earning Airbnb listings in Stroud - Avg. revenue
- £28,300 +14% vs. last year
- Occupancy
- 44%
- Nightly rate
- £215
- Active listings
- 588
Where it places among the 298 ranked markets in England
- Revenue Top 8%
- Occupancy Top 15%
- Market size Top 18%
- Year-round Top 36%
- Growth Top 27%
- How it earns
- Listings in Stroud are booked on 44% of nights, 3 points above the England average, at about £215 a night. Average revenue per listing came to £28,300, 35% above the England average. Month to month, the median listing earns about £2,020 and a top-quarter listing £3,400 or more. Revenue per listing rose 14% over the year, helped by nightly rates 8% higher.
- When it earns
- In Stroud, the months from May to September earn above the yearly average, led by August at about £3,950 per listing; January is the low point at about £2,010.
- Who books
- Most guests are domestic (78%), and the United States and Australia send the most visitors from abroad.
- What sells
- The most common entire home has 1 bedroom (41% of entire homes), and houses make up 57% of supply.
Revenue per listing by month
£3,950 £2,010- Median listing
- £2,020/mo
- Top 25% of listings
- £3,400+/mo
- Booked ahead
- 66 days
- Average stay
- 4 nights
- Most common home size
- 1 bedroom
- Superhosts
- 62%
Areas in the full report: Stroud Town Centre · Woodchester · Painswick
Full Stroud Airbnb report10. New Forest
Known for: High earnings · Large market
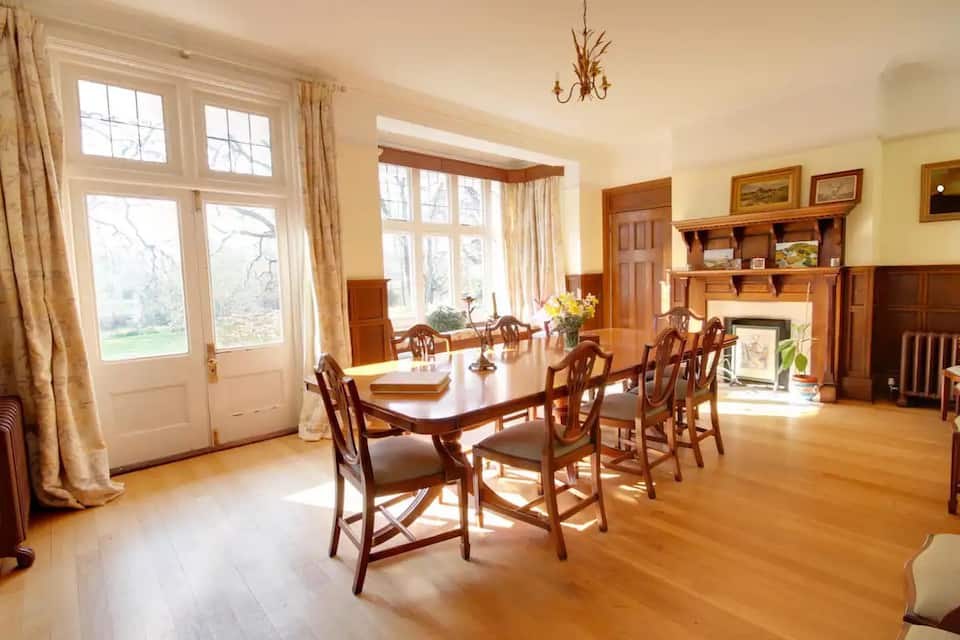
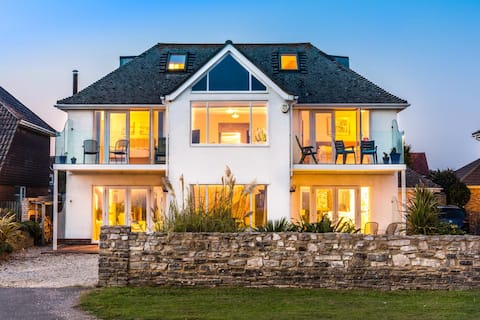
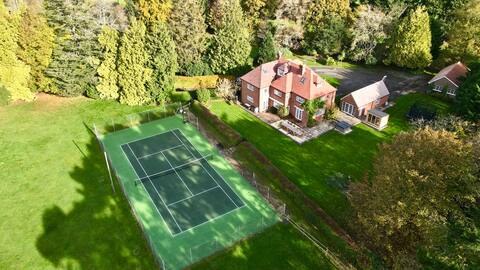
Top-earning Airbnb listings in New Forest - Avg. revenue
- £29,200 +11% vs. last year
- Occupancy
- 46%
- Nightly rate
- £220
- Active listings
- 1,070
Where it places among the 298 ranked markets in England
- Revenue Top 6%
- Occupancy Top 9%
- Market size Top 9%
- Year-round Bottom 34%
- Growth Top 40%
- How it earns
- Demand runs high in New Forest: 46% of nights booked, 5 points above the England average, at about £220 a night. That adds up to £29,200 per listing over the year, 39% above the England average. A typical listing takes in about £2,460 a month; the top quarter clear £3,870 or more. Revenue per listing rose 11% over the year, helped by nightly rates 8% higher.
- When it earns
- New Forest's season runs from April to September, peaking in August at about £4,870 per listing; February, the quietest month, brings in about £2,000.
- Guest expectations
- Guests rate listings highly, 4.88 stars on average against 4.82 for the typical market in England, so reviews set a high bar.
- Who books
- Guests are overwhelmingly domestic (91%); the most common home cities are England, London and Bristol.
Revenue per listing by month
£4,870 £2,000- Median listing
- £2,460/mo
- Top 25% of listings
- £3,870+/mo
- Booked ahead
- 68 days
- Average stay
- 4 nights
- Most common home size
- 1 bedroom
- Superhosts
- 63%
Areas in the full report: Lyndhurst · Brockenhurst · Beaulieu
Full New Forest Airbnb report
Full ranking
How the Top 100 Markets in England Compare
The overall ranking with the five measures behind it. "Slow month" is a market's weakest month of revenue as a share of its best, so a higher figure means steadier income. Select a column heading to re-sort.
| Cotswold District High earnings, large market | £42,148 | 45% | £322 | 48% | +15% | 1,701 | |
| West Oxfordshire High earnings, high occupancy | £36,683 | 46% | £298 | 51% | +17% | 708 | |
| Bath High occupancy, high earnings | £34,765 | 50% | £218 | 50% | +14% | 960 | |
| 4 | Derbyshire Dales High earnings, large market | £32,104 | 46% | £249 | 45% | +17% | 1,388 |
| 5 | City of Westminster High earnings, high occupancy | £54,517 | 48% | £409 | 52% | +4% | 1,145 |
| 6 | High Peak High occupancy, high earnings | £28,647 | 49% | £194 | 52% | +14% | 562 |
| 7 | Stratford-on-Avon High occupancy, high earnings | £26,183 | 45% | £199 | 54% | +14% | 692 |
| 8 | Staffordshire Moorlands High earnings, growing revenue | £31,441 | 44% | £239 | 49% | +17% | 514 |
| 9 | Stroud High earnings, high occupancy | £28,297 | 44% | £213 | 51% | +14% | 588 |
| 10 | New Forest High earnings, large market | £29,204 | 46% | £221 | 41% | +11% | 1,068 |
| 11 | Wychavon High earnings, growing revenue | £27,674 | 43% | £230 | 55% | +16% | 403 |
| 12 | Forest of Dean High occupancy, high earnings | £27,204 | 46% | £209 | 49% | +13% | 508 |
| 13 | South Derbyshire High occupancy, high earnings | £30,199 | 49% | £200 | 60% | +21% | 125 |
| 14 | Cherwell District High earnings, growing revenue | £26,796 | 41% | £213 | 56% | +16% | 444 |
| 15 | Guildford Growing revenue, high occupancy | £23,895 | 45% | £178 | 60% | +20% | 203 |
| 16 | Windermere High earnings, high occupancy | £34,747 | 44% | £265 | 38% | +17% | 352 |
| 17 | Wealden High earnings, large market | £28,397 | 42% | £226 | 50% | +10% | 591 |
| 18 | York Large market, high occupancy | £25,281 | 44% | £190 | 47% | +5% | 1,551 |
| 19 | Tewkesbury High earnings, high occupancy | £27,075 | 43% | £217 | 53% | +12% | 347 |
| 20 | Uttlesford High earnings, high occupancy | £26,402 | 45% | £192 | 56% | +14% | 202 |
| 21 | Ambleside Growing revenue, high earnings | £33,606 | 43% | £276 | 37% | +26% | 358 |
| 22 | Ribble Valley High earnings, year-round demand | £26,633 | 42% | £209 | 56% | +11% | 306 |
| 23 | London Large market, high earnings | £22,899 | 43% | £202 | 51% | +8% | 28,045 |
| 24 | Keswick High earnings, high occupancy | £32,556 | 44% | £304 | 38% | +8% | 460 |
| 25 | North East Derbyshire High earnings, growing revenue | £29,036 | 44% | £222 | 49% | +20% | 189 |
| 26 | Bath and North East Somerset High occupancy, high earnings | £28,518 | 50% | £204 | 40% | – | 289 |
| 27 | Malvern Hills High earnings, high occupancy | £23,830 | 43% | £185 | 52% | +9% | 399 |
| 28 | Calderdale Growing revenue, year-round demand | £21,339 | 43% | £166 | 57% | +23% | 409 |
| 29 | Bowness-on-Windermere High earnings, high occupancy | £37,389 | 44% | £299 | 40% | +3% | 390 |
| 30 | Amber Valley High earnings, high occupancy | £28,757 | 46% | £235 | 47% | +15% | 173 |
| 31 | Winchester High occupancy, high earnings | £25,012 | 44% | £219 | 49% | +6% | 395 |
| 32 | Chester High occupancy, high earnings | £23,592 | 45% | £169 | 51% | +4% | 454 |
| 33 | Harborough High occupancy, year-round demand | £23,553 | 45% | £166 | 59% | +13% | 165 |
| 34 | Gloucestershire Large market, high occupancy | £23,120 | 43% | £211 | 48% | – | 574 |
| 35 | Horsham High earnings, high occupancy | £24,639 | 42% | £205 | 51% | +8% | 331 |
| 36 | Northumberland High occupancy, high earnings | £24,606 | 45% | £205 | 37% | – | 450 |
| 37 | North Norfolk Large market, high earnings | £25,858 | 40% | £246 | 36% | +9% | 2,096 |
| 38 | Swanage High earnings, growing revenue | £27,781 | 42% | £244 | 28% | +18% | 311 |
| 39 | Rother High earnings, large market | £27,443 | 40% | £235 | 39% | +9% | 827 |
| 40 | Harrogate High earnings, high occupancy | £23,682 | 42% | £183 | 51% | +7% | 342 |
| 41 | Canterbury Large market, high earnings | £23,359 | 42% | £191 | 40% | +8% | 947 |
| 42 | Lewes High occupancy, high earnings | £22,818 | 43% | £182 | 47% | +9% | 426 |
| 43 | Bradford Growing revenue, high occupancy | £19,227 | 43% | £145 | 55% | +22% | 472 |
| 44 | Windsor High earnings, growing revenue | £27,487 | 42% | £208 | 40% | +14% | 270 |
| 45 | Folkestone and Hythe District Growing revenue, high earnings | £24,175 | 39% | £230 | 40% | +23% | 467 |
| 46 | Tunbridge Wells High earnings, high occupancy | £23,423 | 42% | £214 | 49% | +12% | 291 |
| 47 | Falmouth High occupancy, high earnings | £23,246 | 46% | £183 | 29% | +9% | 401 |
| 48 | Alnwick High occupancy, high earnings | £28,930 | 49% | £189 | 32% | +13% | 149 |
| 49 | Chichester Large market, high earnings | £26,547 | 37% | £267 | 39% | +11% | 1,331 |
| 50 | Kendal High occupancy, high earnings | £24,909 | 46% | £169 | 40% | +9% | 195 |
| 51 | Thanet Large market, growing revenue | £23,955 | 39% | £198 | 31% | +17% | 967 |
| 52 | South Kesteven Growing revenue, high earnings | £23,189 | 40% | £202 | 52% | +17% | 287 |
| 53 | South Cambridgeshire High occupancy, year-round demand | £20,903 | 44% | £145 | 52% | +12% | 333 |
| 54 | Amble High occupancy, high earnings | £25,991 | 48% | £178 | 28% | +13% | 173 |
| 55 | East Hampshire High earnings, high occupancy | £23,196 | 42% | £212 | 51% | +6% | 270 |
| 56 | South Oxfordshire Large market, high earnings | £22,848 | 41% | £197 | 44% | +11% | 479 |
| 57 | West Lancashire Year-round demand, growing revenue | £22,332 | 44% | £175 | 63% | +16% | 108 |
| 58 | Penzance High occupancy, large market | £21,823 | 46% | £167 | 24% | +13% | 476 |
| 59 | Frome High occupancy, growing revenue | £22,863 | 49% | £159 | 44% | +16% | 144 |
| 60 | Newquay Large market, growing revenue | £22,748 | 41% | £224 | 23% | +14% | 917 |
| 61 | Gloucester High occupancy, year-round demand | £21,987 | 46% | £150 | 63% | +4% | 142 |
| 62 | North Hertfordshire Growing revenue, high occupancy | £20,754 | 47% | £129 | 62% | +25% | 106 |
| 63 | Hampshire Large market, high earnings | £21,408 | 41% | £223 | 48% | – | 474 |
| 64 | Cheltenham Large market, year-round demand | £20,755 | 40% | £193 | 56% | +7% | 620 |
| 65 | Oxford High occupancy, large market | £19,760 | 46% | £146 | 45% | +1% | 1,036 |
| 66 | Kirklees Growing revenue, year-round demand | £18,823 | 41% | £156 | 57% | +22% | 377 |
| 67 | Bristol Large market, high occupancy | £17,705 | 44% | £140 | 56% | 0% | 1,603 |
| 68 | Exeter High occupancy, growing revenue | £17,352 | 49% | £117 | 53% | +15% | 356 |
| 69 | Seahouses High earnings, high occupancy | £30,433 | 44% | £257 | 29% | +12% | 142 |
| 70 | King's Lynn and West Norfolk Large market, high earnings | £24,245 | 38% | £230 | 39% | +5% | 1,073 |
| 71 | Arun Large market, high earnings | £23,071 | 41% | £206 | 37% | +8% | 528 |
| 72 | Borough of Wyre Growing revenue, year-round demand | £21,872 | 40% | £207 | 55% | +15% | 202 |
| 73 | Brighton Large market, high earnings | £21,586 | 41% | £183 | 39% | +6% | 1,441 |
| 74 | Oxfordshire Large market, high occupancy | £21,057 | 42% | £211 | 41% | – | 497 |
| 75 | Shrewsbury High occupancy, growing revenue | £20,031 | 45% | £148 | 49% | +16% | 227 |
| 76 | Newark and Sherwood Year-round demand, growing revenue | £21,158 | 39% | £158 | 58% | +13% | 279 |
| 77 | Lincoln High occupancy, growing revenue | £18,539 | 47% | £123 | 51% | +16% | 232 |
| 78 | Lyme Regis High earnings, growing revenue | £25,900 | 40% | £251 | 31% | +12% | 260 |
| 79 | Braintree High earnings, year-round demand | £25,725 | 37% | £216 | 56% | +13% | 170 |
| 80 | Sevenoaks Year-round demand, high earnings | £25,564 | 40% | £214 | 62% | −2% | 158 |
| 81 | Bude Growing revenue, high occupancy | £25,389 | 44% | £226 | 22% | +19% | 133 |
| 82 | St. Ives Large market, high earnings | £24,630 | 39% | £253 | 23% | +6% | 978 |
| 83 | Ludlow High occupancy, high earnings | £22,427 | 48% | £151 | 49% | +12% | 105 |
| 84 | South Hams Large market, growing revenue | £21,998 | 38% | £226 | 28% | +13% | 1,755 |
| 85 | Derbyshire High occupancy, high earnings | £21,705 | 42% | £247 | 45% | – | 309 |
| 86 | North Yorkshire Large market, high earnings | £21,198 | 39% | £224 | 43% | – | 850 |
| 87 | Wiltshire High occupancy, year-round demand | £19,813 | 45% | £182 | 54% | – | 200 |
| 88 | Ventnor Growing revenue, high earnings | £23,976 | 42% | £209 | 22% | +18% | 223 |
| 89 | North Devon Large market, high earnings | £23,132 | 37% | £237 | 33% | +7% | 1,883 |
| 90 | Breckland District High earnings, large market | £22,611 | 39% | £202 | 47% | +11% | 374 |
| 91 | Waverley High earnings, high occupancy | £21,336 | 41% | £189 | 48% | +11% | 265 |
| 92 | Mid Sussex Year-round demand, high occupancy | £20,564 | 42% | £169 | 56% | +6% | 247 |
| 93 | East Devon Large market, growing revenue | £20,362 | 40% | £200 | 36% | +15% | 1,113 |
| 94 | Hove Growing revenue, high occupancy | £20,043 | 43% | £176 | 40% | +19% | 276 |
| 95 | Cambridge High occupancy, large market | £17,540 | 46% | £130 | 49% | +4% | 730 |
| 96 | Padstow High earnings | £27,861 | 39% | £278 | 30% | +9% | 267 |
| 97 | Borough of Pendle High occupancy, high earnings | £23,122 | 43% | £176 | 50% | +13% | 103 |
| 98 | Devon Large market | £20,935 | 41% | £221 | 36% | – | 790 |
| 99 | Teignbridge Large market, growing revenue | £19,689 | 41% | £173 | 39% | +14% | 766 |
| 100 | Brighton and Hove Large market, high occupancy | £19,006 | 42% | £179 | 41% | – | 823 |
By measure
England Airbnb Markets Ranked by Revenue, Nightly Rate and Occupancy
The overall ranking balances five measures. These lists take one at a time, for buyers who care most about income, pricing power, bookings, a steady calendar, momentum or market size.
Highest-earning Airbnb markets in England
Average annual revenue per active listing over the past 12 months. Markets with at least 200 listings.
| # | Market | Revenue |
|---|---|---|
| City of Westminster #5 overall | £54,500 | |
| Cotswold District #1 overall | £42,100 | |
| Bowness-on-Windermere #29 overall | £37,400 | |
| 4 | West Oxfordshire #2 overall | £36,700 |
| 5 | Bath #3 overall | £34,800 |
| 6 | Windermere #16 overall | £34,700 |
| 7 | Ambleside #21 overall | £33,600 |
| 8 | Keswick #24 overall | £32,600 |
| 9 | Derbyshire Dales #4 overall | £32,100 |
| 10 | Staffordshire Moorlands #8 overall | £31,400 |
| 11 | New Forest #10 overall | £29,200 |
| 12 | High Peak #6 overall | £28,600 |
| 13 | Bath and North East Somerset #26 overall | £28,500 |
| 14 | Wealden #17 overall | £28,400 |
| 15 | Stroud #9 overall | £28,300 |
| 16 | Padstow #96 overall | £27,900 |
| 17 | Swanage #38 overall | £27,800 |
| 18 | Wychavon #11 overall | £27,700 |
| 19 | Windsor #44 overall | £27,500 |
| 20 | Rother #39 overall | £27,400 |
| 21 | Forest of Dean #12 overall | £27,200 |
| 22 | Tewkesbury #19 overall | £27,100 |
| 23 | Cherwell District #14 overall | £26,800 |
| 24 | Ribble Valley #22 overall | £26,600 |
| 25 | Chichester #49 overall | £26,500 |
Most expensive Airbnb markets in England by nightly rate
Average rate per booked night. A high rate earns most where occupancy holds up too. Markets with at least 200 listings.
| # | Market | Nightly |
|---|---|---|
| City of Westminster #5 overall | £410 | |
| Cotswold District #1 overall | £320 | |
| Keswick #24 overall | £305 | |
| 4 | Cumbria #186 overall | £300 |
| 5 | Bowness-on-Windermere #29 overall | £300 |
| 6 | West Oxfordshire #2 overall | £300 |
| 7 | East Suffolk #153 overall | £295 |
| 8 | Padstow #96 overall | £280 |
| 9 | Ambleside #21 overall | £275 |
| 10 | Chichester #49 overall | £265 |
| 11 | Windermere #16 overall | £265 |
| 12 | St. Ives #82 overall | £255 |
| 13 | Isle of Wight #119 overall | £250 |
| 14 | Lyme Regis #78 overall | £250 |
| 15 | St. Merryn #156 overall | £250 |
| 16 | Cowes #223 overall | £250 |
| 17 | Derbyshire Dales #4 overall | £250 |
| 18 | Derbyshire #85 overall | £245 |
| 19 | North Norfolk #37 overall | £245 |
| 20 | Swanage #38 overall | £245 |
| 21 | Staffordshire Moorlands #8 overall | £240 |
| 22 | North Devon #89 overall | £235 |
| 23 | Rother #39 overall | £235 |
| 24 | Borough of Swale #124 overall | £235 |
| 25 | Dover #104 overall | £230 |
Highest-occupancy Airbnb markets in England
Share of available nights booked over the past 12 months. Markets with at least 200 listings.
| # | Market | Occupancy |
|---|---|---|
| Bath and North East Somerset #26 overall | 50% | |
| Bath #3 overall | 50% | |
| Exeter #68 overall | 49% | |
| 4 | High Peak #6 overall | 49% |
| 5 | City of Westminster #5 overall | 48% |
| 6 | Lincoln #77 overall | 47% |
| 7 | Falmouth #47 overall | 46% |
| 8 | Oxford #65 overall | 46% |
| 9 | Penzance #58 overall | 46% |
| 10 | Derbyshire Dales #4 overall | 46% |
| 11 | Cambridge #95 overall | 46% |
| 12 | Forest of Dean #12 overall | 46% |
| 13 | New Forest #10 overall | 46% |
| 14 | West Oxfordshire #2 overall | 46% |
| 15 | Guildford #15 overall | 45% |
| 16 | Wiltshire #87 overall | 45% |
| 17 | Northumberland #36 overall | 45% |
| 18 | Stratford-on-Avon #7 overall | 45% |
| 19 | Shrewsbury #75 overall | 45% |
| 20 | Chester #32 overall | 45% |
| 21 | Uttlesford #20 overall | 45% |
| 22 | Cotswold District #1 overall | 45% |
| 23 | Windermere #16 overall | 44% |
| 24 | York #18 overall | 44% |
| 25 | Stroud #9 overall | 44% |
Most year-round Airbnb markets in England
Revenue in the slowest month as a share of the best month, so a higher figure means steadier income. Markets with at least 200 listings.
| # | Market | Slow month |
|---|---|---|
| Derby #266 overall | 73% | |
| Birmingham #222 overall | 68% | |
| Cheshire East #139 overall | 66% | |
| 4 | Leeds #201 overall | 65% |
| 5 | Metropolitan Borough of Solihull #167 overall | 63% |
| 6 | Luton #259 overall | 62% |
| 7 | Peterborough #273 overall | 62% |
| 8 | Coventry #263 overall | 61% |
| 9 | Swindon #271 overall | 61% |
| 10 | Warwick #155 overall | 60% |
| 11 | Huntingdonshire #227 overall | 60% |
| 12 | Guildford #15 overall | 60% |
| 13 | Vale of White Horse #101 overall | 59% |
| 14 | Hull #274 overall | 59% |
| 15 | Leicester #250 overall | 58% |
| 16 | Newcastle upon Tyne #200 overall | 58% |
| 17 | Trafford #158 overall | 58% |
| 18 | Newark and Sherwood #76 overall | 58% |
| 19 | Worcestershire #113 overall | 58% |
| 20 | Basingstoke and Deane #129 overall | 58% |
| 21 | Calderdale #28 overall | 57% |
| 22 | Kirklees #66 overall | 57% |
| 23 | Borough of Swale #124 overall | 57% |
| 24 | Bristol #67 overall | 56% |
| 25 | Cheltenham #64 overall | 56% |
Fastest-growing Airbnb markets in England
Change in revenue per listing from the year before, among markets where it rose. Markets with at least 200 listings.
| # | Market | Change |
|---|---|---|
| Ambleside #21 overall | +26% | |
| Calderdale #28 overall | +23% | |
| Folkestone and Hythe District #45 overall | +23% | |
| 4 | Bradford #43 overall | +22% |
| 5 | Kirklees #66 overall | +22% |
| 6 | Hayle #162 overall | +22% |
| 7 | West Devon #122 overall | +21% |
| 8 | Guildford #15 overall | +20% |
| 9 | Lancaster #107 overall | +20% |
| 10 | Hove #94 overall | +19% |
| 11 | St. Merryn #156 overall | +19% |
| 12 | Scarborough #159 overall | +19% |
| 13 | Ventnor #88 overall | +18% |
| 14 | Swanage #38 overall | +18% |
| 15 | Southend-on-Sea #236 overall | +18% |
| 16 | Windermere #16 overall | +17% |
| 17 | West Oxfordshire #2 overall | +17% |
| 18 | Derbyshire Dales #4 overall | +17% |
| 19 | Sefton #241 overall | +17% |
| 20 | Staffordshire Moorlands #8 overall | +17% |
| 21 | South Kesteven #52 overall | +17% |
| 22 | Thanet #51 overall | +17% |
| 23 | Cherwell District #14 overall | +16% |
| 24 | Shrewsbury #75 overall | +16% |
| 25 | Wychavon #11 overall | +16% |
Largest Airbnb markets in England
Active listings. Bigger markets have more comparable rentals to price against and more buyers at resale.
| # | Market | Listings |
|---|---|---|
| London #23 overall | 28,000 | |
| North Norfolk #37 overall | 2,100 | |
| East Suffolk #153 overall | 2,020 | |
| 4 | North Devon #89 overall | 1,880 |
| 5 | South Hams #84 overall | 1,760 |
| 6 | Cotswold District #1 overall | 1,700 |
| 7 | West Midlands #218 overall | 1,690 |
| 8 | Bristol #67 overall | 1,600 |
| 9 | Liverpool #138 overall | 1,590 |
| 10 | York #18 overall | 1,550 |
| 11 | Greater Manchester #172 overall | 1,520 |
| 12 | Brighton #73 overall | 1,440 |
| 13 | Derbyshire Dales #4 overall | 1,390 |
| 14 | Chichester #49 overall | 1,330 |
| 15 | Birmingham #222 overall | 1,330 |
| 16 | Cornwall #146 overall | 1,280 |
| 17 | Blackpool #258 overall | 1,190 |
| 18 | Bournemouth #121 overall | 1,170 |
| 19 | City of Westminster #5 overall | 1,150 |
| 20 | Merseyside #210 overall | 1,130 |
| 21 | East Devon #93 overall | 1,110 |
| 22 | Torridge District #173 overall | 1,080 |
| 23 | King's Lynn and West Norfolk #70 overall | 1,070 |
| 24 | New Forest #10 overall | 1,070 |
| 25 | Oxford #65 overall | 1,040 |
Seasonality
When Airbnbs in England Earn the Most
August is the best month for about two-thirds of ranked markets in England. January is the most common slowest month, in 194 markets.
August earns about twice what January does
Average revenue per listing across the 298 ranked markets in England, by month
| Month | Avg. revenue per listing | Best month for | Highest-ranked examples |
|---|---|---|---|
| January | £1,660 | – | – |
| February | £1,750 | – | – |
| March | £2,020 | 1 market | Cheltenham |
| April | £2,320 | – | – |
| May | £2,660 | – | – |
| June | £2,830 | 5 markets | Worcestershire, Cambridgeshire, Hertfordshire |
| July | £3,440 | 94 markets | Bath, City of Westminster, Wychavon |
| August | £3,460 | 198 markets | Cotswold District, West Oxfordshire, Derbyshire Dales |
| September | £2,710 | – | – |
| October | £2,370 | – | – |
| November | £1,930 | – | – |
| December | £2,300 | – | – |
Average revenue is per listing across the ranked markets, the line in the chart above. "Best month for" counts the ranked markets whose own revenue peaks in that month.
Named regions
Regions in England
These pages compare the towns of a region that people search by name, with figures for the region as a whole.
- Yorkshire 36 towns
- East Anglia 14 areas
- Devon 12 areas
- Cornwall 50 towns
- Norfolk 7 areas
- Kent 14 areas
- Cotswolds 7 towns
- South Devon 6 towns
- Dorset 15 towns
- Norfolk Coast 3 areas
- Lake District 22 towns
- Peak District 3 areas
- Northumberland 14 towns
- North Cornwall 15 towns
- Isle of Wight 10 towns
- Northumberland Coast 9 towns
Management
Who Manages Airbnbs in England?
AirROI ranks the 50 largest of the 1,541 companies that run 5 or more Airbnb listings in England, by listings, guest rating and growth; companies run 23% of its listings.
Method
How the Ranking Works
The ranking covers the 298 markets in England with at least 100 active Airbnb listings and data through October 2026. Each market is compared with the others on five measures, and markets are ordered by a weighted blend of where they place on each:
- Revenue per listing (35%): average revenue an active listing earned over the past 12 months.
- Occupancy (20%): share of available nights that were booked.
- Market size (20%): active listings. Bigger markets offer more comparable rentals to price against and more buyers when you sell.
- Year-round demand (15%): revenue in the slowest month as a share of the best month. The latest month is left out when its bookings look incomplete.
- Growth (10%): change in revenue per listing from the year before. Markets whose boundaries changed between years are scored in the middle.
Left out: 262 markets whose data predate the latest refresh and 6 towns listed a second time under another spelling. The score measures how rentals perform. It does not include purchase prices, financing, operating costs or local short-term rental rules, which vary by address and should be checked before buying. Figures are in British pounds and match each market's own report; see the data methodology for how listings are tracked.
To check one property before buying, run its address and size through the Airbnb income calculator for a revenue, occupancy and nightly-rate range from comparable listings.
FAQ
Frequently Asked Questions About Airbnb Investing in England
What is the best place to buy an Airbnb in England?
Cotswold District ranks first of the 298 markets in England in AirROI's ranking, with £42,100 in average revenue per listing and 45% occupancy. West Oxfordshire and Bath follow. The ranking weighs revenue, occupancy, market size, seasonality and growth; it leaves out purchase prices.
What are the most profitable Airbnb locations in England?
By revenue per listing, among markets with at least 200 listings, City of Westminster leads at £54,500 a year, ahead of Cotswold District at £42,100. Profit also depends on what a property costs to buy and run, which varies far more between markets than revenue does.
How much does an Airbnb make in England?
The average active listing in England earned £21,000 over the 12 months to October 2026, at 41% occupancy. Across the ranked markets, the middle half averaged between £15,000 and £22,800 per listing. Averages include listings that operated for only part of the year, so a listing rented all year typically earns more.
What is a good Airbnb occupancy rate in England?
The average listing in England was booked on 41% of available nights over the past 12 months. Half of the ranked markets fall between 37% and 43%, so a market above about 43% sits in the top quarter. Occupancy is only half the picture: a market with lower occupancy can still earn more if its nightly rates are higher.
Where is Airbnb demand highest in England?
Among ranked markets with at least 200 listings, Bath and North East Somerset has the highest occupancy, with 50% of available nights booked, followed by Bath at 50%. Its listings average about £205 a night and £28,500 a year.
Where are Airbnb nightly rates highest in England?
Among ranked markets with at least 200 listings, City of Westminster has the highest average nightly rate, about £410, followed by Cotswold District at £320. Hull is the least expensive, at about £96. The average booked night in England costs about £195.
What is the best month for Airbnb in England?
August is the highest-earning month for 198 of the 298 ranked markets, followed by July (94). January is the most common slowest month, in 194 of the 298 markets. Each market's report shows its own month-by-month revenue, occupancy and rates.
Which Airbnb markets in England earn the most evenly through the year?
Among ranked markets with at least 200 listings, Derby has the steadiest income: its slowest month, February, still earns about three-quarters of its best. Birmingham follows, at 68%. Steadier markets are easier to budget for, though they do not always earn the most per listing.
Which Airbnb markets are growing fastest in England?
Among ranked markets with at least 200 listings, revenue per listing grew most in Ambleside, up 26% on the year before, and in Calderdale, up 23%. A single strong year can reflect events or new supply, so it is worth checking a market's monthly trend before relying on it.
Is Airbnb still profitable in England in 2026?
Revenue per listing grew in 212 of the 246 ranked markets with a comparable year of data; in the typical market it rose 9%. Whether a given property profits depends on its purchase price, financing and running costs.
What are the best smaller Airbnb markets in England?
Among ranked markets with fewer than 250 active listings, South Derbyshire (#13 overall, £30,200 per listing), Guildford (#15, £23,900) and Uttlesford (#20, £26,400) place highest. Smaller markets have fewer comparable rentals to price against, so their averages can move more from year to year.
How many Airbnb listings are there in England?
AirROI tracked 194,000 active Airbnb listings in England over the 12 months to October 2026, across 1,130 markets. The largest ranked market is London, with 28,000 listings, followed by North Norfolk with 2,100.
Directory
All 1,128 Airbnb Markets in England
Every England city with an AirROI Airbnb market report, A–Z, with its active listing count.
#
- "Bournemouth 172 listings
A
- Acklam 17 listings
- Addlethorpe 37 listings
- Adur 138 listings
- Airton 17 listings
- Alderbury 23 listings
- Allerthorpe 62 listings
- Allhallows 22 listings
- Allithwaite 27 listings
- Allonby 26 listings
- Alnmouth 60 listings
- Alnwick 149 listings
- Alston 33 listings
- Amber Valley 173 listings
- Amble 173 listings
- Ambleside 358 listings
- Amesbury 28 listings
- Amotherby 22 listings
- Anfield 101 listings
- Appleby-in-Westmorland 22 listings
- Appledore 27 listings
- Applethwaite 31 listings
- Arnside 29 listings
- Arun 528 listings
- Ascot 18 listings
- Ashfield 42 listings
- Ashford 390 listings
- Ashington 23 listings
- Ashley 17 listings
- Ashton Keynes 27 listings
- Askham 17 listings
- Askrigg 33 listings
- Aylesbury 66 listings
- Aysgarth 20 listings
B
- Babergh 285 listings
- Backbarrow 39 listings
- Backwell 18 listings
- Baltonsborough 20 listings
- Bamburgh 67 listings
- Bardon Mill 21 listings
- Barmston 17 listings
- Barnard Castle 51 listings
- Barnsley 109 listings
- Barrow-in-Furness 67 listings
- Basildon 83 listings
- Basingstoke and Deane 240 listings
- Bassenthwaite 53 listings
- Bassetlaw 125 listings
- Batcombe 23 listings
- Bath 960 listings
- Bath and North East Somerset 289 listings
- Bathampton 25 listings
- Batheaston 26 listings
- Bathford 20 listings
- Beadnell 133 listings
- Beal 27 listings
- Beaminster 30 listings
- Bebington 18 listings
- Beckington 17 listings
- Bedford 166 listings
- Bedminster 26 listings
- Beer 22 listings
- Beeston 60 listings
- Beetham 18 listings
- Belford 61 listings
- Bellingham 49 listings
- Bembridge 130 listings
- Bempton 24 listings
- Berkshire 477 listings
- Berrow 23 listings
- Berwick-upon-Tweed 113 listings
- Beverley 60 listings
- Bewaldeth 21 listings
- Billingham 18 listings
- Birchwood 19 listings
- Birkenhead 66 listings
- Birmingham 1,325 listings
- Bishop Auckland 31 listings
- Bishop's Castle 29 listings
- Bispham 23 listings
- Blaby 25 listings
- Blackburn 22 listings
- Blackburn with Darwen 32 listings
- Blackpool 1,194 listings
- Blackwater 20 listings
- Blandford Forum 29 listings
- Bletchley 23 listings
- Blindcrake 18 listings
- Blunsdon St Andrew 17 listings
- Blyth 29 listings
- Bodenham 19 listings
- Bodmin 58 listings
- Bollington 19 listings
- Bolsover 49 listings
- Bolton 95 listings
- Boot 26 listings
- Borough of Fylde 283 listings
- Borough of Pendle 103 listings
- Borough of Rossendale 57 listings
- Borough of Runnymede 120 listings
- Borough of Spelthorne 118 listings
- Borough of Swale 227 listings
- Borough of Wyre 202 listings
- Borrowdale 51 listings
- Boscastle 68 listings
- Boston 142 listings
- Bothenhampton 18 listings
- Bournemouth 1,167 listings
- Bourton-on-the-Water 35 listings
- Bowness-on-Solway 20 listings
- Bowness-on-Windermere 390 listings
- Box 34 listings
- Brackley 41 listings
- Bracknell 57 listings
- Bradford 472 listings
- Bradford-on-Avon 71 listings
- Brading 20 listings
- Bradley Stoke 23 listings
- Bradwell 22 listings
- Braintree 170 listings
- Braithwaite 44 listings
- Brampton 43 listings
- Brandesburton 18 listings
- Bray 29 listings
- Breage 128 listings
- Brean 25 listings
- Breckland District 374 listings
- Brent Knoll 17 listings
- Brentwood 69 listings
- Bridekirk 18 listings
- Bridgnorth 60 listings
- Bridgwater 18 listings
- Bridlington 199 listings
- Bridport 113 listings
- Briggswath 17 listings
- Brigham 17 listings
- Brighstone 41 listings
- Brighton 1,441 listings
- Brighton and Hove 823 listings
- Bristol 1,603 listings
- Bristol City 59 listings
- Brixham 298 listings
- Broad Oak 28 listings
- Broadland 394 listings
- Broadwindsor 25 listings
- Bromham 24 listings
- Brompton 19 listings
- Bromsgrove 57 listings
- Bromyard 22 listings
- Broomhall 24 listings
- Broseley 19 listings
- Broughton 31 listings
- Broughton in Furness 32 listings
- Broxbourne 42 listings
- Broxtowe 95 listings
- Bruton 36 listings
- Buckden 21 listings
- Buckingham 21 listings
- Buckinghamshire 204 listings
- Buckland Newton 19 listings
- Bude 133 listings
- Budock Water 41 listings
- Burley 36 listings
- Burnham-on-Sea 34 listings
- Burnley 54 listings
- Burton Bradstock 53 listings
- Burton upon Trent 32 listings
- Bury 100 listings
- Bury St Edmunds 37 listings
- Bush 19 listings
- Butleigh 17 listings
C
- Cadgwith 26 listings
- Caldbeck 35 listings
- Calderdale 409 listings
- Callington 23 listings
- Calne 18 listings
- Calstock 18 listings
- Camber 63 listings
- Camborne 65 listings
- Cambridge 730 listings
- Cambridgeshire 256 listings
- Camelford 61 listings
- Cannock Chase 35 listings
- Canterbury 947 listings
- Carbis Bay 51 listings
- Cardington 19 listings
- Carhampton 21 listings
- Carlisle 135 listings
- Carlton 22 listings
- Carlyon Bay 43 listings
- Carnhell Green 19 listings
- Carnmenellis 19 listings
- Carnon Downs 18 listings
- Cartmel 54 listings
- Cartmel Fell 25 listings
- Castle Carrock 18 listings
- Castle Cary 27 listings
- Castle Point 19 listings
- Castleton 29 listings
- Castletown 26 listings
- Cawsand 53 listings
- Cayton 24 listings
- Central Bedfordshire 31 listings
- Chacewater 21 listings
- Chale 22 listings
- Chapel Amble 18 listings
- Chapel St. Leonards 60 listings
- Chapel Stile 55 listings
- Chard 22 listings
- Charlestown 86 listings
- Charlton 19 listings
- Charmouth 84 listings
- Charnwood 165 listings
- Chatham 34 listings
- Chatton 35 listings
- Cheddar 62 listings
- Chelmarsh 30 listings
- Chelmsford 159 listings
- Cheltenham 620 listings
- Cherwell District 444 listings
- Chesham 19 listings
- Cheshire East 203 listings
- Cheshire West and Chester 180 listings
- Chester 454 listings
- Chesterfield 72 listings
- Chew Stoke 21 listings
- Chichester 1,331 listings
- Chickerell 23 listings
- Child Okeford 18 listings
- Chippenham 35 listings
- Chiswell 22 listings
- Chorley 49 listings
- Christchurch 163 listings
- Church Stretton 63 listings
- Churchill 22 listings
- City of London 186 listings
- City of Westminster 1,145 listings
- Cleator Moor 23 listings
- Cleethorpes 132 listings
- Clevedon 33 listings
- Clifford 27 listings
- Clifton 103 listings
- Cliftonville 22 listings
- Cloughton 18 listings
- Clun 25 listings
- Coalbrookdale 18 listings
- Cockermouth 93 listings
- Colchester 320 listings
- Colerne 18 listings
- Colwall 17 listings
- Combe Martin 23 listings
- Combe St Nicholas 20 listings
- Condover 28 listings
- Congleton 31 listings
- Coniston 107 listings
- Connor Downs 46 listings
- Consett 21 listings
- Constantine 42 listings
- Cookham 23 listings
- Corbridge 24 listings
- Corby 23 listings
- Corfe Castle 84 listings
- Corfe Mullen 18 listings
- Cornwall 1,282 listings
- Corsham 21 listings
- Corton 30 listings
- Cotswold District 1,701 listings
- County Durham 167 listings
- Coventry 390 listings
- Coverack 40 listings
- Cowes 201 listings
- Crackington Haven 33 listings
- Crafthole 27 listings
- Cramlington 18 listings
- Crantock 60 listings
- Craster 26 listings
- Craswall 18 listings
- Crawley 114 listings
- Cresswell 29 listings
- Crewe 89 listings
- Crewkerne 20 listings
- Crimdon 18 listings
- Crook 28 listings
- Cropton 22 listings
- Crossways 31 listings
- Crowlas 18 listings
- Croyde 25 listings
- Cubert 56 listings
- Cuddington 21 listings
- Cumberland 205 listings
- Cumbria 231 listings
- Cusop 19 listings
D
- Dacorum 163 listings
- Dacre 58 listings
- Dalston 31 listings
- Dalton-in-Furness 27 listings
- Darlington 186 listings
- Dartford 102 listings
- Datchet 22 listings
- Dawley 25 listings
- Dean 21 listings
- Delabole 22 listings
- Dent 31 listings
- Derby 319 listings
- Derbyshire 309 listings
- Derbyshire Dales 1,388 listings
- Deritend 23 listings
- Devon 790 listings
- Devoran 18 listings
- Dilton Marsh 19 listings
- Dobwalls 23 listings
- Doncaster 150 listings
- Dorchester 44 listings
- Dorset 567 listings
- Dover 579 listings
- Downderry 54 listings
- Downton 26 listings
- Droylsden 27 listings
- Dudley 78 listings
- Duloe 23 listings
- Dulverton 34 listings
- Dunstable 19 listings
- Dunster 24 listings
- Durham 97 listings
E
- Earley 23 listings
- Easingwold 19 listings
- East Cambridgeshire 156 listings
- East Cowes 24 listings
- East Devon 1,113 listings
- East Hampshire 270 listings
- East Hertfordshire 174 listings
- East Heslerton 26 listings
- East Lindsey 1,017 listings
- East Riding of Yorkshire 285 listings
- East Staffordshire 174 listings
- East Stoke 17 listings
- East Suffolk 2,020 listings
- East Sussex 392 listings
- Eastbourne 261 listings
- Eastleigh 147 listings
- Easton 60 listings
- Eaton 17 listings
- Eccles 37 listings
- Eglingham 31 listings
- Egremont 18 listings
- Ellesmere 31 listings
- Ellesmere Port 30 listings
- Elmbridge 173 listings
- Elterwater 29 listings
- Embleton 44 listings
- Enmore 28 listings
- Epping Forest 87 listings
- Epsom and Ewell 44 listings
- Erewash 40 listings
- Eshott 29 listings
- Eskdale Green 25 listings
- Essex 455 listings
- Eton 31 listings
- Exeter 356 listings
- Exford 31 listings
- Eype 24 listings
F
- Failsworth 24 listings
- Fairfield 39 listings
- Falmouth 401 listings
- Far Cotton 29 listings
- Fareham 100 listings
- Felton 49 listings
- Fenland District 73 listings
- Feock 18 listings
- Ferndown 39 listings
- Filey 325 listings
- Filton 48 listings
- Finsthwaite 21 listings
- Flamborough 86 listings
- Flexbury 31 listings
- Flookburgh 24 listings
- Flushing 18 listings
- Foggathorpe 29 listings
- Folkestone and Hythe District 467 listings
- Forest of Dean 508 listings
- Fortuneswell 67 listings
- Forty Green 19 listings
- Four Lanes 18 listings
- Fowey 167 listings
- Fratton 25 listings
- Freshwater 129 listings
- Frindsbury 18 listings
- Frogpool 18 listings
- Frome 144 listings
- Fylingthorpe 27 listings
G
- Galmpton 18 listings
- Gargrave 30 listings
- Garras 18 listings
- Gateshead 216 listings
- Gedling 90 listings
- Germoe 18 listings
- Gerrans 40 listings
- Giggleswick 22 listings
- Gilling West 18 listings
- Gillingham 90 listings
- Glaisdale 42 listings
- Glastonbury 187 listings
- Gloucester 142 listings
- Gloucestershire 574 listings
- Goathland 26 listings
- Godshill 31 listings
- Goodrich 24 listings
- Goole 20 listings
- Goonbell 26 listings
- Gorran Haven 39 listings
- Gosforth 22 listings
- Gosport 70 listings
- Grange-Over-Sands 41 listings
- Grasmere 113 listings
- Grassington 56 listings
- Gravesham 75 listings
- Grays 36 listings
- Great Ayton 48 listings
- Great Broughton 19 listings
- Great Habton 21 listings
- Great Ormside 19 listings
- Great Salkeld 18 listings
- Great Strickland 19 listings
- Great Yarmouth 631 listings
- Greater London 17,848 listings
- Greater Manchester 1,518 listings
- Greatstone 22 listings
- Grewelthorpe 19 listings
- Greystoke 22 listings
- Grimsby 32 listings
- Grosmont 21 listings
- Guildford 203 listings
- Guisborough 36 listings
- Gunnerside 22 listings
- Gurnard 29 listings
- Gweek 18 listings
H
- Haddenham 21 listings
- Haltwhistle 47 listings
- Hambleden 20 listings
- Hampshire 474 listings
- Hamsterley 17 listings
- Hanley 22 listings
- Harborough 165 listings
- Harehills 24 listings
- Harlow 39 listings
- Harrogate 342 listings
- Hart 67 listings
- Hartlepool 105 listings
- Harwood Dale 20 listings
- Hastings 534 listings
- Havant 172 listings
- Hawes 63 listings
- Hawkshead 85 listings
- Haworth 38 listings
- Hayle 230 listings
- Haywards Heath 17 listings
- Headington 60 listings
- Hebden 22 listings
- Helford 24 listings
- Helmdon 20 listings
- Helmsley 48 listings
- Helston 45 listings
- Helstone 18 listings
- Hemsby 24 listings
- Henley-on-Thames 28 listings
- Hereford 119 listings
- Herefordshire 172 listings
- Hertfordshire 452 listings
- Hertsmere 85 listings
- Heswall 29 listings
- Hewas Water 24 listings
- Heworth 22 listings
- Hexham 52 listings
- Heysham 46 listings
- High Bentham 22 listings
- High Newton by the Sea 20 listings
- High Nibthwaite 25 listings
- High Peak 562 listings
- High Wycombe 60 listings
- Highcliffe-on-Sea 52 listings
- Higher Crackington 22 listings
- Highfield 28 listings
- Hinckley and Bosworth 97 listings
- Hinderwell 144 listings
- Holt 26 listings
- Holtby 19 listings
- Hornsea 49 listings
- Horsham 331 listings
- Horton 36 listings
- Horton in Ribblesdale 40 listings
- Houghton Regis 19 listings
- Hove 276 listings
- Hoylake 42 listings
- Huby 19 listings
- Hugh Town 21 listings
- Hull 226 listings
- Humberston 41 listings
- Hunmanby 30 listings
- Huntingdonshire 220 listings
- Huntington 24 listings
- Hutton-le-Hole 18 listings
- Hyndburn 39 listings
I
- Illogan 22 listings
- Indian Queens 46 listings
- Ingleby Greenhow 20 listings
- Ingleton 74 listings
- Ingoldmells 64 listings
- Ipswich 135 listings
- Ironbridge 45 listings
- Isle of Wight 278 listings
- Iver Heath 18 listings
- Ivinghoe 18 listings
J
- Jacobstow 27 listings
K
- Kempston 25 listings
- Kendal 195 listings
- Kensington 41 listings
- Kent 848 listings
- Keswick 460 listings
- Kettering 43 listings
- Kettlewell 18 listings
- Keynsham 40 listings
- Kilkhampton 85 listings
- King's Lynn and West Norfolk 1,073 listings
- Kingsand 35 listings
- Kingston upon Hull 157 listings
- Kingswood 32 listings
- Kington 21 listings
- Kirkby Lonsdale 55 listings
- Kirkby Malzeard 18 listings
- Kirkby Stephen 30 listings
- Kirkbymoorside 23 listings
- Kirklees 377 listings
- Kirknewton 20 listings
- Kirkoswald 18 listings
- Knaresborough 65 listings
- Knowsley 39 listings
- Knutsford 23 listings
- Kuggar 18 listings
L
- Ladock 20 listings
- Lake 20 listings
- Lamorna 18 listings
- Lamplugh 22 listings
- Lancashire 390 listings
- Lancaster 537 listings
- Lanchester 21 listings
- Landford 18 listings
- Langton Matravers 35 listings
- Lanivet 38 listings
- Lanner 20 listings
- Lanreath 24 listings
- Lansallos 29 listings
- Launceston 19 listings
- Leamington Spa 36 listings
- Ledbury 24 listings
- Leeds 925 listings
- Leicester 555 listings
- Leicestershire 86 listings
- Leigh on Sea 20 listings
- Lelant 45 listings
- Leominster 24 listings
- Lesbury 28 listings
- Levens 20 listings
- Lewes 426 listings
- Leyburn 36 listings
- Lichfield 93 listings
- Lincoln 232 listings
- Lincolnshire 432 listings
- Linton 18 listings
- Liskeard 51 listings
- Little Marcle 19 listings
- Little Petherick 36 listings
- Little Wenlock 22 listings
- Liverpool 1,591 listings
- Lizard 38 listings
- Llangarron 18 listings
- Lofthouse 24 listings
- Loftus 86 listings
- London 28,045 listings
- London Apprentice 40 listings
- Long Sutton 18 listings
- Longframlington 28 listings
- Longrock 34 listings
- Longsight 25 listings
- Longtown 71 listings
- Looe 256 listings
- Lorton 21 listings
- Lostwithiel 62 listings
- Low Row 23 listings
- Lowick 27 listings
- Ludgvan 22 listings
- Ludlow 105 listings
- Luton 384 listings
- Lydbury North 22 listings
- Lyme Regis 260 listings
- Lymm 20 listings
- Lyonshall 20 listings
- Lytchett Matravers 20 listings
- Lytchett Minster 30 listings
- Lytham St Annes 43 listings
- Lythe 36 listings
M
- Mabe Burnthouse 17 listings
- Macclesfield 46 listings
- Madeley 18 listings
- Maidenhead 85 listings
- Maidstone 256 listings
- Maldon 116 listings
- Malmesbury 29 listings
- Malton 20 listings
- Malvern Hills 399 listings
- Manchester 1,422 listings
- Mansfield 57 listings
- Manton 22 listings
- Marazion 81 listings
- Margate 39 listings
- Marhamchurch 75 listings
- Market Drayton 18 listings
- Marlborough 28 listings
- Marlow 45 listings
- Marshfield 19 listings
- Marske-by-the-Sea 26 listings
- Maryport 18 listings
- Masham 53 listings
- Mawgan Porth 31 listings
- Mawnan Smith 33 listings
- Medway 184 listings
- Melksham 22 listings
- Melton 93 listings
- Merseyside 1,125 listings
- Metropolitan Borough of Solihull 248 listings
- Mevagissey 151 listings
- Michaelstow 30 listings
- Mid Devon 411 listings
- Mid Suffolk 269 listings
- Mid Sussex 247 listings
- Middle Crackington 22 listings
- Middleham 24 listings
- Middlesbrough 190 listings
- Middleton 40 listings
- Middleton in Teesdale 27 listings
- Middlezoy 18 listings
- Midsomer Norton 18 listings
- Milford on Sea 22 listings
- Millbrook 25 listings
- Millom 60 listings
- Milton Keynes 486 listings
- Minehead 62 listings
- Mole Valley 123 listings
- Moorend 18 listings
- Morcombelake 17 listings
- Morpeth 55 listings
- Motherby 24 listings
- Mount Hawke 33 listings
- Much Marcle 20 listings
- Much Wenlock 22 listings
- Mullion 61 listings
- Mundesley 22 listings
- Mungrisdale 31 listings
N
- Nailsea 22 listings
- Nantwich 26 listings
- Near Sawrey 22 listings
- Neston 18 listings
- Nettlestone 20 listings
- New Ferry 18 listings
- New Forest 1,068 listings
- New Polzeath 18 listings
- Newark and Sherwood 279 listings
- Newark-on-Trent 28 listings
- Newbiggin by the Sea 68 listings
- Newbridge 22 listings
- Newbury 44 listings
- Newby 18 listings
- Newcastle upon Tyne 507 listings
- Newcastle-under-Lyme 80 listings
- Newchurch 35 listings
- Newholm-cum-Dunsley 22 listings
- Newport 69 listings
- Newquay 917 listings
- Newton upon Rawcliffe 19 listings
- Ningwood 18 listings
- Niton 40 listings
- Norfolk 613 listings
- North Chideock 43 listings
- North Curry 18 listings
- North Devon 1,883 listings
- North East Derbyshire 189 listings
- North East Lincolnshire 94 listings
- North Hertfordshire 106 listings
- North Kesteven 174 listings
- North Lincolnshire 45 listings
- North Norfolk 2,096 listings
- North Northamptonshire 73 listings
- North Petherton 27 listings
- North Petherwin 20 listings
- North Somerset 40 listings
- North Tyneside 291 listings
- North Warwickshire 71 listings
- North West Leicestershire 181 listings
- North Yorkshire 850 listings
- Northampton 199 listings
- Northamptonshire 36 listings
- Northumberland 450 listings
- Northwich 18 listings
- Northwood 25 listings
- Norwich 420 listings
- Nottingham 996 listings
- Nottinghamshire 63 listings
- Nuneaton and Bedworth 41 listings
O
- Oadby and Wigston 22 listings
- Oakham 25 listings
- Oakhill 28 listings
- Old Cleeve 29 listings
- Old Windsor 20 listings
- Oldbrook 35 listings
- Oldham 116 listings
- Orton 22 listings
- Osgodby 31 listings
- Osmington 37 listings
- Osmotherley 23 listings
- Oswestry 30 listings
- Otterburn 47 listings
- Oundle 22 listings
- Ovingdean 22 listings
- Oxford 1,036 listings
- Oxfordshire 497 listings
P
- Padstow 267 listings
- Paignton 260 listings
- Par 30 listings
- Patcham 23 listings
- Patchway 98 listings
- Pateley Bridge 62 listings
- Patrington 39 listings
- Patterdale 67 listings
- Peasedown St. John 17 listings
- Pelynt 37 listings
- Pembridge 22 listings
- Penrith 78 listings
- Penryn 66 listings
- Penzance 476 listings
- Perivale 22 listings
- Perranuthnoe 24 listings
- Perranzabuloe 307 listings
- Peterborough 270 listings
- Pewsey 17 listings
- Pickering 115 listings
- Pilton 29 listings
- Pityme 22 listings
- Plumbland 23 listings
- Plymouth 601 listings
- Pocklington 36 listings
- Polgooth 36 listings
- Polperro 71 listings
- Polruan 77 listings
- Polzeath 65 listings
- Ponsanooth 17 listings
- Ponteland 20 listings
- Pool 18 listings
- Poole 516 listings
- Porchfield 28 listings
- Porkellis 18 listings
- Porlock 59 listings
- Port Isaac 151 listings
- Porthallow 23 listings
- Porthcurno 40 listings
- Porthleven 139 listings
- Porthoustock 23 listings
- Porthtowan 100 listings
- Portinscale 55 listings
- Portishead 52 listings
- Portloe 29 listings
- Portreath 91 listings
- Portsea Island 23 listings
- Portslade by Sea 96 listings
- Portsmouth 727 listings
- Poundstock 19 listings
- Poynton 22 listings
- Praze-An-Beeble 20 listings
- Preston 198 listings
- Prestwich 22 listings
- Priddy 20 listings
- Primrose Valley 27 listings
R
- Radford 23 listings
- Ravenstonedale 35 listings
- Reading 351 listings
- Redcar 51 listings
- Redcar and Cleveland 120 listings
- Redditch 25 listings
- Redland 37 listings
- Redruth 43 listings
- Reeth 29 listings
- Reigate and Banstead 139 listings
- Reighton 23 listings
- Relubbus 22 listings
- Ribble Valley 306 listings
- Richmond 84 listings
- Ripon 47 listings
- Robin Hood's Bay 81 listings
- Rochdale 52 listings
- Rochester 34 listings
- Rochford 22 listings
- Rock 66 listings
- Rodney Stoke 20 listings
- Roedean 48 listings
- Roos 26 listings
- Rosedale Abbey 21 listings
- Ross-on-Wye 36 listings
- Rosudgeon 19 listings
- Rothbury 61 listings
- Rother 827 listings
- Rotherham 79 listings
- Rottingdean 29 listings
- Royal Leamington Spa 21 listings
- Royal Tunbridge Wells 46 listings
- Rugby 89 listings
- Rushcliffe 147 listings
- Rushmoor 109 listings
- Ruyton-XI-Towns 26 listings
- Ryde 152 listings
S
- Saint Leonards-on-Sea 51 listings
- Saint Merryn 30 listings
- Saint Paul's 23 listings
- Salford 508 listings
- Salisbury 136 listings
- Saltash 26 listings
- Saltburn by the Sea 85 listings
- Saltford 30 listings
- Sancreed 19 listings
- Sandbach 18 listings
- Sandown 95 listings
- Sandwell 122 listings
- Santon Bridge 30 listings
- Satterthwaite 25 listings
- Scalby 22 listings
- Scarborough 463 listings
- Scunthorpe 23 listings
- Seaham 25 listings
- Seahouses 142 listings
- Seasalter 22 listings
- Seaton 36 listings
- Seaview 57 listings
- Sebergham 18 listings
- Sedbergh 59 listings
- Sefton 255 listings
- Selsey 55 listings
- Selside 19 listings
- Sennen 105 listings
- Settle 57 listings
- Sevenoaks 158 listings
- Shaftesbury 37 listings
- Shanklin 157 listings
- Shap 23 listings
- Sheffield 790 listings
- Shepton Mallet 27 listings
- Sherborne 30 listings
- Shinfield 19 listings
- Shirley 39 listings
- Shop 19 listings
- Shorwell 23 listings
- Shrewsbury 227 listings
- Shropshire 220 listings
- Silloth 22 listings
- Silverstone 75 listings
- Siston 22 listings
- Sithney 18 listings
- Skegness 46 listings
- Skelwith Bridge 52 listings
- Skipsea 31 listings
- Skipton 94 listings
- Slaley 18 listings
- Sleights 24 listings
- Slough 136 listings
- Somerset 459 listings
- Somerton 23 listings
- South Cambridgeshire 333 listings
- South Cerney 38 listings
- South Derbyshire 125 listings
- South Gloucestershire 34 listings
- South Hams 1,755 listings
- South Holland 72 listings
- South Kesteven 287 listings
- South Norfolk 425 listings
- South Ockendon 20 listings
- South Oxfordshire 479 listings
- South Petherton 17 listings
- South Ribble 46 listings
- South Staffordshire 61 listings
- South Tyneside 102 listings
- South Wraxall 28 listings
- South Yorkshire 298 listings
- Southampton 730 listings
- Southburn 18 listings
- Southend-on-Sea 248 listings
- Spark Bridge 20 listings
- Spennymoor 22 listings
- Splatt 23 listings
- St Albans 169 listings
- St Ann's Chapel 56 listings
- St Bees 22 listings
- St Blazey 42 listings
- St Cleer 18 listings
- St Erth 48 listings
- St Helens 83 listings
- St Issey 23 listings
- St Ives 127 listings
- St Just 176 listings
- St Kew 18 listings
- St Kew Highway 19 listings
- St Leonards 18 listings
- St Mellion 25 listings
- St Minver 22 listings
- St Teath 18 listings
- St. Agnes 127 listings
- St. Austell 66 listings
- St. Breward 22 listings
- St. Buryan 19 listings
- St. Columb Major 164 listings
- St. Eval 53 listings
- St. Helens 20 listings
- St. Ives 978 listings
- St. John 41 listings
- St. John's Chapel 17 listings
- St. Keverne 19 listings
- St. Mabyn 20 listings
- St. Mawes 41 listings
- St. Mawgan 19 listings
- St. Merryn 242 listings
- St. Newlyn East 56 listings
- St. Osyth 23 listings
- Stafford 146 listings
- Staffordshire 138 listings
- Staffordshire Moorlands 514 listings
- Staines-upon-Thames 36 listings
- Staithes 24 listings
- Stanhope 21 listings
- Stanley 22 listings
- Staveley 64 listings
- Staveley-in-Cartmel 28 listings
- Stevenage 71 listings
- Stibb 18 listings
- Sticker 19 listings
- Stinsford 18 listings
- Stockport 220 listings
- Stockton-on-Tees 151 listings
- Stoke Gifford 35 listings
- Stoke-on-Trent 225 listings
- Stokesley 22 listings
- Stonehouse 22 listings
- Stow-on-the-Wold 35 listings
- Stratford-on-Avon 692 listings
- Stratton 64 listings
- Street 23 listings
- Strensall 19 listings
- Stretford 142 listings
- Stroud 588 listings
- Sturminster Marshall 18 listings
- Sturminster Newton 18 listings
- Suffolk 430 listings
- Summerbridge 24 listings
- Sunderland 171 listings
- Sunningdale 17 listings
- Surrey 358 listings
- Surrey Heath 83 listings
- Sutton-under-Whitestonecliffe 18 listings
- Swanage 311 listings
- Swarland 53 listings
- Swindon 284 listings
- Symonds Yat West 33 listings
T
- Talbot Village 25 listings
- Tameside 80 listings
- Tamworth 19 listings
- Tandridge 95 listings
- Tattershall 70 listings
- Taunton 50 listings
- Teignbridge 766 listings
- Telford 22 listings
- Telford and Wrekin 48 listings
- Tendring 388 listings
- Test Valley 255 listings
- Tewkesbury 347 listings
- Thanet 967 listings
- Thirsk 19 listings
- Thornaby-on-Tees 27 listings
- Thornthwaite 28 listings
- Thornton-le-Dale 26 listings
- Three Rivers 74 listings
- Threemilestone 18 listings
- Threlkeld 87 listings
- Threshfield 19 listings
- Throop 18 listings
- Thurrock 53 listings
- Timberscombe 19 listings
- Tintagel 127 listings
- Tonbridge and Malling 93 listings
- Torbay 178 listings
- Torquay 457 listings
- Torridge District 1,083 listings
- Torver 32 listings
- Totland 38 listings
- Towcester 42 listings
- Trafford 293 listings
- Trebetherick 39 listings
- Treen 20 listings
- Tregony 22 listings
- Trenance 23 listings
- Trevellas Downs 18 listings
- Treverbyn 18 listings
- Trevivian 29 listings
- Troutbeck 67 listings
- Troutbeck Bridge 75 listings
- Trowbridge 26 listings
- Truro 108 listings
- Tunbridge Wells 291 listings
- Tunstall 29 listings
- Tyne and Wear 437 listings
- Tywardreath 22 listings
U
- Ulverston 111 listings
- Uppingham 22 listings
- Upton 42 listings
- Uttlesford 202 listings
V
- Vale of White Horse 383 listings
- Ventnor 223 listings
W
- Wadebridge 67 listings
- Wakefield 139 listings
- Walford 19 listings
- Wallasey 59 listings
- Walsall 71 listings
- Wareham 57 listings
- Wargrave 24 listings
- Warkworth 41 listings
- Warminster 29 listings
- Warrington 140 listings
- Warwick 302 listings
- Warwickshire 213 listings
- Watchet 39 listings
- Waterloo 22 listings
- Watermillock 23 listings
- Watford 150 listings
- Waverley 265 listings
- Waverton 18 listings
- Wealden 591 listings
- Wedmore 49 listings
- Wellingborough 28 listings
- Wellington 55 listings
- Wells 62 listings
- Welwyn Hatfield 116 listings
- Wembley Park 33 listings
- Wendron 20 listings
- West Devon 483 listings
- West Haddon 20 listings
- West Kirby 46 listings
- West Lancashire 108 listings
- West Lindsey 203 listings
- West Lulworth 108 listings
- West Midlands 1,687 listings
- West Northamptonshire 216 listings
- West Oxfordshire 708 listings
- West Parley 20 listings
- West Pennard 39 listings
- West Quantoxhead 18 listings
- West Suffolk 384 listings
- West Sussex 393 listings
- West Wittering 23 listings
- West Witton 20 listings
- West Yorkshire 733 listings
- Westbourne 29 listings
- Westbury 31 listings
- Westmorland and Furness 296 listings
- Weston-super-Mare 112 listings
- Westward Ho! 32 listings
- Weymouth 451 listings
- Wheddon Cross 32 listings
- Whippingham 21 listings
- Whitby 782 listings
- Whitchurch 32 listings
- Whitchurch Canonicorum 33 listings
- Whitecross 28 listings
- Whitehaven 52 listings
- Whiteparish 18 listings
- Whitstable 26 listings
- Whitwell 18 listings
- Wick 93 listings
- Widemouth Bay 78 listings
- Widnes 18 listings
- Wigan 106 listings
- Wilberfoss 25 listings
- Wilmslow 24 listings
- Wilsthorpe 23 listings
- Wilton 27 listings
- Wiltshire 200 listings
- Wimborne Minster 35 listings
- Winchester 395 listings
- Windermere 352 listings
- Windsor 270 listings
- Winford 24 listings
- Winfrith Newburgh 23 listings
- Winkfield 30 listings
- Winscombe 18 listings
- Winsford 20 listings
- Withernsea 24 listings
- Withiel 29 listings
- Withington 24 listings
- Withypool 19 listings
- Wiveliscombe 18 listings
- Woking 114 listings
- Wokingham 30 listings
- Wolsingham 30 listings
- Wolverhampton 129 listings
- Woodhouse 54 listings
- Wool 28 listings
- Wooler 44 listings
- Woolland 19 listings
- Wootton Bridge 55 listings
- Wootton Fitzpaine 20 listings
- Worcester 120 listings
- Worcestershire 255 listings
- Workington 26 listings
- Worth Matravers 51 listings
- Worthing 191 listings
- Wraysbury 18 listings
- Wrelton 25 listings
- Wrington 18 listings
- Wychavon 403 listings
- Wyre Forest 111 listings
- Wythenshawe 65 listings