St Mellion, England Airbnb Market Data 2025: STR Report & Statistics
How much can you earn on Airbnb in St Mellion, England? Based on AirROI's 2025 dataset (June 2024 – May 2025), the short answer is $10,106 per year — at a $239 nightly rate, 23.9% occupancy, and a N/A RevPAR.
With just 25 active listings, St Mellion is a micro-market where selective demand that rewards strong listing quality and pricing strategy. Supply grew 127.3% year over year, and the market is recalibrating around a new competitive baseline. This is the stage where hosts who invest in amenities, guest experience, and dynamic pricing build durable advantages that compound as the market matures.
Regulation is high and 64% of listings show active registration — compliance is the cost of entry. In a market this size, differentiated listings with strong reviews can capture outsized returns relative to the competition.

Table of Contents [hide] [show]
What Are the Key Airbnb Metrics in St Mellion?
In St Mellion, the headline Airbnb metrics are $10,106 in average annual revenue,23.9% occupancy, $239 ADR, and $0 in RevPAR, and guests book about 61 days in advance.
How Much Do Airbnb Hosts Earn Monthly in St Mellion?
Understanding the monthly revenue variations for Airbnb listings in St Mellion is key to maximizing your short term rental income potential. Seasonality significantly impacts earnings. Our analysis, based on data from the past 12 months, shows that the peak revenue month for STRs in St Mellion is typically August, while November often presents the lowest earnings, highlighting opportunities for strategic pricing adjustments during shoulder and low seasons. Explore the typical Airbnb income in St Mellion across different performance tiers:
- Best-in-class properties (Top 10%) achieve $4,207+ monthly, often utilizing dynamic pricing and superior guest experiences.
- Strong performing properties (Top 25%) earn $2,610 or more, indicating effective management and desirable locations/amenities.
- Typical properties (Median) generate around $1,552 per month, representing the average market performance.
- Entry-level properties (Bottom 25%) see earnings around $979, often with potential for optimization.
Average Monthly Airbnb Earnings Trend in St Mellion
What Is the Monthly Airbnb Occupancy Rate in St Mellion?
Maximize your bookings by understanding the St Mellion STR occupancy trends. Seasonal demand shifts significantly influence how often properties are booked. Typically, Augustsees the highest demand (peak season occupancy), while November experiences the lowest (low season). Effective strategies, like adjusting minimum stays or offering promotions, can boost occupancy during slower periods. Here's how different property tiers perform in St Mellion:
- Best-in-class properties (Top 10%) achieve 63%+ occupancy, indicating high desirability and potentially optimized availability.
- Strong performing properties (Top 25%) maintain 39% or higher occupancy, suggesting good market fit and guest satisfaction.
- Typical properties (Median) have an occupancy rate around 27%.
- Entry-level properties (Bottom 25%) average 14% occupancy, potentially facing higher vacancy.
Average Monthly Occupancy Rate Trend in St Mellion
What Is the Average Airbnb Nightly Rate in St Mellion?
Effective short term rental pricing strategy in St Mellion involves understanding monthly ADR fluctuations. The Average Daily Rate (ADR) for Airbnb in St Mellion typically peaks in August and dips lowest during March. Leveraging Airbnb dynamic pricing tools or strategies based on this seasonality can significantly boost revenue. Here's a look at the typical nightly rates achieved:
- Best-in-class properties (Top 10%) command rates of $326+ per night, often due to premium features or locations.
- Strong performing properties (Top 25%) achieve nightly rates of $293 or more.
- Typical properties (Median) charge around $223 per night.
- Entry-level properties (Bottom 25%) earn around $183 per night.
Average Daily Rate (ADR) Trend by Month in St Mellion
What Is the RevPAR for Airbnb in St Mellion?
RevPAR in St Mellion is currently N/A. Because RevPAR combines nightly rates with realized occupancy, it is one of the cleanest ways to compare how efficiently listings turn demand into revenue across the market.
- Entry-level properties (Bottom 25%) see N/A RevPAR.
- Typical properties (Median) generate N/A RevPAR.
- Strong performers (Top 25%) earn N/A RevPAR.
- Best-in-class (Top 10%) achieve N/A RevPAR.
Average Monthly RevPAR Trend in St Mellion
RevPAR Insights for St Mellion
- RevPAR peaks in Jan and bottoms out in Jan, mirroring the broader seasonal demand pattern and suggesting opportunities for dynamic pricing.
Recommendations for Hosts
- Track your own RevPAR monthly against these St Mellion benchmarks. If your RevPAR falls below the median of N/A, examine whether low occupancy or low ADR is the primary drag.
- Use RevPAR rather than revenue alone when comparing properties of different sizes — it normalizes for available nights and gives a more accurate picture of performance.
Get Live St Mellion Market Intelligence 👇
Explore Real-time Analytics
When Is the Peak Season for Airbnb in St Mellion?
St Mellion's peak Airbnb season falls in August, May, July, while the softest stretch is October, November, December. Overall, the market shows highly seasonal trends requiring careful strategy, which should guide pricing, minimum stays, and cash-flow planning.
Peak Season (August, May, July)
- Revenue averages $3,260 per month
- Occupancy rates average 45.8%
- Daily rates average $311
Shoulder Season
- Revenue averages $1,781 per month
- Occupancy maintains around 29.0%
- Daily rates hold near $266
Low Season (October, November, December)
- Revenue drops to average $1,133 per month
- Occupancy decreases to average 18.7%
- Daily rates adjust to average $311
Seasonality Insights for St Mellion
- Airbnb seasonality in St Mellion is pronounced. Revenue swings sharply between peak and low months, which means pricing strategy, minimum-stay settings, and cash reserves all need to account for extended slower periods.
- During the high season, the absolute peak month showcases St Mellion's highest earning potential, with monthly revenues climbing to $4,048, occupancy reaching 60.9%, and ADRs peaking at $334.
- Conversely, the slowest single month marks the market's lowest point — revenue may dip to $920, occupancy could drop to 13.5%, and ADRs may adjust to $209.
- Lower occupancy paired with meaningful seasonality means hosts in St Mellion need to maximize every peak-season booking and seriously consider whether off-season pricing adjustments or minimum-stay changes can capture incremental revenue.
Seasonal Strategies for Maximizing Profit
- Peak Season: Maximize revenue through premium pricing. In a high-regulation market like St Mellion, ensure your permit covers the number of nights you plan to book — some jurisdictions cap annual rental days.
- Low Season: Offer competitive pricing, extended-stay discounts, and flexible cancellation policies. Target off-season travelers like remote workers, budget-conscious guests, and travelers with flexible schedules.
- Shoulder Seasons: Implement dynamic pricing that bridges peak and low rates. Target weekend travelers, local events, and business visitors. Slightly more flexible terms than peak season can help maintain occupancy without deep discounting.
- In a highly seasonal market like St Mellion, building a cash reserve during the top months is essential for covering fixed costs during the slow period. Automated pricing tools can help capture demand shifts in real time.
Do You Need a License for Airbnb in St Mellion?
Yes, St Mellion, England, United Kingdom enforces high STR regulations and 64% of active listings show registration evidence — indicating that enforcement is active and compliance is a prerequisite for operating legally. Hosts entering this market should budget for permit fees, inspections, and potential occupancy tax obligations as part of their startup costs. Always verify the latest short-term rental regulations and Airbnb license requirements directly with local government authorities for St Mellion to ensure full compliance before hosting.
(Source: AirROI data, 2026, based on 64% licensed listings)
What Are the Best Neighborhoods for Airbnb in St Mellion?
With a compact short-term rental market, St Mellion gives early-mover hosts an advantage in the right neighborhoods. The areas listed below are where guest demand and local attractions converge — a useful lens for investors evaluating whether to enter this market and where to position their listing.
| Neighborhood / Area | Why Host Here? (Target Guests & Appeal) | Key Attractions & Landmarks |
|---|---|---|
| St Mellion Golf Club | One of the premier golf resorts in the UK, attracting golf enthusiasts and tourists looking for an active getaway. The stunning scenery and luxurious amenities make it ideal for hosting. | St Mellion Golf Club, Mellow Park, The Tamar Valley, St. Dominick Church, The Caradon Hill Area of Outstanding Natural Beauty |
| Hendra, | A charming village atmosphere that offers a peaceful retreat for visitors looking to explore the nearby countryside and coast. Ideal for families and nature lovers. | Hendra Mill, Local walking trails, St Dolote's Church, Hendre Rhos Farm, Local pubs |
| The Tamar Valley | A designated Area of Outstanding Natural Beauty, this location offers stunning riverside views and is a great spot for outdoor activities, making it attractive to nature lovers and adventurers. | Tamar Valley AONB, Copper Mine Trails, Tamar Trails Centre, Cotehele House and Gardens, Mount Edgcumbe House and Country Park |
| Plymouth | A historic city with rich maritime heritage, great dining, and shopping experiences. Close enough for day trips and ideal for tourists seeking urban excitement. | Mayflower Steps, Plymouth Hoe, National Marine Aquarium, Royal William Yard, The Box |
| Saltash | A picturesque town located on the banks of the river Tamar, offering beautiful views and historical sites. An appealing location for tourists looking for a mix of history and nature. | Royal Albert Bridge, Saltash Waterside, Saltash Town Centre, Eagle House, St. Stephens Church |
| Callington | A quaint market town offering a rich history and proximity to various outdoor activities. Attracts families and those looking for a relaxed pace of life. | Callington Heritage Centre, Tamar Valley Centre, Kit Hill Country Park, Callington Market, St. Mary’s Church |
| Cardinham Woods | Known for its scenic beauty and excellent walking trails, it is a favorite spot for outdoors enthusiasts, providing a tranquil escape for visitors. | Cardinham Woods, Cycling trails, Woodland walks, Cafés, Picnic areas |
| Bodmin Moor | A rugged and dramatic landscape attracts hikers and nature enthusiasts. Perfect for travelers looking to explore the unspoiled Cornish countryside. | Bodmin Moor, Brown Willy, Dozmary Pool, Siblyback Lake, Minions |
Because St Mellion has a high regulation profile, confirming that short-term rental permits are available in your target neighborhood is a critical first step before committing to a property purchase. Regulation can vary at the neighborhood or district level even within the same city.
What Types of Properties Are on Airbnb in St Mellion?
Room Type Distribution
Property Type Distribution
Market Composition Insights for St Mellion
- The St Mellion Airbnb market composition is heavily skewed towards Entire Home/Apt listings, which make up 100% of the 25 active rentals. This indicates strong guest preference for privacy and space.
- Looking at the property type distribution in St Mellion, House properties are the most common (100%), reflecting the local real estate landscape.
- Houses represent a significant 100% portion, catering likely to families or larger groups.
St Mellion Airbnb Room Capacity Analysis (2026): Bedroom Distribution
Distribution of Listings by Number of Bedrooms
Room Capacity Insights for St Mellion
- The dominant room capacity in St Mellion is 2 bedrooms listings, making up 64% of the market. This suggests a strong demand for properties suitable for couples or solo travelers.
- Together, 2 bedrooms and 3 bedrooms properties represent 100.0% of the active Airbnb listings in St Mellion, indicating a high concentration in these sizes.
- A significant 36.0% of listings offer 3+ bedrooms, catering to larger groups and families seeking more space in St Mellion.
St Mellion Vacation Rental Guest Capacity Trends (2026)
Distribution of Listings by Guest Capacity
Guest Capacity Insights for St Mellion
- The most common guest capacity trend in St Mellion vacation rentals is listings accommodating 4 guests (56%). This suggests the primary traveler segment is likely small families or groups.
- Properties designed for 4 guests and 6 guests dominate the St Mellion STR market, accounting for 92.0% of listings.
- 36.0% of properties accommodate 6+ guests, serving the market segment for larger families or group travel in St Mellion.
- On average, properties in St Mellion are equipped to host 4.6 guests.
What Amenities Do Airbnb Guests Expect in St Mellion?
Amenity Prevalence
Amenity Insights for St Mellion
- Essential amenities in St Mellion that guests expect include: Washer, Cooking basics, Essentials, Smoke alarm, Kitchen, Heating, TV, Free parking on premises, Wifi, High chair. Lacking these (any) could significantly impact bookings.
Recommendations for Hosts
- Ensure your listing includes all essential amenities for St Mellion: Washer, Cooking basics, Essentials, Smoke alarm, Kitchen, Heating, TV, Free parking on premises, Wifi, High chair.
- Prioritize adding missing essentials: High chair.
- Highlight unique or less common amenities you offer (e.g., hot tub, dedicated workspace, EV charger) in your listing description and photos.
- Regularly check competitor amenities in St Mellion to stay competitive.
Dive Deeper: Advanced St Mellion STR Market Data (2026)
Ready to unlock more insights? AirROI provides access to advanced metrics and comprehensive Airbnb data for St Mellion. Explore detailed analytics beyond this report to refine your investment strategy, optimize pricing, and maximize your vacation rental profits.
Explore Advanced MetricsSt Mellion Airbnb Guest Demographics & Profile Analysis (2026)
Guest Profile Summary for St Mellion
- The typical guest profile for Airbnb in St Mellion consists of primarily domestic travelers (84%), often arriving from nearby London, typically belonging to the Post-2000s (Gen Z/Alpha) group (50%), primarily speaking English or Spanish.
- Domestic travelers account for 84.0% of guests.
- Key international markets include United Kingdom (84%) and Belgium (4%).
- Top languages spoken are English (77.8%) followed by Spanish (11.1%).
- A significant demographic segment is the Post-2000s (Gen Z/Alpha) group, representing 50% of guests.
Recommendations for Hosts
- Target domestic marketing efforts towards travelers from London and England.
- Tailor amenities and listing descriptions to appeal to the dominant Post-2000s (Gen Z/Alpha) demographic (e.g., highlight fast WiFi, smart home features, local guides).
- Highlight unique local experiences or amenities relevant to the primary guest profile.
- Consider seasonal promotions aligned with peak travel times for key origin markets.
St Mellion Airbnb Booking Patterns (2026): Available vs. Booked Days
Available Days Distribution
Booked Days Distribution
Booking Pattern Insights for St Mellion
- The most common availability pattern in St Mellion falls within the 271-366 days range, representing 72% of listings. This suggests many properties have significant open periods on their calendars.
- Approximately 100.0% of listings show high availability (181+ days open annually), indicating potential for increased bookings or specific owner usage patterns.
- For booked days, the 1-30 days range is most frequent in St Mellion (68%), reflecting common guest stay durations or potential owner blocking patterns.
How Far in Advance Do Guests Book Airbnb in St Mellion?
Average Booking Lead Time by Month
Booking Lead Time Insights for St Mellion
- The overall average booking lead time for vacation rentals in St Mellion is 61 days.
- Guests book furthest in advance for stays during July (average 131 days), likely coinciding with peak travel demand or local events.
- The shortest booking windows occur for stays in November (average 10 days), indicating more last-minute travel plans during this time.
- Seasonally, Summer (118 days avg.) sees the longest lead times, while Winter (50 days avg.) has the shortest, reflecting typical travel planning cycles.
Recommendations for Hosts
- Use the overall average lead time (61 days) as a baseline for your pricing and availability strategy in St Mellion.
- For July stays, consider implementing length-of-stay discounts or slightly higher rates for bookings made less than 131 days out to capitalize on advance planning.
- During November, focus on last-minute booking availability and promotions, as guests book with very short notice (10 days avg.).
- Target marketing efforts for the Summer season well in advance (at least 118 days) to capture early planners.
- Monitor your own booking lead times against these St Mellion averages to identify opportunities for dynamic pricing adjustments.
St Mellion Airbnb Minimum Stay Requirements Analysis
Distribution of Listings by Minimum Night Requirement
2 Nights
16 listings
64% of total
3 Nights
2 listings
8% of total
4-6 Nights
5 listings
20% of total
30+ Nights
2 listings
8% of total
Key Insights
- The most prevalent minimum stay requirement in St Mellion is 2 Nights, adopted by 64% of listings. This highlights the market's preference for shorter, flexible bookings.
- A strong majority (64.0%) of the St Mellion Airbnb data shows acceptance of very short stays (1-2 nights), indicating a dynamic, high-turnover market.
Recommendations
- Align with the market by considering a 2 Nights minimum stay, as 64% of St Mellion hosts use this setting.
- A 2-night minimum appears standard (64%). Consider this for weekends or peak periods.
- Explore offering discounts for stays of 30+ nights to attract the 8% of the market seeking extended stays.
- Adjust minimum nights based on seasonality – potentially shorter during low season and longer during peak demand periods in St Mellion.
St Mellion Airbnb Cancellation Policy Trends Analysis (2026)
Super Strict 60 Days
16 listings
66.7% of total
Moderate
2 listings
8.3% of total
Firm
1 listings
4.2% of total
Strict
5 listings
20.8% of total
Cancellation Policy Insights for St Mellion
- The prevailing Airbnb cancellation policy trend in St Mellion is Super Strict 60 Days, used by 66.7% of listings.
- There's a relatively balanced mix between guest-friendly (8.3%) and stricter (25.0%) policies, offering choices for different guest needs.
Recommendations for Hosts
- Consider adopting a Super Strict 60 Days policy to align with the 66.7% market standard in St Mellion.
- Regularly review your cancellation policy against competitors and market demand shifts in St Mellion.
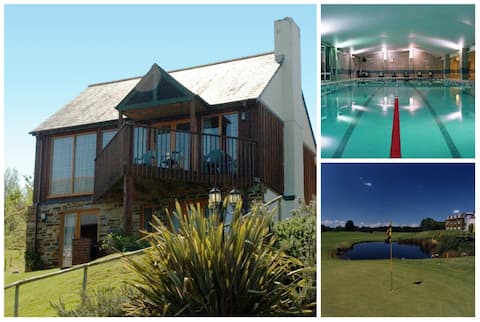
What Do the Top Airbnb Listings in St Mellion Look Like?
Benchmark your potential! Explore examples of top-performing Airbnb properties in St Mellionbased on Trailing Twelve Month (TTM) revenue. Analyze their characteristics, revenue, occupancy rate, and ADR to understand what drives success in this market.
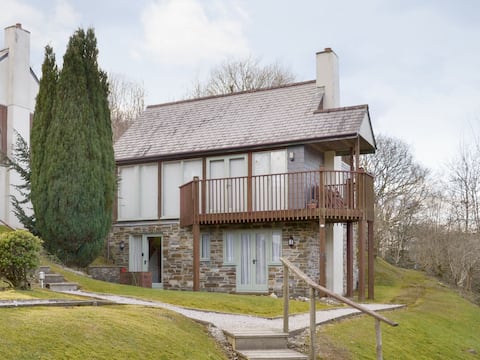
Eagles Nest
Entire Place • 3 bedrooms

Lovely 3 bed, 3 bath detached lodge by St Mellion
Entire Place • 3 bedrooms

Fab House with FREE Pool/Spa, Golf & Gym
Entire Place • 3 bedrooms
The Gallery no.2 Oakridge St Mellion - free golf
Entire Place • 3 bedrooms

Sunningdale Lodge,St Mellion,Cornwall-FreeGolf&Spa
Entire Place • 2 bedrooms

Luxurious 2 bed lodge in tranquil woodland setting
Entire Place • 2 bedrooms
Note: Performance varies based on location, size, amenities, seasonality, and management quality. Data reflects the past 12 months.
Who Are the Top Airbnb Hosts in St Mellion?
Learn from the best! This table showcases top-performing Airbnb hosts in St Mellion based on the number of properties managed and estimated total revenue over the past year. Analyze their scale and performance metrics.
| Host Name | Properties | Grossing Revenue | Stay Reviews | Avg Rating |
|---|---|---|---|---|
| Host #529014181 | 16 | $68,722 | 0 | Not Rated |
| Host #176974557 | 1 | $36,285 | 1 | Not Rated |
| Sally | 1 | $30,432 | 62 | 4.81/5.0 |
| Frances | 2 | $27,170 | 48 | 4.83/5.0 |
| Denise | 1 | $25,310 | 31 | 4.97/5.0 |
| Teresa | 1 | $20,405 | 72 | 4.94/5.0 |
| Nicolette | 1 | $16,939 | 10 | 4.70/5.0 |
| Alison | 1 | $14,872 | 75 | 4.89/5.0 |
| Paul | 1 | $12,514 | 19 | 4.89/5.0 |
Analyzing the strategies of top hosts, such as their property selection, pricing, and guest communication, can offer valuable lessons for optimizing your own Airbnb operations in St Mellion.
How Does St Mellion's Airbnb Market Compare to Nearby Cities?
How does the St Mellion Airbnb market stack up against its neighbors? Compare key performance metrics like average monthly revenue, ADR, and occupancy rates in surrounding areas to understand the broader regional STR landscape.
Compared with Redberth, St Mellion has 31 percentage points lower occupancy and about $1 higher ADR. That helps frame whether this market is winning more on demand, pricing, or both.
| Market | Active Properties | Monthly Revenue | Daily Rate | Avg. Occupancy |
|---|---|---|---|---|
| Angle | 13 | $4,736 | $388.09 | 42% |
| Llanrhidian | 16 | $4,549 | $389.81 | 53% |
| Crai | 24 | $4,358 | $381.23 | 45% |
| Trenance | 22 | $4,110 | $499.73 | 44% |
| Redberth | 31 | $3,805 | $237.82 | 55% |
| Milverton | 10 | $3,729 | $350.77 | 41% |
| Llantrisant | 15 | $3,722 | $276.67 | 43% |
| Ludchurch | 17 | $3,644 | $377.29 | 39% |
| Dinas Powys | 10 | $3,511 | $277.05 | 48% |
| Churchinford | 10 | $3,461 | $216.70 | 46% |
Frequently Asked Questions About Airbnb in St Mellion
These quick answers summarize the most common investor and operator questions using AirROI's latest market data for St Mellion.
How much do Airbnb hosts make in St Mellion?
St Mellion hosts earn about $10,106 per year on average, with an average nightly rate of $239 and RevPAR of N/A. Those figures describe the typical revenue environment for active listings in St Mellion, England, not the ceiling for the best operators. Source: AirROI 2025 data, St Mellion market, June 2024 to May 2025.
What is the average Airbnb occupancy rate in St Mellion?
The average Airbnb occupancy rate in St Mellion is 23.9%. August is the strongest month and November is the softest, so hosts should expect demand to move meaningfully throughout the year rather than stay flat.
What is the average Airbnb daily rate in St Mellion?
Listings in St Mellion average $239 per night. The broader pricing spread also matters: lower-performing listings cluster closer to the lower quartiles, while premium homes can price materially above the city average when demand spikes or listing quality stands out.
How many Airbnb listings are active in St Mellion?
St Mellion currently has about 25 active Airbnb listings in AirROI's market dataset. That supply count helps explain how competitive the market is, how much depth there is for benchmarking, and whether the market behaves like a niche destination or a scaled urban market.
How strict are short-term rental regulations in St Mellion?
AirROI currently classifies the short-term rental regulation level in St Mellion as High. The dataset also shows about 64.0% of listings with registration evidence. That is a market signal, not legal advice, so hosts should still confirm current licensing and compliance rules locally before listing.
What is the RevPAR for Airbnb in St Mellion?
RevPAR in St Mellion is about N/A. That metric combines pricing and occupancy into one efficiency number, so it is often a better quick benchmark than ADR alone when investors want to compare how well listings convert nightly rates into realized revenue.
Is Airbnb profitable in St Mellion?
Occupancy of 23.9% means St Mellion is a more selective market. Profitability is achievable but requires careful cost management, premium positioning, or targeting longer stays to reduce turnover. Average annual revenue is $10,106, but individual returns depend on property type, location within the city, and the host's operating efficiency.
How far in advance do guests book Airbnb in St Mellion?
The average booking lead time in St Mellion is about 61 days — a longer planning horizon typical of destination or vacation markets where travelers book well in advance. Hosts who understand their market's booking cadence can adjust minimum stays and pricing windows accordingly.
What are the best neighborhoods for Airbnb in St Mellion?
Based on AirROI's analysis, some of the top neighborhoods for short-term rentals in St Mellion include St Mellion Golf Club, Hendra,, The Tamar Valley. Each area attracts different guest profiles — from business travelers to leisure visitors — so the best location depends on the property type and target audience a host is aiming for. See the full neighborhood breakdown above.
What type of property performs best on Airbnb in St Mellion?
entire_home listings make up 100.0% of the active supply in St Mellion. The most common configuration does not always mean the most profitable — operators who identify underserved property types or bedroom counts can sometimes outperform the market average by filling a gap in local supply.
How does St Mellion compare to nearby Airbnb markets?
Among neighboring markets, Angle posts $56,829 in average annual revenue with 41.8% occupancy, compared to St Mellion's $10,106 and 23.9%. Comparing nearby markets helps investors understand whether a destination's performance reflects local demand or broader regional trends.
When is the peak season for Airbnb in St Mellion?
August is the highest-revenue month in St Mellion, while November is the softest. The revenue spread between them indicates a highly seasonal market — revenue in the peak month is more than double the low month, so cash-flow planning and pricing automation are critical.
About AirROI Market Data
AirROI tracks over 20 million properties across 190+ countries and maintains 15+ years of historical performance data, making it one of the deepest Airbnb and STR intelligence platforms available. The analytics pipeline aggregates listing-level data monthly — revenue, occupancy, nightly rates, RevPAR, guest demographics, booking patterns, and competitive supply — so investors and operators can benchmark any market against its own history and against neighboring destinations.
Real estate investors, property managers, financial institutions, hedge funds, tourism boards, hospitality consultants, tech platforms, and academic researchers rely on AirROI data to underwrite acquisitions, optimize pricing, model macro trends, and conduct peer-reviewed research. Data is available through in-depth market reports like this one and the Airbnb API with 22 endpoints and an Airbnb MCP Server for AI agents.
AirROI proprietary analytics as of 2025-05-31. Metrics reflect trailing twelve-month aggregates from active listings. Revenue figures are market averages, not projections. Neighborhood descriptions are AI-generated and reviewed for accuracy. For full methodology, see the data methodology page.