
The Airbnb Rating Revenue Cliff: How 0.2 Stars Costs Hosts $9,267/Year
A 0.2-star difference between a 4.9 and a 4.7 Airbnb rating costs the average Nashville host $9,267 per year in lost revenue. That is not a typo, and it is not an edge case. AirROI's analysis of 18,072 active listings across Nashville, Sedona, Miami Beach, and Gatlinburg reveals a consistent, non-linear revenue cliff tied to review scores — where small rating drops trigger disproportionately large income losses. The airbnb rating revenue impact is not a gentle slope. It is a cliff, and most hosts standing on the edge have no idea how close they are.
In a 2026 short-term rental market where supply growth has slowed to 4.6% but competition for bookings has intensified, your review score is no longer a vanity metric. It is the single variable most tightly correlated with whether your listing thrives or slowly bleeds revenue. Here is the data.
The Revenue Cliff: What 18,000 Listings Reveal About Ratings and Income
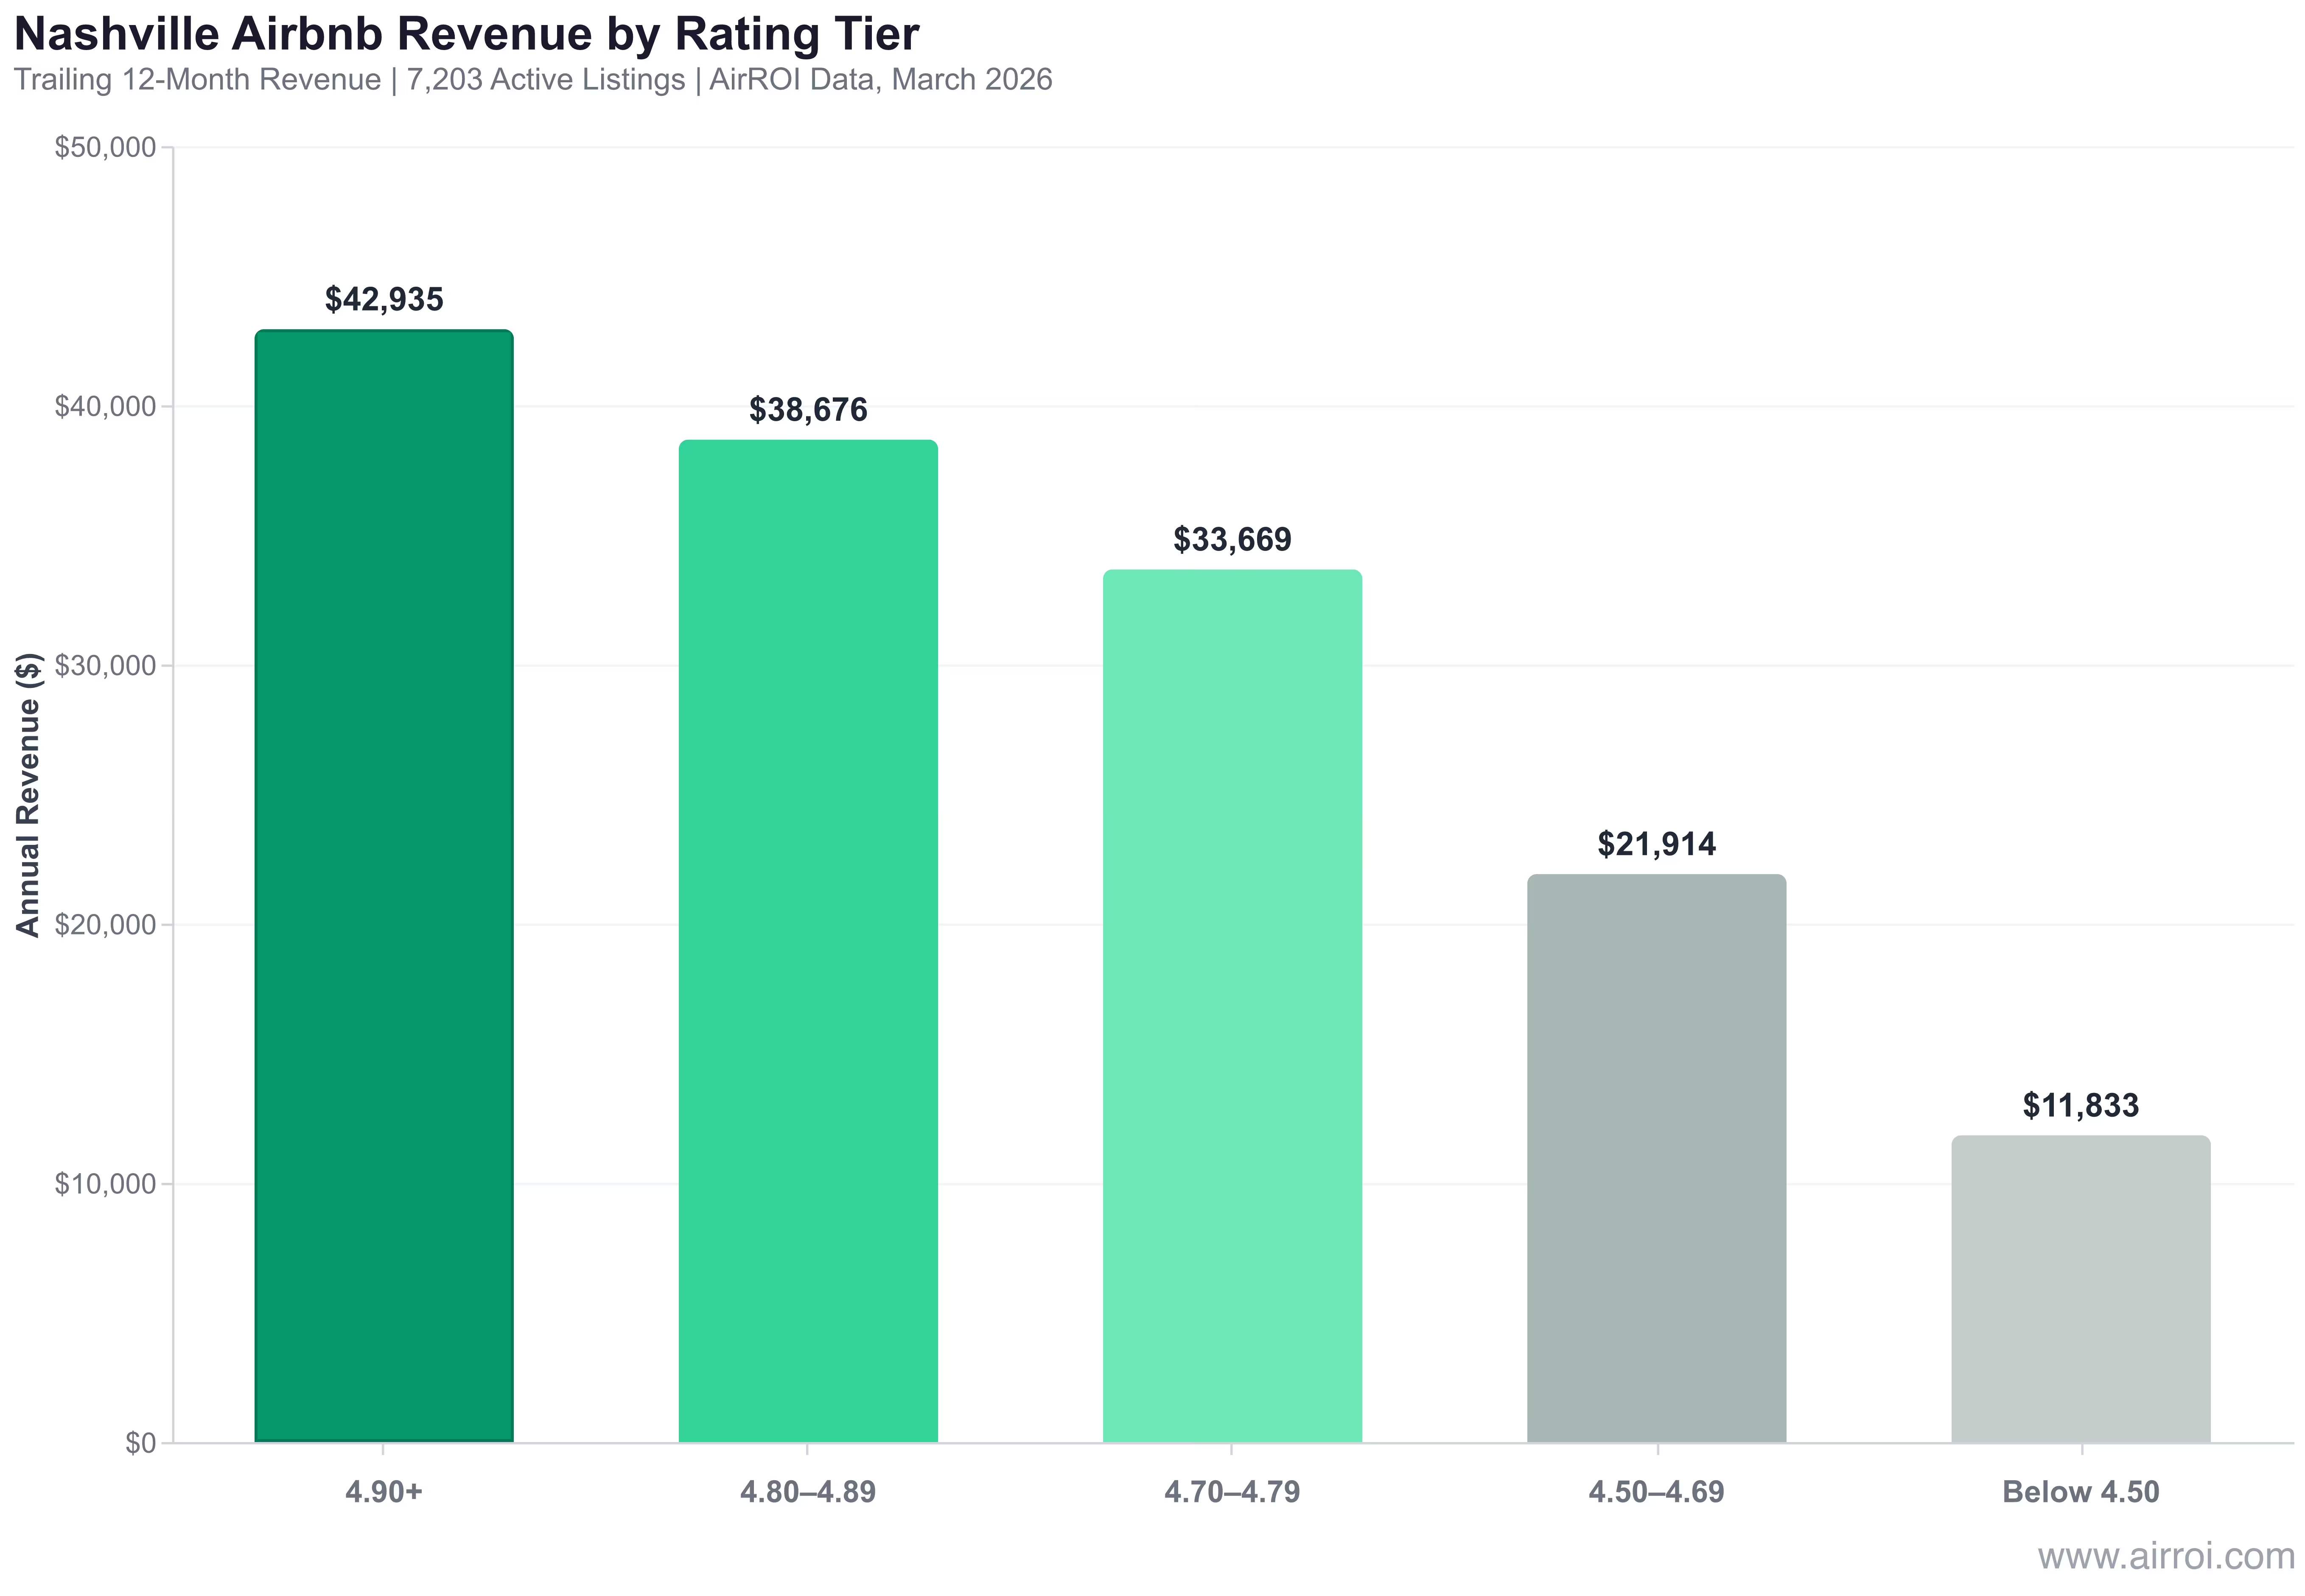
Listings rated 4.9 stars or above earn $42,935 per year in Nashville-Davidson — 22% more than listings in the 4.7 tier and 72% more than those rated below 4.5. The relationship between Airbnb star rating and revenue is not proportional. It accelerates.
AirROI segmented 7,203 active Nashville-Davidson listings into five rating tiers and compared their trailing-twelve-month (TTM) performance metrics. The results show a clear pattern: every metric — revenue, ADR, occupancy, and RevPAR — declines as ratings drop, but the rate of decline steepens with each step down.
| Rating Tier | Listings | TTM Revenue | ADR | Occupancy | RevPAR |
|---|---|---|---|---|---|
| 4.90+ | 3,019 | $42,935 | $365 | 50% | $175 |
| 4.80–4.89 | 1,674 | $38,676 | $340 | 48% | $158 |
| 4.70–4.79 | 844 | $33,669 | $332 | 45% | $147 |
| 4.50–4.69 | 659 | $21,914 | $307 | 41% | $123 |
| Below 4.50 | 372 | $11,833 | $263 | 34% | $92 |
Source: AirROI data, Nashville-Davidson TN, March 2026
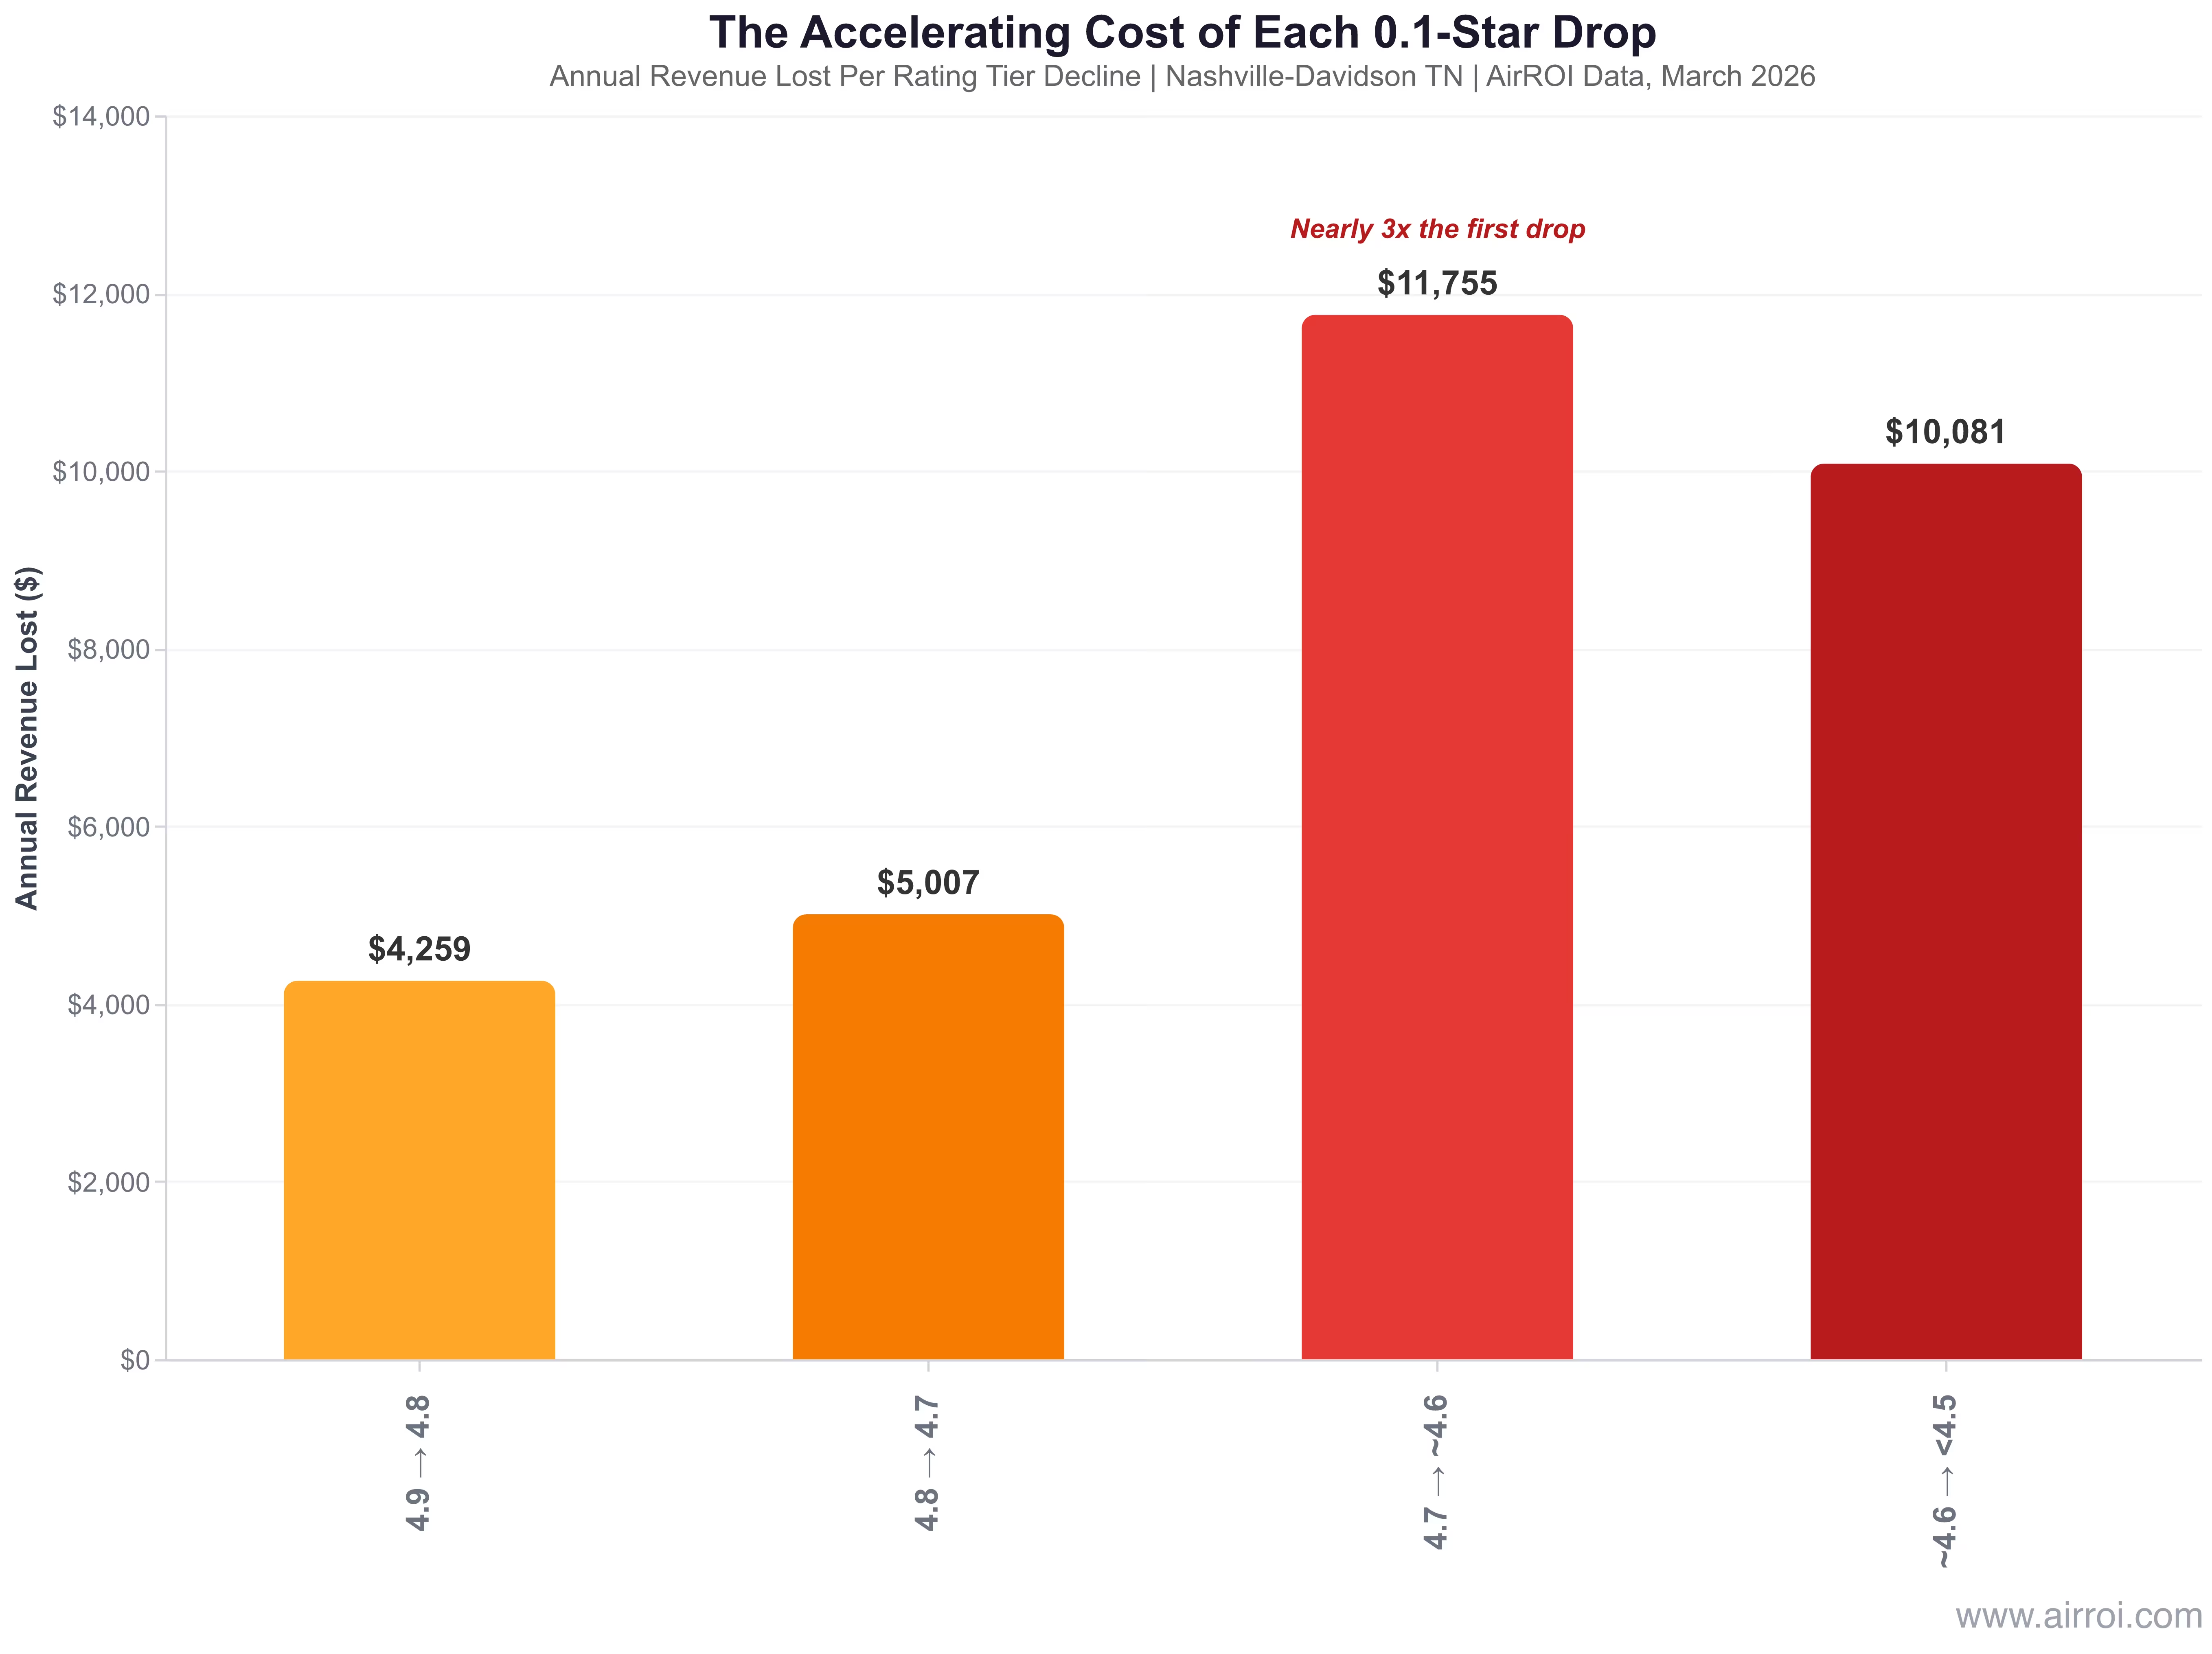
The drop from 4.9+ to 4.8 costs $4,259 per year — manageable, but noticeable. The drop from 4.8 to 4.7 costs $5,007. But the drop from 4.7 to the 4.5–4.69 range costs $11,755 — more than the previous two tiers combined. Below 4.5, listings earn just $11,833 annually, barely a quarter of what top-rated properties generate.
"A listing going from 4.8 to 4.9 gets a bigger visibility and booking boost than one going from 4.5 to 4.6, despite identical numerical improvements." — HostCamp, Airbnb Rating System Analysis, 2026
This non-linearity is the defining feature of the rating cliff effect. Each tenth of a star costs more than the last, creating a compounding penalty that accelerates as ratings decline.
Why the Cliff Exists: Algorithm, Badges, and Guest Behavior
The Airbnb algorithm evaluates over 800 signals when determining search ranking, and review ratings carry outsized weight. Three mechanisms compound to create the revenue cliff: the algorithm's tier system, badge-driven visibility, and guest filtering behavior.
The Guest Favorite Threshold: 4.9 Stars
Airbnb's Guest Favorite badge — awarded to listings with a 4.9+ overall rating, at least five reviews, and zero host cancellations — delivers measurable performance gains. According to industry analysis, badge holders see 40% more search appearances, a 52% higher click-through rate, and a booking conversion rate of 23% compared to 9% for non-badge listings. That 2.6x conversion advantage translates directly into the revenue premium AirROI data captures at the 4.9+ tier.
The Superhost Threshold: 4.8 Stars
The Bottom 10% Penalty: Below ~4.6
Airbnb actively flags listings in the bottom 10th percentile with a visible warning label. Community data from the Airbnb host forums shows this label produces near-zero booking conversion despite continued search impressions — guests see the flag and move on. According to research from Boston University, 86% of Airbnb listings score 4.5 stars or above, which means the platform's rating inflation compresses the meaningful performance range into a narrow 4.5–5.0 band. A 4.6 that might seem acceptable on a restaurant review site signals genuine problems in Airbnb's inflated ecosystem.
Guest Filter Behavior
The algorithm amplifies what guests already do instinctively. According to Airbnb's own Resource Center, better reviews and ratings lead directly to more bookings and higher earnings. Most guests filter by rating or rely on the Guest Favorite badge when choosing from dozens of options in a market. In Nashville, 3,019 listings (42% of the market) sit at 4.9+ — meaning a host at 4.7 is competing for attention against a wall of badge-adorned alternatives.
The Dollar Cost of Each 0.1-Star Drop
Each tenth of a star does not cost the same amount. The penalty accelerates as ratings decline, creating a compounding loss curve that punishes listings progressively harder the further they fall from 4.9.
Based on AirROI's Nashville data, here is what each 0.1-star drop costs in annual revenue:
| Rating Drop | Annual Revenue Lost | Cumulative Loss from 4.9 |
|---|---|---|
| 4.9 → 4.8 | $4,259 | $4,259 |
| 4.8 → 4.7 | $5,007 | $9,266 |
| 4.7 → ~4.6 | $11,755 | $21,021 |
| ~4.6 → <4.5 | $10,081 | $31,102 |
Source: AirROI data, Nashville-Davidson TN, March 2026
The acceleration is stark. Dropping from 4.9 to 4.8 costs $4,259 — roughly $12 per day. Dropping from 4.8 to 4.7 costs $5,007 — an 18% increase in the penalty. But crossing below 4.7 into the 4.5–4.69 range costs $11,755 — nearly triple the 4.9-to-4.8 penalty. The cliff is not gradual. It breaks sharply below the Superhost threshold.
Consider a Nashville host with a 3-bedroom downtown property rated 4.72 across 87 reviews. They price competitively at $320 per night. Their property is objectively similar to 4.9-rated competitors, but AirROI data shows that rating gap costs them $9,266 per year — the equivalent of losing 28 booked nights at their rate. The loss comes from two sources simultaneously: lower occupancy (45% versus 50%) and lower ADR ($332 versus $365). The rating cliff imposes a double penalty.
Does the Cliff Hit Every Market? Four Cities, One Answer
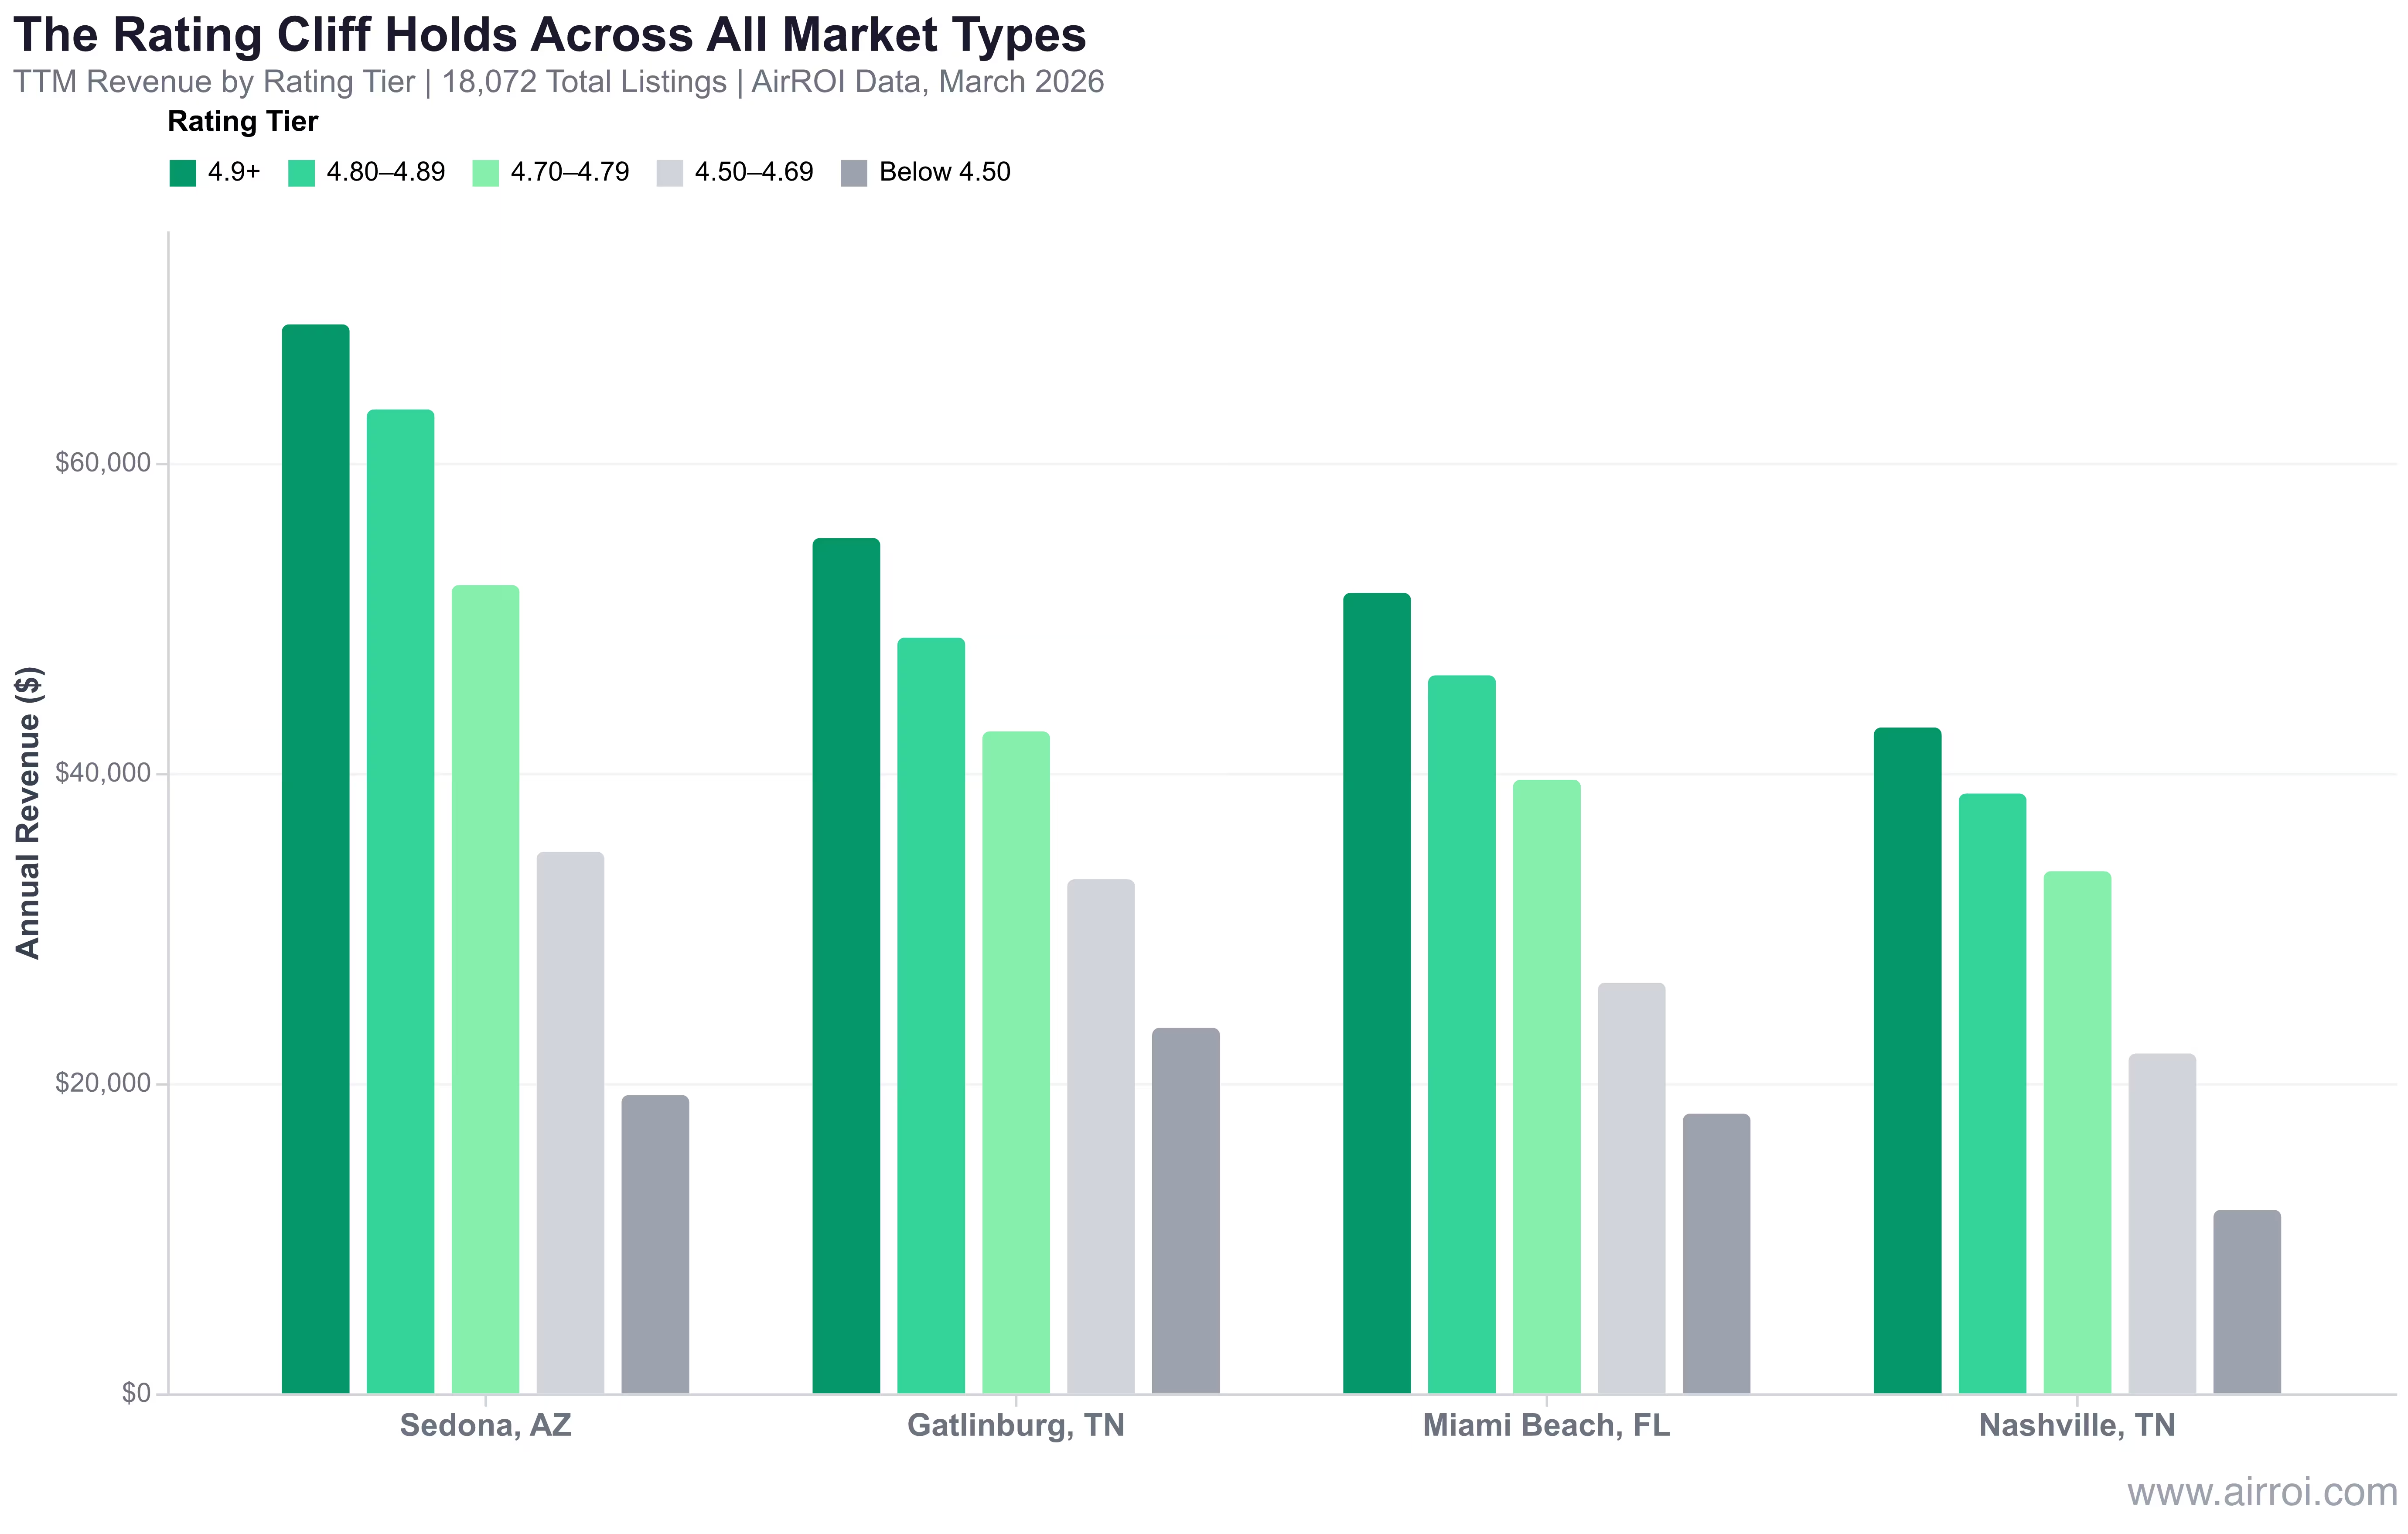
The revenue cliff is not a Nashville anomaly. AirROI data from four distinct market types — resort, urban, beach, and mountain — confirms the pattern holds everywhere, though the severity varies by market dynamics.
| Market | Type | 4.9+ Revenue | <4.5 Revenue | Revenue Gap | Gap % |
|---|---|---|---|---|---|
| Sedona, AZ | Resort | $68,930 | $19,232 | $49,698 | 72% |
| Nashville, TN | Urban | $42,935 | $11,833 | $31,103 | 72% |
| Miami Beach, FL | Beach | $51,616 | $18,037 | $33,579 | 65% |
| Gatlinburg, TN | Mountain | $55,151 | $23,569 | $31,582 | 57% |
Source: AirROI data, March 2026 | 18,072 total active listings across 4 markets
Gatlinburg's relatively shallower cliff (57%) likely reflects mountain cabin market dynamics, where destination-driven demand and unique property appeal partially insulate listings from pure rating-based filtering. Still, a 57% revenue gap between top and bottom tiers is hardly forgiving.
The occupancy data reveals an additional dimension. Sedona's top tier enjoys 57% occupancy versus 29% for the bottom — a 28-percentage-point spread. Miami Beach shows a tighter occupancy range (52% to 39%) but compensates with steep ADR sensitivity: the $520 ADR for 4.9+ listings versus $281 for sub-4.5 properties represents a $239 per-night pricing power gap.
"The low-hanging fruit of the post-pandemic travel boom has vanished, replaced by a market that rewards precision, quality, and hyperlocal agility." — PriceLabs, STR Professionalization Report, 2026
The Professionalization Gap: What Separates Top Earners in 2026
The airbnb review score analysis reveals something deeper than just algorithm mechanics. The rating cliff is a symptom of a widening professionalization divide in the short-term rental industry.
According to PriceLabs research analyzing 10,000+ listings, only 9% of Airbnb listings achieve a "Good" content quality rating — and those listings are 38% more likely to outperform their market average. Meanwhile, 88% of listings have measurable content issues that quietly erode visibility and bookings, even in professionally managed portfolios.
In 2026's saturated STR market, execution separates the top tier from the median. Properties with consistent 4.9+ ratings typically share three characteristics:
- Professional cleaning with documented checklists — not just clean, but verifiably, repeatably clean
- Proactive guest communication — response times under one hour, pre-arrival instructions, and mid-stay check-ins
- Accurate listing descriptions — photos, amenities, and descriptions that under-promise and over-deliver
These operational investments compound over time. Each 5-star review moves the rating upward, which improves search visibility, which generates more bookings, which produces more review opportunities. The flywheel works in reverse too — a few 4-star reviews trigger the cliff, reducing bookings and slowing the review velocity needed for recovery.
The Five-Category Recovery Playbook
Recovering from a rating decline requires understanding which category scores drive the most improvement. Airbnb's algorithm weights individual category scores (cleanliness, accuracy, check-in, communication, and value) twice as heavily as the overall rating. A single sub-4.5 cleanliness score can drop a listing 10 to 20 positions in search results, regardless of overall rating.
Here is a targeted recovery plan for each category, ranked by algorithm impact.
Cleanliness: The Highest-Weighted Category
Target: 4.9+ cleanliness score
Cleanliness drives more rating damage than any other category. Invest in professional cleaning ($100–$200 per turnover depending on property size), create a documented room-by-room checklist, and prioritize high-traffic areas: kitchen surfaces, bathroom fixtures, and bedroom linens. Do a personal walkthrough or hire an inspector before each check-in.
Accuracy: Under-Promise, Over-Deliver
Target: 4.9+ accuracy score
Accuracy complaints stem from a gap between what the listing promises and what the guest experiences. Update photos immediately after any renovation or change. Describe amenities conservatively — listing a "partial ocean view" when the view is partial prevents the disappointed 4-star review that comes from listing a "stunning ocean view." Remove any amenity from your listing that is not reliably functional.
Communication: Speed and Proactivity
Target: Sub-1-hour response time, 5-star communication score
According to Airbnb's Resource Center, timely communication is key to five-star hosting. Respond to booking inquiries and guest questions within one hour. Send a pre-arrival message 48 hours before check-in with clear instructions, parking details, and local recommendations. During the stay, a brief mid-stay check-in message ("Is everything as expected?") catches issues before they become complaints.
Check-In: Eliminate Friction
Target: Self-check-in with backup plan
Self-check-in with a smart lock or lockbox, paired with clear photo-illustrated instructions, eliminates the most common check-in friction. Always have a backup plan: if the smart lock fails, provide a physical key alternative or 24/7 phone support. First impressions set the rating trajectory for the entire stay.
Value: Align Price to Expectations
Target: Dynamic pricing that matches what you deliver
The Recovery Math
With 80+ existing reviews, each new 5-star review moves your overall average by approximately 0.02 stars. Recovering 0.1 star — the difference between losing and qualifying for Superhost — requires 10 to 15 consecutive 5-star reviews, typically spanning 2 to 4 months depending on booking volume. The key insight: you cannot review-count your way out of a quality problem. Fix the operational root cause first, then let the new reviews accumulate.
Frequently Asked Questions
A single bad review that drops your rating from 4.9 to 4.8 can cost approximately $4,259 per year in Nashville, based on AirROI data showing 4.9+ listings earn $42,935 annually versus $38,676 for the 4.8 tier. In high-ADR markets like Sedona, the same drop costs over $24,000 per year.
You need a 4.9+ overall rating, at least 5 reviews, zero host cancellations, and high marks across all six category scores. Guest Favorite listings see 40% more search appearances and convert bookings at 23% versus 9% for non-badge listings — a 2.6x advantage.
Yes. AirROI analysis of 18,000+ listings across four US markets shows a direct, non-linear correlation. Listings rated 4.9+ earn 22% more than those rated 4.7, and 72% more than those below 4.5, with corresponding gaps in occupancy and ADR.
Below 4.5 stars, listings risk the Bottom 10% label, which displays a visible warning to potential guests. Community data shows this results in near-zero booking conversion despite search impressions. Continued low ratings can lead to platform delisting.
With 80+ existing reviews, each new 5-star review moves your average by approximately 0.02 stars. Recovering 0.1 star requires 10 to 15 consecutive 5-star reviews, typically taking 2 to 4 months depending on booking volume and turnover frequency.