
Luxury Airbnb Investment 2026: Data Shows When the Premium Pays Off
A luxury Aspen listing priced at $1,192 per night generates $89,439 in annual revenue. A mid-range listing in the same market at $253 per night generates $32,628. The luxury property earns 2.7x more -- but costs 5x more to buy. That math problem is the entire story of luxury Airbnb investment in 2026.
Search "luxury airbnb" and every result is a booking page. Airbnb Luxe, Vrbo luxury collections, Plum Guide -- all transactional. Not a single result asks the question investors should be asking: does a $500+/night ADR actually translate to a better luxury vacation rental ROI than a well-positioned mid-range property? AirROI analyzed performance data across 10 markets -- Aspen, Napa Valley, the Hamptons, Palm Beach, Scottsdale, Nashville, San Diego, Portland, Mykonos, and Florence -- to answer that question with data, not assumptions.
The answer: luxury generates 2.2-4.7x more gross revenue in every market studied. In resort-destination markets with high luxury occupancy, that revenue premium is now large enough to overtake mid-range on gross yield. In appreciation-driven markets like Aspen and the Hamptons, mid-range still wins on income.
Defining Luxury for This Analysis
For this comparison, luxury means listings with a trailing-twelve-month average daily rate of $500 or more per night. This threshold captures genuine high-end properties -- architect-designed homes, waterfront estates, ski-in/ski-out chalets -- not merely "well-decorated" listings with slightly above-average pricing. Mid-range is defined as $150-$300 per night ADR, representing the core of the vacation rental market where most investor-owned properties compete.
The ADR-Occupancy Tradeoff: Higher Rates, Fewer Bookings
Luxury ADR runs 3-5x higher than mid-range, but occupancy consistently runs 1-11 percentage points lower (Napa Valley is the sole exception, with luxury occupancy 3 points above mid-range). AirROI data across all 10 markets confirms this pattern almost without exception.
| Market | Luxury ADR | Mid-Range ADR | Luxury Occ. | Mid-Range Occ. | Occ. Gap |
|---|---|---|---|---|---|
| Aspen, CO | $1,192 | $253 | 38% | 47% | -9 pts |
| Napa Valley, CA | $826 | $241 | 41% | 38% | +3 pts |
| Hamptons, NY | $1,205 | $245 | 36% | 40% | -4 pts |
| Palm Beach, FL | $733 | $227 | 35% | 46% | -11 pts |
| Scottsdale, AZ | $920 | $218 | 47% | 49% | -2 pts |
| Nashville, TN | $776 | $229 | 43% | 49% | -6 pts |
| San Diego, CA | $879 | $223 | 50% | 56% | -6 pts |
| Portland, OR | $733 | $202 | 48% | 55% | -7 pts |
| Mykonos, Greece | $1,138 | $229 | 42% | 47% | -5 pts |
| Florence, Italy | $756 | $207 | 50% | 51% | -1 pt |
The Hamptons illustrates the extreme case: luxury listings achieve the highest ADR in the dataset ($1,205) and among the lowest occupancies at 36% (only Palm Beach's 35% is lower). Barely a third of available nights are booked. The guest pool depth at $1,200+/night is simply narrow -- fewer travelers can or will pay that rate, regardless of property quality.
As one industry analysis from Awning noted: "Budget-friendly listings shine when it comes to steady cash flow. Their appeal to a broader audience often achieves higher occupancy rates year-round." The data validates this across 9 of 10 markets studied, with Napa being the sole exception where luxury occupancy (41%) slightly exceeds mid-range (38%).
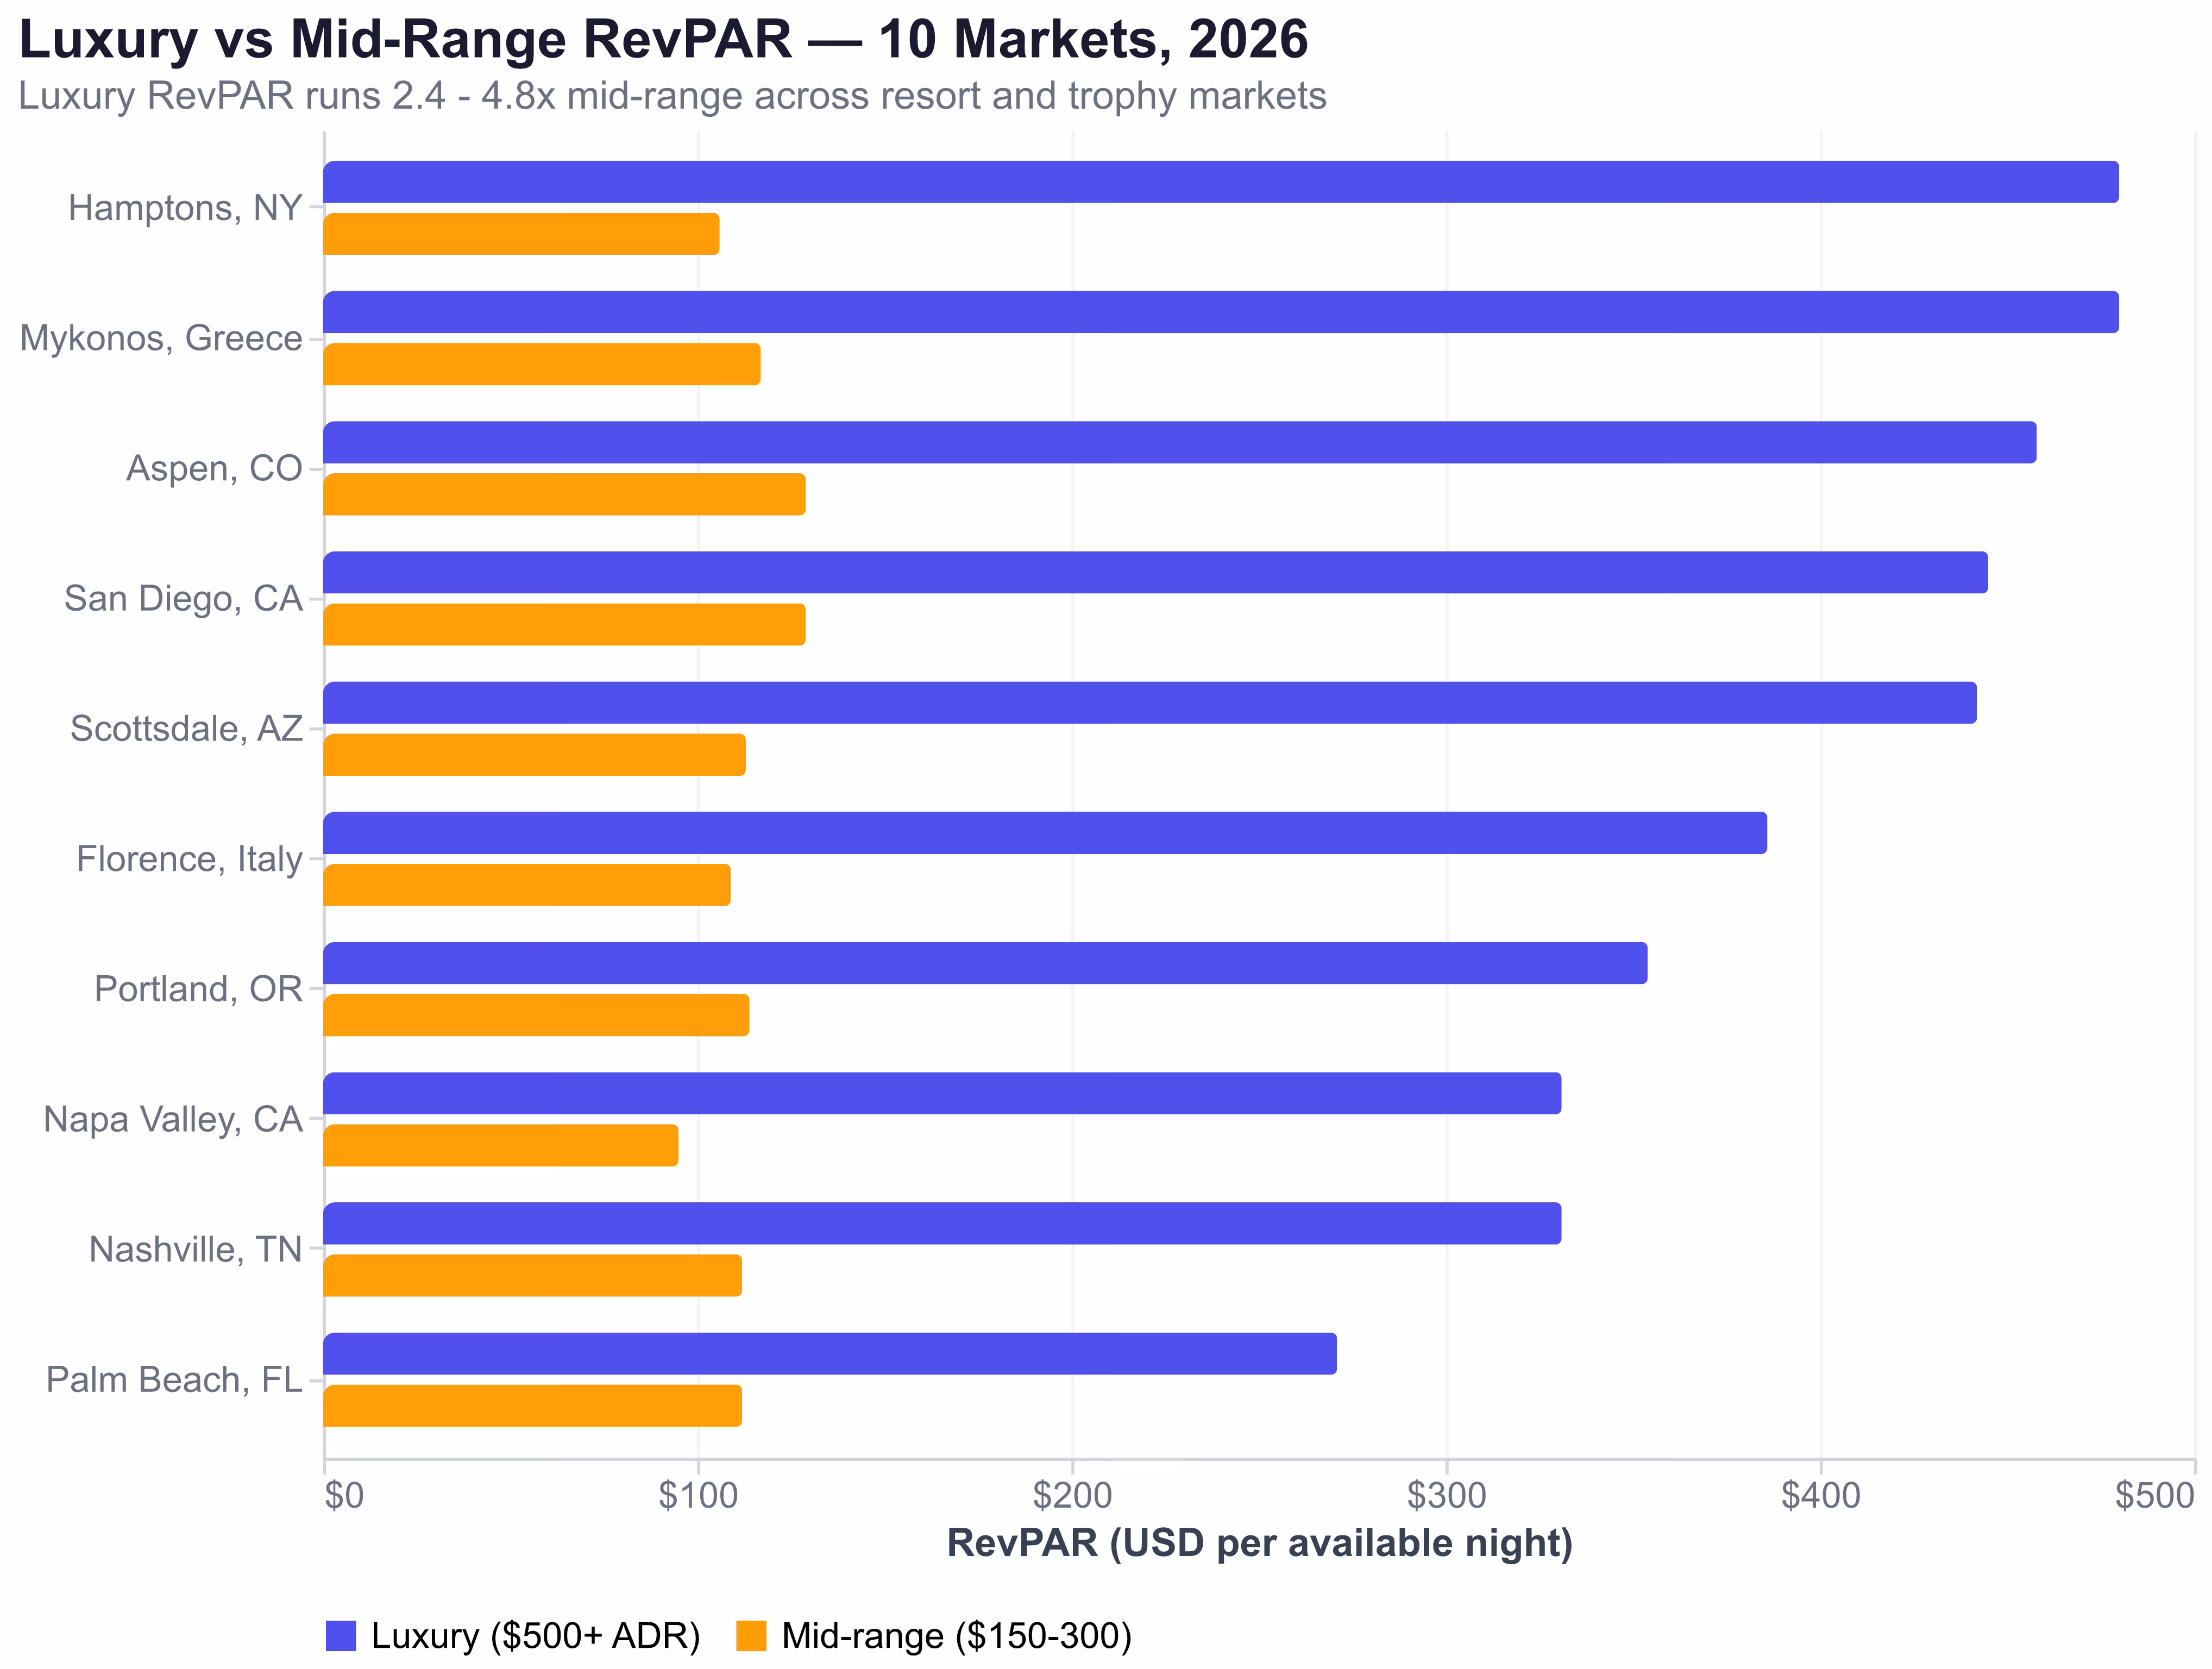
RevPAR: The Metric That Levels the Playing Field
RevPAR (Revenue Per Available Room-night) multiplies ADR by occupancy rate, revealing the actual daily earning power of a listing. It is the metric that strips away the illusion of high nightly rates and shows what a property actually earns per day of availability.
| Market | Luxury RevPAR | Mid-Range RevPAR | Luxury Revenue/Year | Mid-Range Revenue/Year |
|---|---|---|---|---|
| Aspen, CO | $458 | $129 | $89,439 | $32,628 |
| Napa Valley, CA | $331 | $95 | $77,513 | $19,687 |
| Hamptons, NY | $480 | $106 | $74,792 | $19,242 |
| Palm Beach, FL | $271 | $112 | $63,100 | $28,236 |
| Scottsdale, AZ | $442 | $113 | $115,792 | $24,703 |
| Nashville, TN | $331 | $112 | $96,925 | $31,520 |
| San Diego, CA | $445 | $129 | $117,856 | $33,602 |
| Portland, OR | $354 | $114 | $94,591 | $29,075 |
| Mykonos, Greece | $480 | $117 | $77,315 | $20,980 |
| Florence, Italy | $386 | $109 | $98,751 | $28,135 |
Where Luxury Pays Off: Scottsdale, San Diego, Nashville, and Portland
Four US markets stand out where luxury economics genuinely work on a gross-yield basis:
San Diego, CA achieves the highest luxury occupancy in the dataset at 50%, producing $117,856 in annual revenue -- the highest gross figure across all 10 markets. Year-round temperate weather, a deep business and leisure travel base, and La Jolla's established luxury positioning keep bookings steady through all four seasons.
Scottsdale, AZ delivers the strongest luxury investment case on yield. At $920/night ADR with 47% occupancy -- approaching mid-range levels -- Scottsdale luxury generates $115,792 in annual revenue. The desert resort market benefits from dual seasonality (winter snowbird season and spring event season), a concentrated wealth demographic, and a mature property management ecosystem that sustains luxury service standards.
Nashville, TN surprises with $96,925 in luxury annual revenue at 43% occupancy. The city's event-driven demand (CMA Fest, NFL draft weeks, bachelorette tourism) creates pricing spikes that luxury properties capture disproportionately. Large-format luxury properties (6+ bedrooms) serve group bookings at rates that, as Lodgify reports, "generate revenue from single bookings that match what multiple smaller properties produce, while earning 30-40% rate premiums."
Portland, OR joins the list with $94,591 in luxury annual revenue at 48% occupancy. Though volume is thin -- only ~83 luxury listings meet the $500+/night threshold -- those that do operate in a supply-constrained corner of a mature urban market. Luxury here edges out mid-range on gross yield on a cost-per-square-foot basis.
International Markets Where Luxury Thrives
Mykonos, Greece posts the highest RevPAR in the entire dataset at $480/night, driven by a $1,138 ADR and 42% occupancy. The Aegean island's status as a luxury destination attracts a global guest pool willing to pay extreme premiums during the June-September season. However, the off-season is virtually dead for luxury, creating a revenue concentration challenge.
Florence/Tuscany stands out for maintaining 50% luxury occupancy -- tied with San Diego for the highest rate. Year-round cultural tourism, art season, wine harvest, and a steady stream of affluent European travelers sustain demand even in winter months. Luxury villas in the Chianti region at $756/night ADR generate $98,751 annually -- the second-highest luxury revenue in the dataset.
Bali (Seminyak) offers an intriguing arbitrage: luxury ADR of $953/night on properties that cost a fraction of US luxury homes. Annual luxury revenue of $92,088 against acquisition costs potentially under $500,000 makes Bali one of the few international markets where luxury revenue-per-dollar-invested decisively outpaces mid-range. The tradeoff: foreign ownership restrictions, currency volatility, and operational complexity.
Where Mid-Range Still Wins: Aspen, the Hamptons, and the Volume Play
In appreciation-driven trophy markets, mid-range properties continue to deliver stronger income yields. The advantage is structural: entry costs scale faster than revenue once luxury acquisition costs climb into the $2-3M range, and a broader mid-range guest pool drives higher occupancy with lower operating costs.
Aspen, CO remains the clearest mid-range case. Luxury generates $89,439 annually on a $2.5M property (3.58% gross yield); the rare $500K mid-range listing generates $32,628 at 6.53% gross yield -- nearly double the yield on one-fifth the capital. Ski-town luxury is increasingly an appreciation bet, not an income bet.
The Hamptons presents the same math even more starkly. Luxury grosses $74,792 on $3M+ properties (2.49% gross yield) versus mid-range $19,242 on $600K properties (3.21% gross yield). Neither tier delivers strong income -- Hamptons investors are overwhelmingly betting on Manhattan-adjacent land values, not monthly cash flow.
High-occupancy urban markets (San Diego, Portland) still reward mid-range investors who prize consistency over scale. San Diego mid-range listings achieve 56% occupancy -- the highest rate in the entire dataset for either tier -- generating $33,602 on a $700,000 property (4.80% yield). That trails San Diego luxury's 6.55% yield, but the capital at risk is one-third. As Rabbu's analysis notes, "Successful investors today are seeing cash-on-cash returns between 10-15%, a shift from the 'gold rush' era of 20-30% returns." For first-time STR investors, consistency and lower downside still beat higher-yield speculation.
Revenue Per Dollar Invested: The Real ROI Calculation
Gross revenue means nothing without context. The investment question is: how much revenue does each dollar of invested capital generate?
| Market | Luxury Property Value (Est.) | Luxury Gross Yield | Mid-Range Property Value (Est.) | Mid-Range Gross Yield |
|---|---|---|---|---|
| Aspen, CO | $2,500,000 | 3.6% | $500,000 | 6.5% |
| Hamptons, NY | $3,000,000 | 2.5% | $600,000 | 3.2% |
| Scottsdale, AZ | $1,200,000 | 9.7% | $450,000 | 5.5% |
| Nashville, TN | $1,000,000 | 9.7% | $450,000 | 7.0% |
| San Diego, CA | $1,800,000 | 6.5% | $700,000 | 4.8% |
| Portland, OR | $1,500,000 | 6.3% | $500,000 | 5.8% |
The numbers now tell a different story than 2024's conventional wisdom. Luxury gross yield exceeds mid-range in 4 of 6 markets with explicit valuation data: Scottsdale, Nashville, San Diego, and Portland. Aspen and the Hamptons remain mid-range territory on income -- luxury there is a pure appreciation play with sub-4% gross yields.
The shift is driven by a specific dynamic: in resort-destination markets with deep wealthy guest pools, luxury occupancy (47-50%) now approaches mid-range (49-56%), compressing the occupancy gap that historically sank luxury's risk-adjusted returns. Meanwhile, luxury revenue scales proportionally to the ADR premium, so a 4x ADR multiplier translates into roughly 3-4x revenue -- and only 2.5-3x the acquisition cost in these markets.
Factor in the furnishing cost differential -- $60,000-$100,000+ for luxury versus $15,000-$25,000 for mid-range, according to Rabbu's investment analysis -- and the picture remains favorable for luxury in resort markets but hostile in trophy markets. A luxury Aspen investor has $2.585M at risk earning $89,439 (3.46% capital yield including furnishings). A Nashville luxury investor has $1.08M at risk earning $96,925 (8.97% capital yield). Same strategy, opposite outcomes.
The Hidden Cost Layer: Why Luxury Operating Expenses Erode the ADR Premium
The gross revenue gap between luxury and mid-range narrows further at the net income level. Luxury properties carry a structurally higher cost burden across every operating category.
Property management fees for luxury properties typically run 25-35% of revenue, reflecting the higher service expectations (concierge coordination, premium vendor networks, design-standard maintenance). Mid-range properties operate efficiently at 15-20% management fees. On $115,792 in Scottsdale luxury revenue, 30% management consumes $34,738 -- versus $4,941 at 20% on $24,703 mid-range revenue.
Insurance premiums for luxury STRs range from $5,000-$15,000 annually, approximately 2-3x the $2,000-$5,000 range for mid-range properties. Higher property values, expensive furnishings, and liability exposure from amenities like pools, hot tubs, and outdoor fire features drive the premium.
Amenity maintenance creates an ongoing cost layer that mid-range properties rarely face: pool service ($150-$300/month), smart home system maintenance, high-end appliance repair, landscape upkeep for estate-quality grounds, and periodic furnishing refresh every 3-5 years to maintain the luxury positioning.
The cumulative effect: operating costs consume an estimated 45-55% of luxury gross revenue versus 35-45% for mid-range. A luxury Scottsdale property grossing $116,000 may net $52,000-$64,000 before debt service. A mid-range property grossing $25,000 may net $13,750-$16,250. The gross revenue ratio (4.7x) compresses to a net income ratio of approximately 3.6x -- on a property costing 2.7x more. Even after operating costs erode the luxury premium, the net-income-per-dollar-invested math favors luxury in the strongest occupancy markets.
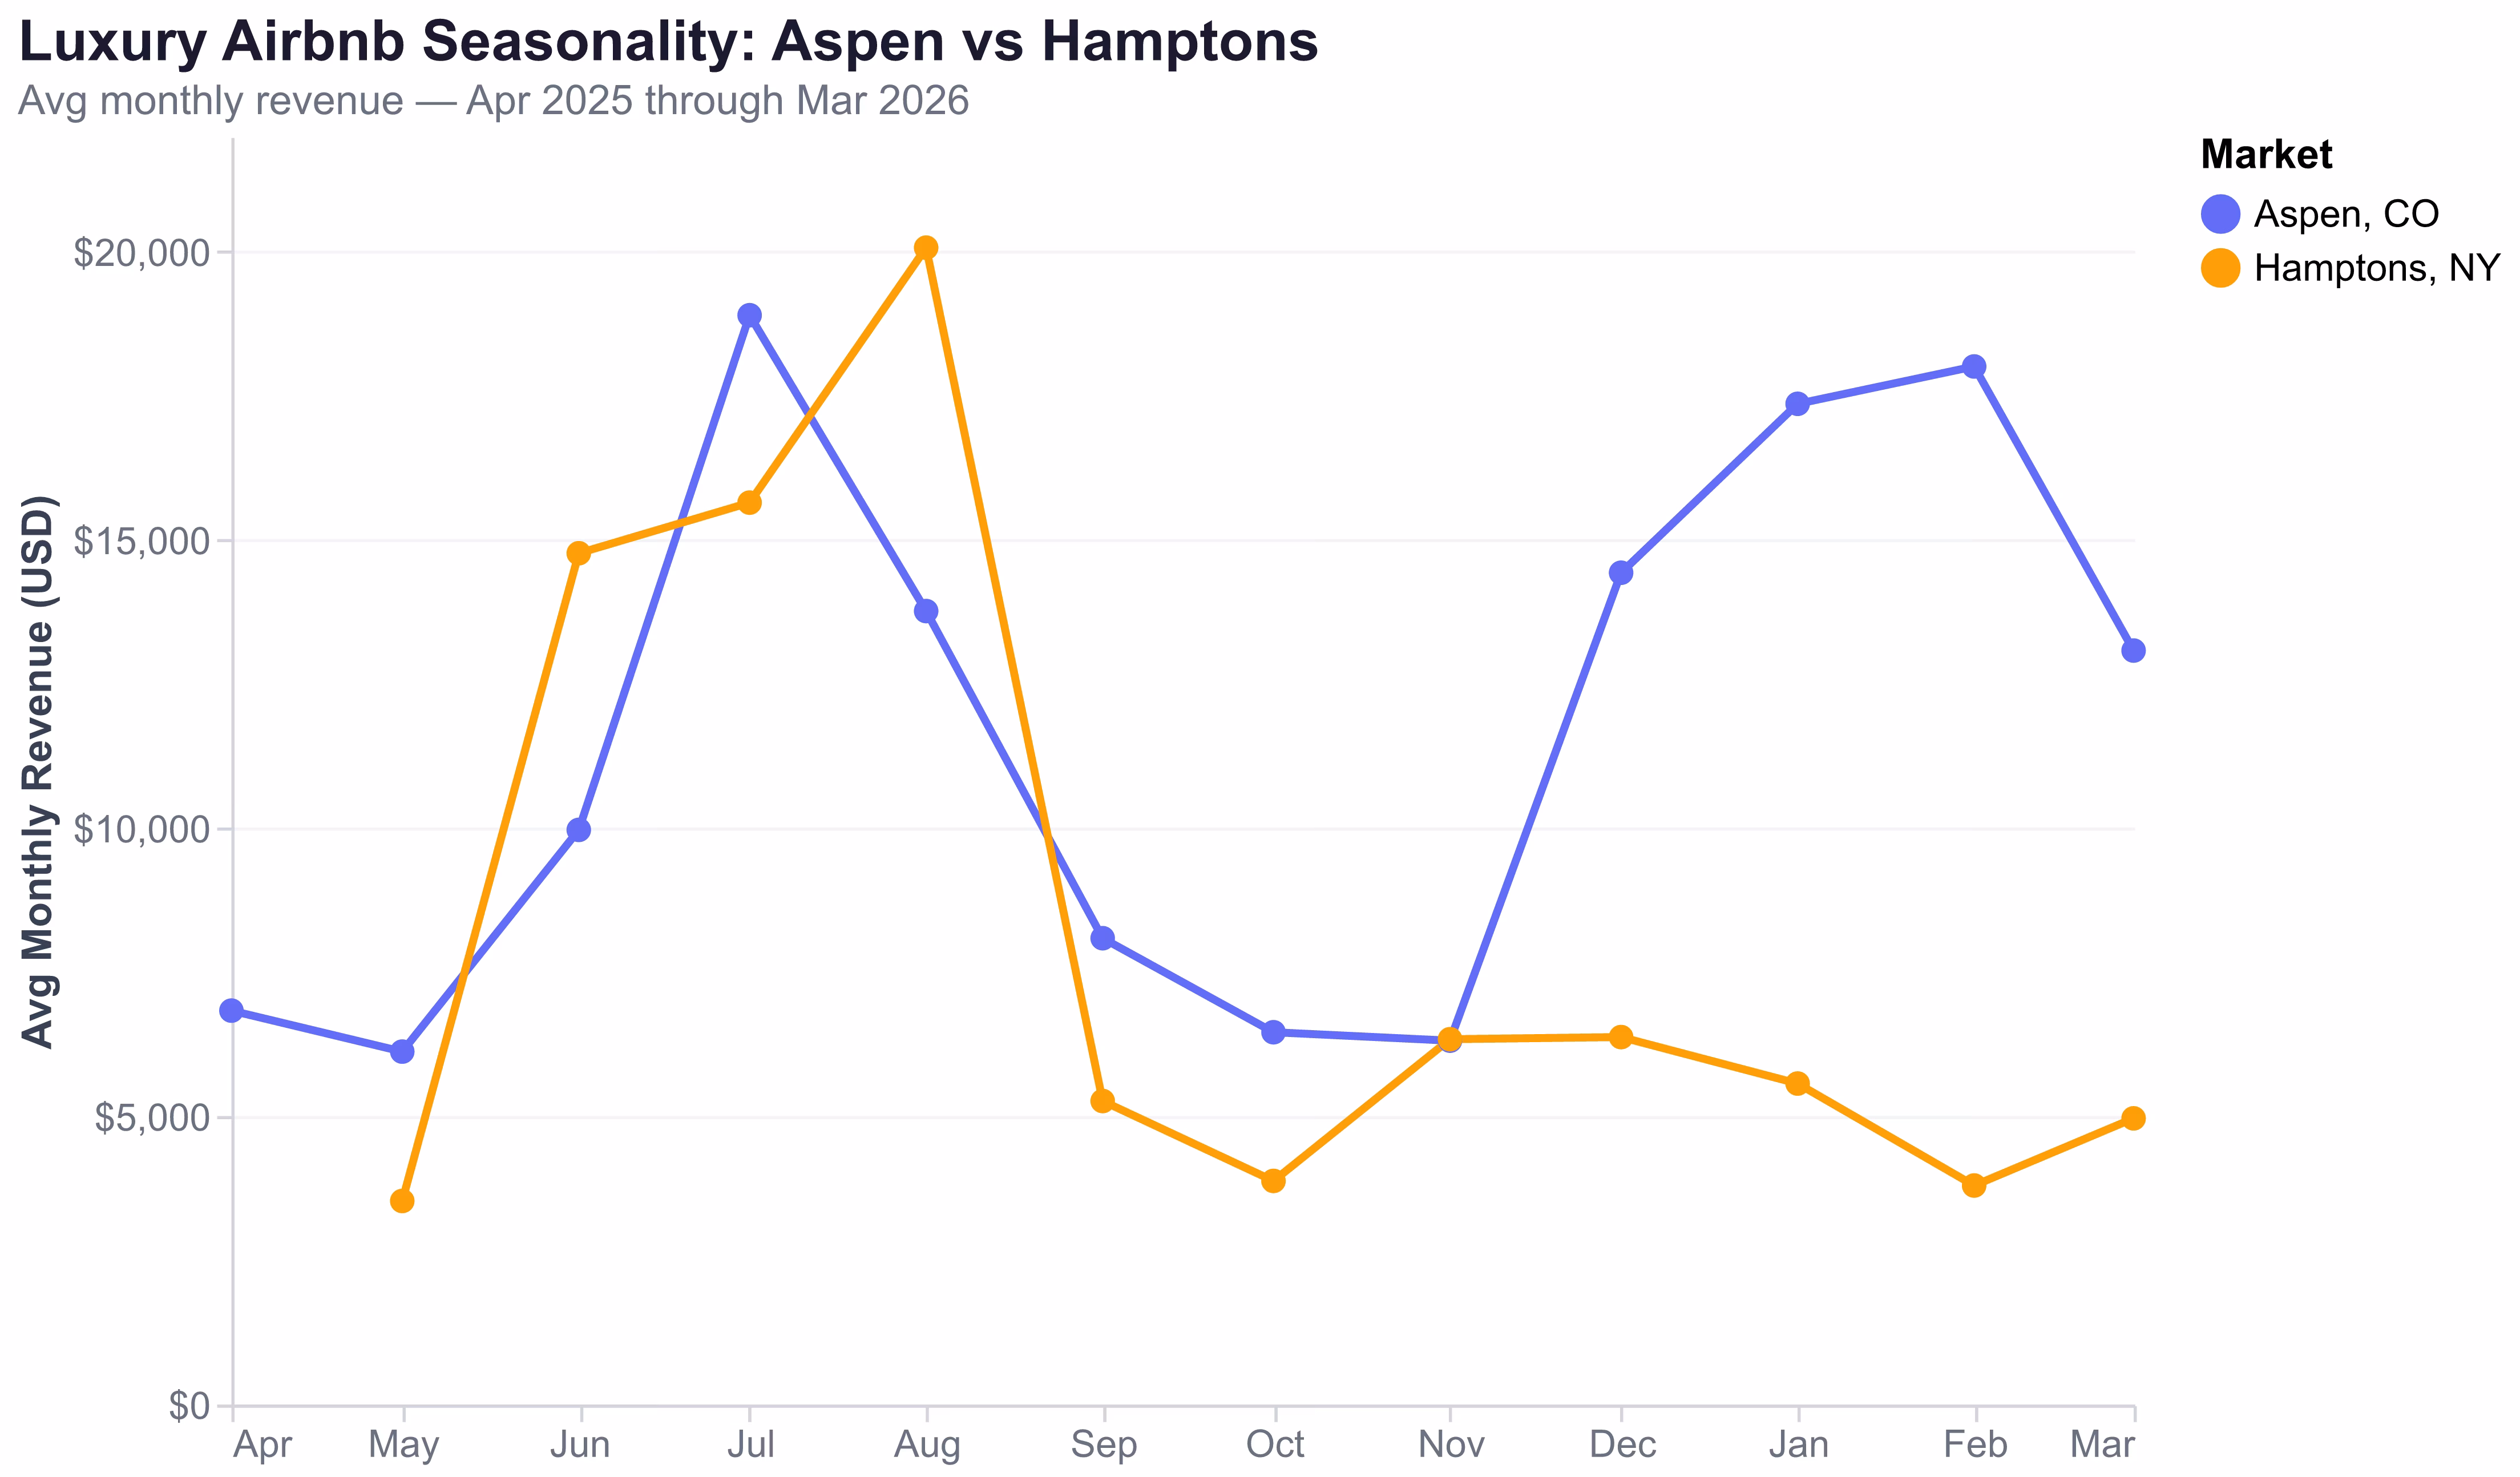
Seasonality Risk: When 4 Months Make or Break the Year
Aspen Luxury: Monthly Revenue Distribution
| Month | Avg Revenue | % of Annual |
|---|---|---|
| February | $20,780 | 13.5% |
| July | $20,664 | 13.4% |
| January | $19,866 | 12.9% |
| December | $16,544 | 10.7% |
| March | $14,886 | 9.7% |
| August | $15,291 | 9.9% |
| June | $10,635 | 6.9% |
| September | $9,084 | 5.9% |
| April | $7,727 | 5.0% |
| October | $7,091 | 4.6% |
| November | $6,888 | 4.5% |
| May | $6,612 | 4.3% |
The peak 4 months (December through March) generate 46.8% of annual revenue in Aspen. Add July and August (ski town summer tourism), and 6 months account for 70.4% of the year's income. The remaining 6 months contribute under 30%.
Hamptons Luxury: Extreme Summer Concentration
The Hamptons presents an even more dramatic picture. August alone generates $27,252 -- 20.1% of annual revenue. July adds $24,900 (18.4%). The summer peak of May through August accounts for 56.5% of the entire year. February, by contrast, generates just $3,703 -- a peak-to-trough ratio of 7.4x.
This concentration creates three practical problems for luxury investors:
- Cash flow gaps. Operating costs (mortgage, insurance, property management base fees) continue through low months when revenue drops 70-80% below peak.
- Pricing pressure. The narrow booking window forces aggressive rate setting -- price too high and lose the booking entirely; price too low and leave the only meaningful revenue on the table.
- Maintenance burden. Properties must be maintained year-round to a luxury standard even during months generating minimal revenue.
Mid-range properties, by contrast, draw from a broader demand base -- business travelers, digital nomads, relocations, medical tourism, event attendees -- that distributes revenue more evenly across the calendar. The typical mid-range peak-to-trough ratio is 2-3x, a far more manageable pattern for investment planning.
International Perspective: Mykonos, Tuscany, and Bali
International luxury markets add perspective but also complexity to the luxury vs. mid-range STR investment analysis.
Mykonos ties Hamptons for the highest luxury RevPAR in the dataset at $480/night but concentrates virtually all revenue into a 4-month Mediterranean summer window. Greek property tax law, short-term rental registration requirements (as of 2024), and the logistics of managing a seasonal island property create operational overhead that erodes the headline revenue numbers. Mid-range Mykonos ($229/night, 47% occupancy) generates $20,980 annually -- roughly comparable revenue-per-dollar-invested to luxury once the villa acquisition premium is priced in.
Florence and Tuscany offer the most balanced international luxury market. Luxury listings sustain 50% occupancy year-round, driven by Florence's status as a 12-month cultural destination -- art exhibitions, wine harvest (September-October), fashion weeks, and winter holiday tourism all contribute. At $756/night ADR and $98,751 annual revenue, Tuscany luxury properties generate strong absolute returns, though Italy's "cedolare secca" flat tax and complex municipal registration requirements require local expertise.
Bali (Seminyak) represents a high-ADR, low-acquisition-cost opportunity. Luxury listings at $953/night generate $92,088 annually -- comparable to Portland or Nashville luxury. But Bali properties can be built or acquired for $200,000-$500,000, creating gross yields that can exceed 18%. The catch: Indonesia's foreign ownership restrictions (leasehold only, typically 25-30 year terms), rupiah currency exposure, and the need for on-ground management infrastructure.
The Verdict: Luxury Now Wins on Yield in Resort Markets
The data across 10 markets points to a clearer pattern than conventional wisdom suggests: luxury properties now deliver higher gross yield than mid-range in resort-destination markets, while mid-range still wins in trophy/appreciation markets.
When Luxury Makes Sense
- Resort-destination markets with deep wealthy guest pools (Scottsdale, San Diego, Nashville, Portland) where luxury occupancy holds above 43% and gross yield now exceeds mid-range
- International arbitrage markets like Bali and Tuscany where luxury acquisition costs are compressed relative to the revenue they generate
- Personal use value -- if you plan to use the property 4-8 weeks per year, the lifestyle benefit supplements the investment return
- Established operator networks -- investors with concierge teams, repeat guest relationships, and off-platform booking channels can push luxury occupancy above market averages
When Mid-Range Is the Better Play
- Trophy markets (Aspen, Hamptons, Palm Beach) where luxury acquisition costs scale faster than revenue, making mid-range yield superior despite lower absolute revenue
- First-time STR investors seeking lower capital at risk and a more forgiving learning curve
- Income-focused investors who need maximum cash flow per dollar deployed and cannot absorb the operating-cost volatility of luxury
- Passive investors who prefer standard property management (15-20% fee) over luxury concierge operations (25-35%)
Three Questions Before Choosing
- What is the luxury occupancy rate in your target market? If below 40%, the ADR premium likely does not compensate. Use AirROI's STR investment analysis tools to check.
- Can you achieve positive cash flow at 35% occupancy? Luxury seasonality may push utilization that low in off-months. Model the worst case.
- Is your target market a resort or a trophy market? Resort markets (Scottsdale, San Diego, Nashville) now favor luxury on yield. Trophy markets (Aspen, Hamptons) still favor mid-range on income but luxury on appreciation.
Investors evaluating either tier should compare performance data filtered by ADR before committing capital. The gap between what a market's luxury listings earn and what its mid-range listings earn -- relative to acquisition cost -- is the single most important number in the decision.
Frequently Asked Questions
Luxury Airbnb properties generate 2.2-4.7x more gross revenue than mid-range listings. AirROI data across 10 markets shows luxury now delivers higher gross yield in resort-destination markets (Scottsdale, Nashville, San Diego, Portland) where occupancy holds above 43%. Appreciation-driven markets like Aspen and the Hamptons still favor mid-range on income yield because entry costs are roughly 5x higher with only 2.7-3.9x the revenue.
Luxury listings ($500+/night ADR) average 35-50% occupancy across major US and international markets, compared to 38-56% for mid-range ($150-300/night). Palm Beach has the lowest luxury occupancy at 35%, while San Diego and Florence tie for the highest at 50%. Luxury runs 1-11 percentage points below mid-range in 9 of 10 markets studied, with Napa Valley as the sole exception. This occupancy gap is the primary reason luxury RevPAR does not scale proportionally with ADR.
Luxury vacation rental cleaning costs range from $200 to $400 per turnover, compared to $75-$150 for mid-range properties. The premium reflects larger square footage, high-end materials requiring specialized cleaning products, and guest expectations for white-glove service. At 50+ turnovers per year, this adds $6,250-$12,500 in annual operating costs above mid-range.
AirROI data identifies San Diego CA ($117,856 annual revenue, 50% occupancy), Scottsdale AZ ($115,792 revenue, 47% occupancy), and Nashville TN ($96,925 revenue, 43% occupancy) as the strongest luxury STR investment markets in the US. These combine high ADRs of $776-$920 with occupancy rates above 43%, generating the highest revenue per dollar invested among luxury markets analyzed.
Luxury properties face significantly greater seasonality risk than mid-range listings. In the Hamptons, luxury August revenue ($27,252) is 7.4x February revenue ($3,703). In Aspen, the peak 4 months (December through March) generate 46.8% of annual revenue. Mid-range properties have broader guest appeal and typically show peak-to-trough ratios of 2-3x versus 4-7x for luxury.