San José, Alajuela Province Airbnb Market Data 2025: STR Report & Statistics
How much can you earn on Airbnb in San José, Alajuela Province? Based on AirROI's 2025 dataset (November 2024 – October 2025), the short answer is $5,940 per year — at a $82 nightly rate, 27.8% occupancy, and a N/A RevPAR.
At 60 active listings, San José is a boutique market where selective demand that rewards strong listing quality and pricing strategy. Supply grew 81.8% year over year, and the market is recalibrating around a new competitive baseline. This is the stage where hosts who invest in amenities, guest experience, and dynamic pricing build durable advantages that compound as the market matures.
Regulation is low with minimal registration requirements, pointing to an operator-friendly environment. In a market this size, differentiated listings with strong reviews can capture outsized returns relative to the competition.

Table of Contents [hide] [show]
What Are the Key Airbnb Metrics in San José?
In San José, the headline Airbnb metrics are $5,940 in average annual revenue,27.8% occupancy, $82 ADR, and $0 in RevPAR, and guests book about 27 days in advance.
How Much Do Airbnb Hosts Earn Monthly in San José?
Understanding the monthly revenue variations for Airbnb listings in San José is key to maximizing your short term rental income potential. Seasonality significantly impacts earnings. Our analysis, based on data from the past 12 months, shows that the peak revenue month for STRs in San José is typically December, while September often presents the lowest earnings, highlighting opportunities for strategic pricing adjustments during shoulder and low seasons. Explore the typical Airbnb income in San José across different performance tiers:
- Best-in-class properties (Top 10%) achieve $1,894+ monthly, often utilizing dynamic pricing and superior guest experiences.
- Strong performing properties (Top 25%) earn $864 or more, indicating effective management and desirable locations/amenities.
- Typical properties (Median) generate around $472 per month, representing the average market performance.
- Entry-level properties (Bottom 25%) see earnings around $186, often with potential for optimization.
Average Monthly Airbnb Earnings Trend in San José
What Is the Monthly Airbnb Occupancy Rate in San José?
Maximize your bookings by understanding the San José STR occupancy trends. Seasonal demand shifts significantly influence how often properties are booked. Typically, Julysees the highest demand (peak season occupancy), while September experiences the lowest (low season). Effective strategies, like adjusting minimum stays or offering promotions, can boost occupancy during slower periods. Here's how different property tiers perform in San José:
- Best-in-class properties (Top 10%) achieve 73%+ occupancy, indicating high desirability and potentially optimized availability.
- Strong performing properties (Top 25%) maintain 44% or higher occupancy, suggesting good market fit and guest satisfaction.
- Typical properties (Median) have an occupancy rate around 22%.
- Entry-level properties (Bottom 25%) average 9% occupancy, potentially facing higher vacancy.
Average Monthly Occupancy Rate Trend in San José
What Is the Average Airbnb Nightly Rate in San José?
Effective short term rental pricing strategy in San José involves understanding monthly ADR fluctuations. The Average Daily Rate (ADR) for Airbnb in San José typically peaks in June and dips lowest during November. Leveraging Airbnb dynamic pricing tools or strategies based on this seasonality can significantly boost revenue. Here's a look at the typical nightly rates achieved:
- Best-in-class properties (Top 10%) command rates of $161+ per night, often due to premium features or locations.
- Strong performing properties (Top 25%) achieve nightly rates of $97 or more.
- Typical properties (Median) charge around $67 per night.
- Entry-level properties (Bottom 25%) earn around $43 per night.
Average Daily Rate (ADR) Trend by Month in San José
What Is the RevPAR for Airbnb in San José?
RevPAR in San José is currently N/A. Because RevPAR combines nightly rates with realized occupancy, it is one of the cleanest ways to compare how efficiently listings turn demand into revenue across the market.
- Entry-level properties (Bottom 25%) see N/A RevPAR.
- Typical properties (Median) generate N/A RevPAR.
- Strong performers (Top 25%) earn N/A RevPAR.
- Best-in-class (Top 10%) achieve N/A RevPAR.
Average Monthly RevPAR Trend in San José
RevPAR Insights for San José
- RevPAR peaks in Jan and bottoms out in Jan, mirroring the broader seasonal demand pattern and suggesting opportunities for dynamic pricing.
Recommendations for Hosts
- Track your own RevPAR monthly against these San José benchmarks. If your RevPAR falls below the median of N/A, examine whether low occupancy or low ADR is the primary drag.
- Use RevPAR rather than revenue alone when comparing properties of different sizes — it normalizes for available nights and gives a more accurate picture of performance.
Get Live San José Market Intelligence 👇
Explore Real-time Analytics
When Is the Peak Season for Airbnb in San José?
San José's peak Airbnb season falls in December, July, November, while the softest stretch is May, August, September. Overall, the market shows highly seasonal trends requiring careful strategy, which should guide pricing, minimum stays, and cash-flow planning.
Peak Season (December, July, November)
- Revenue averages $1,017 per month
- Occupancy rates average 36.0%
- Daily rates average $85
Shoulder Season
- Revenue averages $808 per month
- Occupancy maintains around 30.7%
- Daily rates hold near $86
Low Season (May, August, September)
- Revenue drops to average $564 per month
- Occupancy decreases to average 23.0%
- Daily rates adjust to average $86
Seasonality Insights for San José
- Airbnb seasonality in San José is pronounced. Revenue swings sharply between peak and low months, which means pricing strategy, minimum-stay settings, and cash reserves all need to account for extended slower periods.
- During the high season, the absolute peak month showcases San José's highest earning potential, with monthly revenues climbing to $1,106, occupancy reaching 38.6%, and ADRs peaking at $88.
- Conversely, the slowest single month marks the market's lowest point — revenue may dip to $498, occupancy could drop to 21.2%, and ADRs may adjust to $84.
- Lower occupancy paired with meaningful seasonality means hosts in San José need to maximize every peak-season booking and seriously consider whether off-season pricing adjustments or minimum-stay changes can capture incremental revenue.
Seasonal Strategies for Maximizing Profit
- Peak Season: Maximize revenue through premium pricing and potentially longer minimum stays. Ensure high availability and consider tightening cancellation policies to reduce last-minute gaps.
- Low Season: Offer competitive pricing, extended-stay discounts, and flexible cancellation policies. Target off-season travelers like remote workers, budget-conscious guests, and travelers with flexible schedules.
- Shoulder Seasons: Implement dynamic pricing that bridges peak and low rates. Target weekend travelers, local events, and business visitors. Slightly more flexible terms than peak season can help maintain occupancy without deep discounting.
- In a highly seasonal market like San José, building a cash reserve during the top months is essential for covering fixed costs during the slow period. Automated pricing tools can help capture demand shifts in real time.
Do You Need a License for Airbnb in San José?
Low regulation and minimal registration activity in San José, Alajuela Province, Costa Rica point to an operator-friendly environment. That said, even low-regulation markets may have tax collection requirements, safety standards, or HOA rules that affect short-term rental operations. Always verify the latest short-term rental regulations and Airbnb license requirements directly with local government authorities for San José to ensure full compliance before hosting.
(Source: AirROI data, 2026, based on 2% licensed listings)
What Are the Best Neighborhoods for Airbnb in San José?
San José is a smaller vacation rental market where a handful of neighborhoods drive most of the booking activity. Choosing the right area is especially important in boutique markets — there is less room for a mediocre location to succeed on volume alone. The areas below highlight where short-term rental demand is strongest and why.
| Neighborhood / Area | Why Host Here? (Target Guests & Appeal) | Key Attractions & Landmarks |
|---|---|---|
| Escazú | A suburban area close to San José known for its upscale living and amenities. Perfect for those wanting a blend of luxury and convenience, popular among expats and tourists. | Multiplaza Escazú, Britt Coffee Tour, Parque Nacional Quebrada González, restaurants and cafes, La Casa del Café |
| Santa Ana | Another upscale suburb of San José, known for its modern developments and dining options. A great choice for visitors looking for a relaxed atmosphere close to city amenities. | City Place, Parque de Santa Ana, Apia Mall, restaurants and nightlife, Cultural Center |
| Downtown San José | The vibrant heart of Costa Rica's capital, filled with historical architecture and cultural sites. Ideal for travelers interested in history and urban experiences. | National Theatre of Costa Rica, Museo del Oro Precolombino, Plaza de la Cultura, Central Market, Metropolitan Cathedral |
| La Sabana | A park-filled area known for its sports and cultural facilities. It attracts both locals and tourists who enjoy outdoor activities and art. | La Sabana Park, Museo de Arte Costarricense, Central de Autobuses, Casa del Cuño, Café Café |
| Heredia | Known as the 'City of Flowers', it's a lovely area close to San José, featuring charming colonial architecture and a cooler climate. | Las Golden Hills, Hacienda Palmares, Parque Nacional Braulio Carrillo, Central Park, Historical Center of Heredia |
| Alajuela | The capital of Alajuela Province, offering a taste of local life along with access to natural attractions like the Arenal Volcano. | Juan Santamaría International Airport, Central Market, Cathedral of Alajuela, Zoo Ave, Coffee plantations |
| Turrialba | Famous for its coffee and the Turrialba Volcano, this area is great for ecotourism and adventure travelers. | Turrialba Volcano, Guayabo National Monument, River rafting on Pacuare, Coffee plantations, Ecotourism Activities |
| Cartago | Historical city that was once the capital of Costa Rica, rich in cultural sites and beautiful scenery, attracting history and nature lovers alike. | Basilica de Los Ángeles, Ruins of Ujarrás, Lankester Botanical Garden, Tapantí National Park, Orosí Valley |
With 8 distinct neighborhoods showing meaningful short-term rental activity, San José offers diversification within a single market. Investors can tailor their strategy — from high-turnover tourist zones to quieter residential areas that attract longer stays and remote workers.
What Types of Properties Are on Airbnb in San José?
Room Type Distribution
Property Type Distribution
Market Composition Insights for San José
- The San José Airbnb market composition is heavily skewed towards Entire Home/Apt listings, which make up 81.7% of the 60 active rentals. This indicates strong guest preference for privacy and space.
- Looking at the property type distribution in San José, House properties are the most common (43.3%), reflecting the local real estate landscape.
- Houses represent a significant 43.3% portion, catering likely to families or larger groups.
- The presence of 11.7% Hotel/Boutique listings indicates integration with traditional hospitality.
San José Airbnb Room Capacity Analysis (2026): Bedroom Distribution
Distribution of Listings by Number of Bedrooms
Room Capacity Insights for San José
- The dominant room capacity in San José is 1 bedroom listings, making up 43.3% of the market. This suggests a strong demand for properties suitable for couples or solo travelers.
- Together, 1 bedroom and 2 bedrooms properties represent 61.6% of the active Airbnb listings in San José, indicating a high concentration in these sizes.
- A significant 26.7% of listings offer 3+ bedrooms, catering to larger groups and families seeking more space in San José.
San José Vacation Rental Guest Capacity Trends (2026)
Distribution of Listings by Guest Capacity
Guest Capacity Insights for San José
- The most common guest capacity trend in San José vacation rentals is listings accommodating 2 guests (26.7%). This suggests the primary traveler segment is likely couples or solo travelers.
- Properties designed for 2 guests and 4 guests dominate the San José STR market, accounting for 46.7% of listings.
- 25.0% of properties accommodate 6+ guests, serving the market segment for larger families or group travel in San José.
- On average, properties in San José are equipped to host 3.6 guests.
What Amenities Do Airbnb Guests Expect in San José?
Amenity Prevalence
Amenity Insights for San José
- Essential amenities in San José that guests expect include: Wifi. Lacking these (this) could significantly impact bookings.
- Popular amenities like TV, Free parking on premises, Hot water are common but not universal. Offering these can provide a competitive edge.
Recommendations for Hosts
- Ensure your listing includes all essential amenities for San José: Wifi.
- Prioritize adding missing essentials: Wifi.
- Consider adding popular differentiators like TV or Free parking on premises to increase appeal.
- Highlight unique or less common amenities you offer (e.g., hot tub, dedicated workspace, EV charger) in your listing description and photos.
- Regularly check competitor amenities in San José to stay competitive.
Dive Deeper: Advanced San José STR Market Data (2026)
Ready to unlock more insights? AirROI provides access to advanced metrics and comprehensive Airbnb data for San José. Explore detailed analytics beyond this report to refine your investment strategy, optimize pricing, and maximize your vacation rental profits.
Explore Advanced MetricsSan José Airbnb Guest Demographics & Profile Analysis (2026)
Guest Profile Summary for San José
- The typical guest profile for Airbnb in San José consists of predominantly international visitors (75%), with top international origins including Costa Rica, typically belonging to the Post-2000s (Gen Z/Alpha) group (50%), primarily speaking English or Spanish.
- Domestic travelers account for 25.2% of guests.
- Key international markets include United States (40.3%) and Costa Rica (25.2%).
- Top languages spoken are English (43.8%) followed by Spanish (34.3%).
- A significant demographic segment is the Post-2000s (Gen Z/Alpha) group, representing 50% of guests.
Recommendations for Hosts
- Focus marketing internationally, particularly towards travelers from Costa Rica.
- Tailor amenities and listing descriptions to appeal to the dominant Post-2000s (Gen Z/Alpha) demographic (e.g., highlight fast WiFi, smart home features, local guides).
- Highlight unique local experiences or amenities relevant to the primary guest profile.
- Consider seasonal promotions aligned with peak travel times for key origin markets.
San José Airbnb Booking Patterns (2026): Available vs. Booked Days
Available Days Distribution
Booked Days Distribution
Booking Pattern Insights for San José
- The most common availability pattern in San José falls within the 271-366 days range, representing 85% of listings. This suggests many properties have significant open periods on their calendars.
- Approximately 91.7% of listings show high availability (181+ days open annually), indicating potential for increased bookings or specific owner usage patterns.
- For booked days, the 31-90 days range is most frequent in San José (48.3%), reflecting common guest stay durations or potential owner blocking patterns.
- A notable 8.4% of properties secure long booking periods (181+ days booked per year), highlighting successful long-term rental strategies or significant owner usage.
How Far in Advance Do Guests Book Airbnb in San José?
Average Booking Lead Time by Month
Booking Lead Time Insights for San José
- The overall average booking lead time for vacation rentals in San José is 27 days.
- Guests book furthest in advance for stays during December (average 45 days), likely coinciding with peak travel demand or local events.
- The shortest booking windows occur for stays in April (average 24 days), indicating more last-minute travel plans during this time.
- Seasonally, Summer (39 days avg.) sees the longest lead times, while Spring (29 days avg.) has the shortest, reflecting typical travel planning cycles.
Recommendations for Hosts
- Use the overall average lead time (27 days) as a baseline for your pricing and availability strategy in San José.
- For December stays, consider implementing length-of-stay discounts or slightly higher rates for bookings made less than 45 days out to capitalize on advance planning.
- Target marketing efforts for the Summer season well in advance (at least 39 days) to capture early planners.
- Monitor your own booking lead times against these San José averages to identify opportunities for dynamic pricing adjustments.
San José Airbnb Minimum Stay Requirements Analysis
Distribution of Listings by Minimum Night Requirement
1 Night
47 listings
78.3% of total
2 Nights
7 listings
11.7% of total
3 Nights
1 listings
1.7% of total
4-6 Nights
1 listings
1.7% of total
30+ Nights
4 listings
6.7% of total
Key Insights
- The most prevalent minimum stay requirement in San José is 1 Night, adopted by 78.3% of listings. This highlights the market's preference for shorter, flexible bookings.
- A strong majority (90.0%) of the San José Airbnb data shows acceptance of very short stays (1-2 nights), indicating a dynamic, high-turnover market.
Recommendations
- Align with the market by considering a 1 Night minimum stay, as 78.3% of San José hosts use this setting.
- Explore offering discounts for stays of 30+ nights to attract the 6.7% of the market seeking extended stays.
- Adjust minimum nights based on seasonality – potentially shorter during low season and longer during peak demand periods in San José.
San José Airbnb Cancellation Policy Trends Analysis (2026)
Flexible
33 listings
55.9% of total
Moderate
13 listings
22% of total
Firm
12 listings
20.3% of total
Strict
1 listings
1.7% of total
Cancellation Policy Insights for San José
- The prevailing Airbnb cancellation policy trend in San José is Flexible, used by 55.9% of listings.
- The market strongly favors guest-friendly terms, with 77.9% of listings offering Flexible or Moderate policies. This suggests guests in San José may expect booking flexibility.
- Strict cancellation policies are quite rare (1.7%), potentially making listings with this policy less competitive unless justified by high demand or property type.
Recommendations for Hosts
- Consider adopting a Flexible policy to align with the 55.9% market standard in San José.
- Given the high prevalence of Flexible policies (55.9%), offering this can enhance booking appeal, especially during shoulder seasons.
- Using a Strict policy might deter some guests, as only 1.7% of listings use it. Evaluate if potential revenue protection outweighs possible lower booking rates.
- Regularly review your cancellation policy against competitors and market demand shifts in San José.
What Do the Top Airbnb Listings in San José Look Like?
Benchmark your potential! Explore examples of top-performing Airbnb properties in San Josébased on Trailing Twelve Month (TTM) revenue. Analyze their characteristics, revenue, occupancy rate, and ADR to understand what drives success in this market.
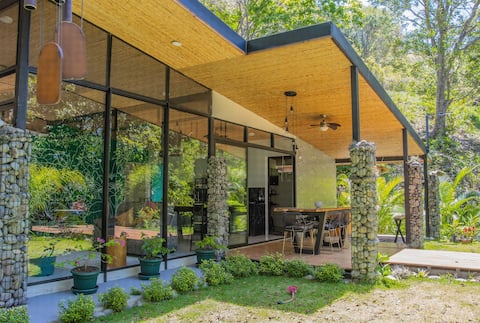
Finca Totoro, Trails and Nature
Entire Place • 2 bedrooms

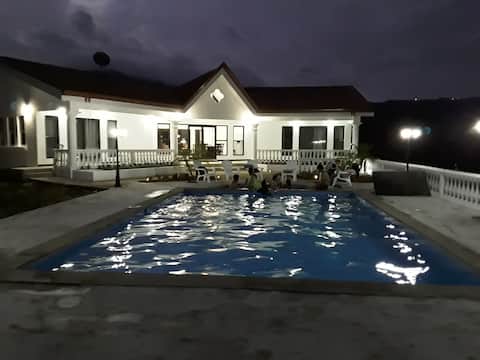
Casa Güitite (10 min from airport)
Entire Place • 5 bedrooms

Casa Gaudi🦚Near SJO🦚Private Pool & King BD
Entire Place • 4 bedrooms
Morazan Hills Villa
Entire Place • 3 bedrooms
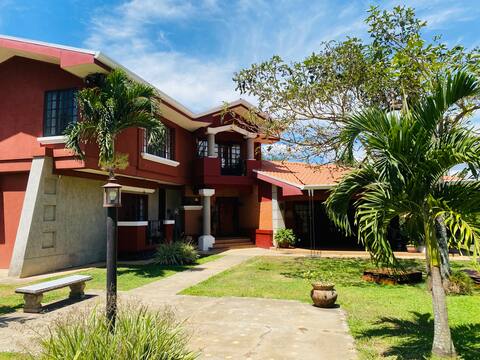
The Red Castle
Entire Place • 3 bedrooms

Big and luxury urban house
Entire Place • 3 bedrooms
Note: Performance varies based on location, size, amenities, seasonality, and management quality. Data reflects the past 12 months.
Who Are the Top Airbnb Hosts in San José?
Learn from the best! This table showcases top-performing Airbnb hosts in San José based on the number of properties managed and estimated total revenue over the past year. Analyze their scale and performance metrics.
| Host Name | Properties | Grossing Revenue | Stay Reviews | Avg Rating |
|---|---|---|---|---|
| Marlen | 1 | $46,983 | 189 | 4.89/5.0 |
| Maria Jose | 1 | $42,017 | 127 | 4.95/5.0 |
| Ursula | 1 | $26,978 | 119 | 4.90/5.0 |
| Sergio | 2 | $17,501 | 82 | 4.84/5.0 |
| Gloriana | 2 | $16,865 | 874 | 4.91/5.0 |
| Len And Barbara | 1 | $16,823 | 11 | 4.55/5.0 |
| Cristina | 2 | $14,915 | 32 | 4.98/5.0 |
| Posada Las Palmas | 2 | $13,421 | 921 | 4.94/5.0 |
| Christian | 3 | $12,723 | 66 | 4.83/5.0 |
| Andrea | 1 | $12,217 | 12 | 5.00/5.0 |
Analyzing the strategies of top hosts, such as their property selection, pricing, and guest communication, can offer valuable lessons for optimizing your own Airbnb operations in San José.
How Does San José's Airbnb Market Compare to Nearby Cities?
How does the San José Airbnb market stack up against its neighbors? Compare key performance metrics like average monthly revenue, ADR, and occupancy rates in surrounding areas to understand the broader regional STR landscape.
Compared with Playa Tamarindo, San José has 20 percentage points lower occupancy and about $328 lower ADR. That helps frame whether this market is winning more on demand, pricing, or both.
| Market | Active Properties | Monthly Revenue | Daily Rate | Avg. Occupancy |
|---|---|---|---|---|
| Nacascolo | 32 | $7,159 | $1165.34 | 35% |
| Pinilla | 74 | $5,903 | $615.77 | 37% |
| Playa Tamarindo | 21 | $5,694 | $409.60 | 48% |
| Playa Langosta | 164 | $4,968 | $497.33 | 42% |
| Punta Islita | 28 | $4,963 | $551.73 | 37% |
| Tamarindo | 1,232 | $4,671 | $411.22 | 44% |
| Cabo Velas | 944 | $3,808 | $400.71 | 40% |
| Nosara | 864 | $3,759 | $433.44 | 42% |
| Tempate | 698 | $3,352 | $398.13 | 38% |
| Quepos | 1,125 | $2,927 | $258.22 | 41% |
Frequently Asked Questions About Airbnb in San José
These quick answers summarize the most common investor and operator questions using AirROI's latest market data for San José.
How much do Airbnb hosts make in San José?
San José hosts earn about $5,940 per year on average, with an average nightly rate of $82 and RevPAR of N/A. Those figures describe the typical revenue environment for active listings in San José, Alajuela Province, not the ceiling for the best operators. Source: AirROI 2025 data, San José market, November 2024 to October 2025.
What is the average Airbnb occupancy rate in San José?
The average Airbnb occupancy rate in San José is 27.8%. December is the strongest month and September is the softest, so hosts should expect demand to move meaningfully throughout the year rather than stay flat.
What is the average Airbnb daily rate in San José?
Listings in San José average $82 per night. The broader pricing spread also matters: lower-performing listings cluster closer to the lower quartiles, while premium homes can price materially above the city average when demand spikes or listing quality stands out.
How many Airbnb listings are active in San José?
San José currently has about 60 active Airbnb listings in AirROI's market dataset. That supply count helps explain how competitive the market is, how much depth there is for benchmarking, and whether the market behaves like a niche destination or a scaled urban market.
How strict are short-term rental regulations in San José?
AirROI currently classifies the short-term rental regulation level in San José as Low. The dataset also shows about 1.7% of listings with registration evidence. That is a market signal, not legal advice, so hosts should still confirm current licensing and compliance rules locally before listing.
What is the RevPAR for Airbnb in San José?
RevPAR in San José is about N/A. That metric combines pricing and occupancy into one efficiency number, so it is often a better quick benchmark than ADR alone when investors want to compare how well listings convert nightly rates into realized revenue.
Is Airbnb profitable in San José?
Occupancy of 27.8% means San José is a more selective market. Profitability is achievable but requires careful cost management, premium positioning, or targeting longer stays to reduce turnover. Average annual revenue is $5,940, but individual returns depend on property type, location within the city, and the host's operating efficiency.
How far in advance do guests book Airbnb in San José?
The average booking lead time in San José is about 27 days — a moderate lead time that gives hosts planning visibility while still benefiting from last-minute bookings. Hosts who understand their market's booking cadence can adjust minimum stays and pricing windows accordingly.
What are the best neighborhoods for Airbnb in San José?
Based on AirROI's analysis, some of the top neighborhoods for short-term rentals in San José include Escazú, Santa Ana, Downtown San José. Each area attracts different guest profiles — from business travelers to leisure visitors — so the best location depends on the property type and target audience a host is aiming for. See the full neighborhood breakdown above.
What type of property performs best on Airbnb in San José?
entire_home listings make up 81.7% of the active supply in San José. The most common configuration does not always mean the most profitable — operators who identify underserved property types or bedroom counts can sometimes outperform the market average by filling a gap in local supply.
How does San José compare to nearby Airbnb markets?
Among neighboring markets, Nacascolo posts $85,908 in average annual revenue with 34.7% occupancy, compared to San José's $5,940 and 27.8%. Comparing nearby markets helps investors understand whether a destination's performance reflects local demand or broader regional trends.
When is the peak season for Airbnb in San José?
December is the highest-revenue month in San José, while September is the softest. The revenue spread between them indicates moderate seasonality with a clear peak period, giving hosts opportunities to maximize rates during high demand without facing dramatic off-season drops.
About AirROI Market Data
AirROI tracks over 20 million properties across 190+ countries and maintains 15+ years of historical performance data, making it one of the deepest Airbnb and STR intelligence platforms available. The analytics pipeline aggregates listing-level data monthly — revenue, occupancy, nightly rates, RevPAR, guest demographics, booking patterns, and competitive supply — so investors and operators can benchmark any market against its own history and against neighboring destinations.
Real estate investors, property managers, financial institutions, hedge funds, tourism boards, hospitality consultants, tech platforms, and academic researchers rely on AirROI data to underwrite acquisitions, optimize pricing, model macro trends, and conduct peer-reviewed research. Data is available through in-depth market reports like this one and the Airbnb API with 22 endpoints and an Airbnb MCP Server for AI agents.
AirROI proprietary analytics as of 2025-10-31. Metrics reflect trailing twelve-month aggregates from active listings. Revenue figures are market averages, not projections. Neighborhood descriptions are AI-generated and reviewed for accuracy. For full methodology, see the data methodology page.