Oiso, Kanagawa Prefecture Airbnb Market Data 2025: STR Report & Statistics
How much can you earn on Airbnb in Oiso, Kanagawa Prefecture? Based on AirROI's 2025 dataset (October 2024 – September 2025), the short answer is $17,903 per year — at a $115 nightly rate, 41.9% occupancy, and a N/A RevPAR.
With just 18 active listings, Oiso is a micro-market where moderate demand with room for well-positioned listings to outperform. Supply grew 125.0% year over year, and the market is recalibrating around a new competitive baseline. This is the stage where hosts who invest in amenities, guest experience, and dynamic pricing build durable advantages that compound as the market matures.
Regulation is high and 94% of listings show active registration — compliance is the cost of entry. In a market this size, differentiated listings with strong reviews can capture outsized returns relative to the competition.

Table of Contents [hide] [show]
What Are the Key Airbnb Metrics in Oiso?
In Oiso, the headline Airbnb metrics are $17,903 in average annual revenue,41.9% occupancy, $115 ADR, and $0 in RevPAR, and guests book about 27 days in advance.
How Much Do Airbnb Hosts Earn Monthly in Oiso?
Understanding the monthly revenue variations for Airbnb listings in Oiso is key to maximizing your short term rental income potential. Seasonality significantly impacts earnings. Our analysis, based on data from the past 12 months, shows that the peak revenue month for STRs in Oiso is typically August, while January often presents the lowest earnings, highlighting opportunities for strategic pricing adjustments during shoulder and low seasons. Explore the typical Airbnb income in Oiso across different performance tiers:
- Best-in-class properties (Top 10%) achieve $4,420+ monthly, often utilizing dynamic pricing and superior guest experiences.
- Strong performing properties (Top 25%) earn $1,631 or more, indicating effective management and desirable locations/amenities.
- Typical properties (Median) generate around $890 per month, representing the average market performance.
- Entry-level properties (Bottom 25%) see earnings around $579, often with potential for optimization.
Average Monthly Airbnb Earnings Trend in Oiso
What Is the Monthly Airbnb Occupancy Rate in Oiso?
Maximize your bookings by understanding the Oiso STR occupancy trends. Seasonal demand shifts significantly influence how often properties are booked. Typically, Novembersees the highest demand (peak season occupancy), while January experiences the lowest (low season). Effective strategies, like adjusting minimum stays or offering promotions, can boost occupancy during slower periods. Here's how different property tiers perform in Oiso:
- Best-in-class properties (Top 10%) achieve 82%+ occupancy, indicating high desirability and potentially optimized availability.
- Strong performing properties (Top 25%) maintain 58% or higher occupancy, suggesting good market fit and guest satisfaction.
- Typical properties (Median) have an occupancy rate around 42%.
- Entry-level properties (Bottom 25%) average 25% occupancy, potentially facing higher vacancy.
Average Monthly Occupancy Rate Trend in Oiso
What Is the Average Airbnb Nightly Rate in Oiso?
Effective short term rental pricing strategy in Oiso involves understanding monthly ADR fluctuations. The Average Daily Rate (ADR) for Airbnb in Oiso typically peaks in July and dips lowest during February. Leveraging Airbnb dynamic pricing tools or strategies based on this seasonality can significantly boost revenue. Here's a look at the typical nightly rates achieved:
- Best-in-class properties (Top 10%) command rates of $246+ per night, often due to premium features or locations.
- Strong performing properties (Top 25%) achieve nightly rates of $100 or more.
- Typical properties (Median) charge around $63 per night.
- Entry-level properties (Bottom 25%) earn around $55 per night.
Average Daily Rate (ADR) Trend by Month in Oiso
What Is the RevPAR for Airbnb in Oiso?
RevPAR in Oiso is currently N/A. Because RevPAR combines nightly rates with realized occupancy, it is one of the cleanest ways to compare how efficiently listings turn demand into revenue across the market.
- Entry-level properties (Bottom 25%) see N/A RevPAR.
- Typical properties (Median) generate N/A RevPAR.
- Strong performers (Top 25%) earn N/A RevPAR.
- Best-in-class (Top 10%) achieve N/A RevPAR.
Average Monthly RevPAR Trend in Oiso
RevPAR Insights for Oiso
- RevPAR peaks in Jan and bottoms out in Jan, mirroring the broader seasonal demand pattern and suggesting opportunities for dynamic pricing.
Recommendations for Hosts
- Track your own RevPAR monthly against these Oiso benchmarks. If your RevPAR falls below the median of N/A, examine whether low occupancy or low ADR is the primary drag.
- Use RevPAR rather than revenue alone when comparing properties of different sizes — it normalizes for available nights and gives a more accurate picture of performance.
Get Live Oiso Market Intelligence 👇
Explore Real-time Analytics
When Is the Peak Season for Airbnb in Oiso?
Oiso's peak Airbnb season falls in August, November, December, while the softest stretch is January, February, June. Overall, the market shows moderate seasonality with distinct peak and low periods, which should guide pricing, minimum stays, and cash-flow planning.
Peak Season (August, November, December)
- Revenue averages $2,098 per month
- Occupancy rates average 49.2%
- Daily rates average $109
Shoulder Season
- Revenue averages $1,668 per month
- Occupancy maintains around 45.7%
- Daily rates hold near $109
Low Season (January, February, June)
- Revenue drops to average $1,299 per month
- Occupancy decreases to average 36.7%
- Daily rates adjust to average $105
Seasonality Insights for Oiso
- The Airbnb seasonality pattern in Oiso shows moderate seasonality with distinct peak and low periods. While the sections above show seasonal averages, it is also insightful to look at the extremes:
- During the high season, the absolute peak month showcases Oiso's highest earning potential, with monthly revenues climbing to $2,216, occupancy reaching 54.5%, and ADRs peaking at $131.
- Conversely, the slowest single month marks the market's lowest point — revenue may dip to $1,078, occupancy could drop to 34.2%, and ADRs may adjust to $89.
- Understanding both the seasonal averages and these monthly peaks and troughs in revenue, occupancy, and ADR is crucial for maximizing your Airbnb profit potential in Oiso.
Seasonal Strategies for Maximizing Profit
- Peak Season: Maximize revenue through premium pricing. In a high-regulation market like Oiso, ensure your permit covers the number of nights you plan to book — some jurisdictions cap annual rental days.
- Low Season: Offer competitive pricing, extended-stay discounts, and flexible cancellation policies. Target off-season travelers like remote workers, budget-conscious guests, and travelers with flexible schedules.
- Shoulder Seasons: Implement dynamic pricing that bridges peak and low rates. Target weekend travelers, local events, and business visitors. Slightly more flexible terms than peak season can help maintain occupancy without deep discounting.
- Regularly analyze your own performance against these Oiso seasonality benchmarks and adjust your pricing and availability strategy accordingly.
Do You Need a License for Airbnb in Oiso?
Yes, Oiso, Kanagawa Prefecture, Japan enforces high STR regulations and 94% of active listings show registration evidence — indicating that enforcement is active and compliance is a prerequisite for operating legally. Hosts entering this market should budget for permit fees, inspections, and potential occupancy tax obligations as part of their startup costs. Always verify the latest short-term rental regulations and Airbnb license requirements directly with local government authorities for Oiso to ensure full compliance before hosting.
(Source: AirROI data, 2026, based on 94% licensed listings)
What Are the Best Neighborhoods for Airbnb in Oiso?
With a compact short-term rental market, Oiso gives early-mover hosts an advantage in the right neighborhoods. The areas listed below are where guest demand and local attractions converge — a useful lens for investors evaluating whether to enter this market and where to position their listing.
| Neighborhood / Area | Why Host Here? (Target Guests & Appeal) | Key Attractions & Landmarks |
|---|---|---|
| Oiso Beach | Oiso Beach is a popular coastal area known for its beautiful sandy beaches and vibrant summer atmosphere. It attracts many tourists looking to relax by the sea and enjoy water activities. | Oiso Beach, Oiso Long Beach, Seikado Noh Theatre, Oiso Onsen, Oiso Park |
| Kamakura | Nearby Kamakura is famous for its historical temples and the Great Buddha. It's a cultural hub that draws tourists interested in history and traditional Japanese architecture. | Great Buddha of Kamakura, Hase-dera Temple, Tsurugaoka Hachimangu Shrine, Kamakura Hiking Trails, Kamakura Beach |
| Hakone | Hakone is known for its hot springs and stunning views of Mount Fuji. It attracts visitors looking for relaxation and luxury accommodations in a picturesque setting. | Lake Ashi, Hakone Open-Air Museum, Owakudani Valley, Gora Park, Hakone Shrine |
| Shonan | Shonan is a vibrant area known for its beaches and surfing culture. It's a great spot for younger crowds and families looking for beach activities and nightlife. | Shonan Beach, Fujisawa Beach, Enoshima Island, Shonan Surf Areas, Local Restaurants |
| Oiso Golf Course | The Oiso Golf Course attracts golf enthusiasts and those looking for peaceful and scenic stays while enjoying golfing facilities. | Oiso Golf Course, Golf driving ranges, Beautiful Landscapes |
| Enoshima | Enoshima is a popular island destination with beautiful beaches, shrines, and stunning views. It's perfect for tourists seeking adventure and relaxation in nature. | Enoshima Island, Enoshima Shrine, Enoshima Sea Candle, Beach activities, Dining options with ocean views |
| Yamakita | Yamakita is a mountainous area that offers a different perspective of Kanagawa's natural beauty, popular for nature lovers seeking a quieter stay. | Mount Yama, Yamakita Park, Hiking Trails, Local countryside activities |
| Atsugi | Atsugi is an urban center that provides a mix of city life and access to nature, attracting business travelers and families alike with its amenities and attractions. | Atsugi City Park, Shopping Centers, Local Cuisine, Atsugi Nature Park |
Because Oiso has a high regulation profile, confirming that short-term rental permits are available in your target neighborhood is a critical first step before committing to a property purchase. Regulation can vary at the neighborhood or district level even within the same city.
What Types of Properties Are on Airbnb in Oiso?
Room Type Distribution
Property Type Distribution
Market Composition Insights for Oiso
- The Oiso Airbnb market composition is heavily skewed towards Entire Home/Apt listings, which make up 66.7% of the 18 active rentals. This indicates strong guest preference for privacy and space.
- However, a notable 33.3% share for Private Rooms suggests opportunities for budget-conscious travelers or hosts renting out spare rooms.
- Looking at the property type distribution in Oiso, House properties are the most common (61.1%), reflecting the local real estate landscape.
- Houses represent a significant 61.1% portion, catering likely to families or larger groups.
Oiso Airbnb Room Capacity Analysis (2026): Bedroom Distribution
Distribution of Listings by Number of Bedrooms
Room Capacity Insights for Oiso
- The dominant room capacity in Oiso is 1 bedroom listings, making up 50% of the market. This suggests a strong demand for properties suitable for couples or solo travelers.
- Together, 1 bedroom and 2 bedrooms properties represent 66.7% of the active Airbnb listings in Oiso, indicating a high concentration in these sizes.
Oiso Vacation Rental Guest Capacity Trends (2026)
Distribution of Listings by Guest Capacity
Guest Capacity Insights for Oiso
- The most common guest capacity trend in Oiso vacation rentals is listings accommodating 4 guests (22.2%). This suggests the primary traveler segment is likely small families or groups.
- Properties designed for 4 guests and 2 guests dominate the Oiso STR market, accounting for 33.3% of listings.
- 22.2% of properties accommodate 6+ guests, serving the market segment for larger families or group travel in Oiso.
- On average, properties in Oiso are equipped to host 3.1 guests.
What Amenities Do Airbnb Guests Expect in Oiso?
Amenity Prevalence
Amenity Insights for Oiso
- Essential amenities in Oiso that guests expect include: Wifi, Air conditioning, Smoke alarm, Shampoo, Microwave, Hair dryer, Dishes and silverware, Washer. Lacking these (any) could significantly impact bookings.
- Popular amenities like Heating, Essentials are common but not universal. Offering these can provide a competitive edge.
Recommendations for Hosts
- Ensure your listing includes all essential amenities for Oiso: Wifi, Air conditioning, Smoke alarm, Shampoo, Microwave, Hair dryer, Dishes and silverware, Washer.
- Consider adding popular differentiators like Heating or Essentials to increase appeal.
- Highlight unique or less common amenities you offer (e.g., hot tub, dedicated workspace, EV charger) in your listing description and photos.
- Regularly check competitor amenities in Oiso to stay competitive.
Dive Deeper: Advanced Oiso STR Market Data (2026)
Ready to unlock more insights? AirROI provides access to advanced metrics and comprehensive Airbnb data for Oiso. Explore detailed analytics beyond this report to refine your investment strategy, optimize pricing, and maximize your vacation rental profits.
Explore Advanced MetricsOiso Airbnb Guest Demographics & Profile Analysis (2026)
Guest Profile Summary for Oiso
- The typical guest profile for Airbnb in Oiso consists of a mix of domestic (39%) and international guests, with top international origins including United States, typically belonging to the Post-2000s (Gen Z/Alpha) group (50%), primarily speaking English or Japanese.
- Domestic travelers account for 38.8% of guests.
- Key international markets include Japan (38.8%) and United States (15.5%).
- Top languages spoken are English (41.5%) followed by Japanese (23.6%).
- A significant demographic segment is the Post-2000s (Gen Z/Alpha) group, representing 50% of guests.
Recommendations for Hosts
- Focus marketing internationally, particularly towards travelers from United States.
- Tailor amenities and listing descriptions to appeal to the dominant Post-2000s (Gen Z/Alpha) demographic (e.g., highlight fast WiFi, smart home features, local guides).
- Highlight unique local experiences or amenities relevant to the primary guest profile.
- Consider seasonal promotions aligned with peak travel times for key origin markets.
Oiso Airbnb Booking Patterns (2026): Available vs. Booked Days
Available Days Distribution
Booked Days Distribution
Booking Pattern Insights for Oiso
- The most common availability pattern in Oiso falls within the 181-270 days range, representing 55.6% of listings. This suggests many properties have significant open periods on their calendars.
- Approximately 77.8% of listings show high availability (181+ days open annually), indicating potential for increased bookings or specific owner usage patterns.
- For booked days, the 91-180 days range is most frequent in Oiso (55.6%), reflecting common guest stay durations or potential owner blocking patterns.
- A notable 27.8% of properties secure long booking periods (181+ days booked per year), highlighting successful long-term rental strategies or significant owner usage.
How Far in Advance Do Guests Book Airbnb in Oiso?
Average Booking Lead Time by Month
Booking Lead Time Insights for Oiso
- The overall average booking lead time for vacation rentals in Oiso is 27 days.
- Guests book furthest in advance for stays during December (average 43 days), likely coinciding with peak travel demand or local events.
- The shortest booking windows occur for stays in June (average 18 days), indicating more last-minute travel plans during this time.
- Seasonally, Winter (32 days avg.) sees the longest lead times, while Spring (21 days avg.) has the shortest, reflecting typical travel planning cycles.
Recommendations for Hosts
- Use the overall average lead time (27 days) as a baseline for your pricing and availability strategy in Oiso.
- For December stays, consider implementing length-of-stay discounts or slightly higher rates for bookings made less than 43 days out to capitalize on advance planning.
- Target marketing efforts for the Winter season well in advance (at least 32 days) to capture early planners.
- Monitor your own booking lead times against these Oiso averages to identify opportunities for dynamic pricing adjustments.
Oiso Airbnb Minimum Stay Requirements Analysis
Distribution of Listings by Minimum Night Requirement
1 Night
14 listings
77.8% of total
2 Nights
2 listings
11.1% of total
3 Nights
1 listings
5.6% of total
30+ Nights
1 listings
5.6% of total
Key Insights
- The most prevalent minimum stay requirement in Oiso is 1 Night, adopted by 77.8% of listings. This highlights the market's preference for shorter, flexible bookings.
- A strong majority (88.9%) of the Oiso Airbnb data shows acceptance of very short stays (1-2 nights), indicating a dynamic, high-turnover market.
Recommendations
- Align with the market by considering a 1 Night minimum stay, as 77.8% of Oiso hosts use this setting.
- Explore offering discounts for stays of 30+ nights to attract the 5.6% of the market seeking extended stays.
- Adjust minimum nights based on seasonality – potentially shorter during low season and longer during peak demand periods in Oiso.
Oiso Airbnb Cancellation Policy Trends Analysis (2026)
Moderate
9 listings
50% of total
Firm
7 listings
38.9% of total
Strict
2 listings
11.1% of total
Cancellation Policy Insights for Oiso
- The prevailing Airbnb cancellation policy trend in Oiso is Moderate, used by 50% of listings.
- There's a relatively balanced mix between guest-friendly (50.0%) and stricter (50.0%) policies, offering choices for different guest needs.
Recommendations for Hosts
- Consider adopting a Moderate policy to align with the 50% market standard in Oiso.
- Using a Strict policy might deter some guests, as only 11.1% of listings use it. Evaluate if potential revenue protection outweighs possible lower booking rates.
- Regularly review your cancellation policy against competitors and market demand shifts in Oiso.
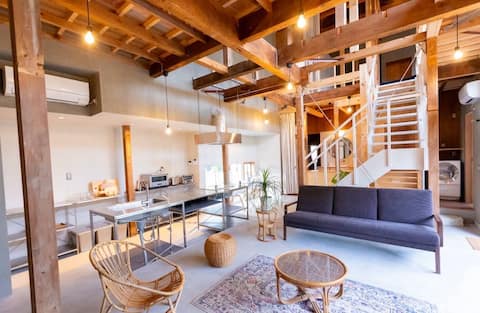
What Do the Top Airbnb Listings in Oiso Look Like?
Benchmark your potential! Explore examples of top-performing Airbnb properties in Oisobased on Trailing Twelve Month (TTM) revenue. Analyze their characteristics, revenue, occupancy rate, and ADR to understand what drives success in this market.

a OISO La〜森のサウナ〜 相模湾一望・こだわりの一軒家でのんびり大磯暮らし
Entire Place • 1 bedroom
4-minute walk to the sea, an open atrium
Entire Place • 3 bedrooms

a OISO La ~Stylish small villa with amazing view!
Entire Place • 1 bedroom
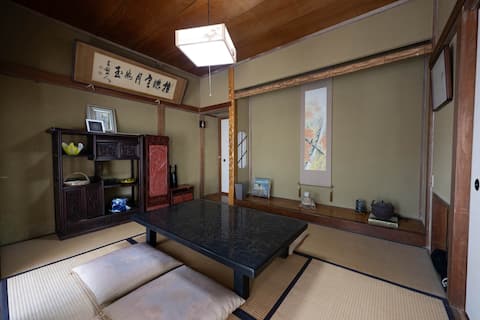
Karin Omoya ~Showa-Style House
Entire Place • 2 bedrooms

Enjoy a retro lifestyle in an old private house in Oiso (with good access to Kamakura, Hakone, and T
Entire Place • 1 bedroom

【Oiso 2-2】4 Minute walk to the Beach!
Entire Place • 1 bedroom
Note: Performance varies based on location, size, amenities, seasonality, and management quality. Data reflects the past 12 months.
Who Are the Top Airbnb Hosts in Oiso?
Learn from the best! This table showcases top-performing Airbnb hosts in Oiso based on the number of properties managed and estimated total revenue over the past year. Analyze their scale and performance metrics.
| Host Name | Properties | Grossing Revenue | Stay Reviews | Avg Rating |
|---|---|---|---|---|
| Akihiro | 2 | $131,444 | 136 | 4.89/5.0 |
| Tetsu | 6 | $49,809 | 304 | 4.54/5.0 |
| Hiroki | 1 | $46,425 | 132 | 4.88/5.0 |
| Ikuko | 4 | $33,157 | 932 | 4.88/5.0 |
| 富山 | 1 | $28,013 | 42 | 4.93/5.0 |
| Chika | 1 | $15,083 | 19 | 4.95/5.0 |
| Yohsuke | 1 | $9,312 | 12 | 5.00/5.0 |
| Ryo | 2 | $9,017 | 228 | 4.83/5.0 |
Analyzing the strategies of top hosts, such as their property selection, pricing, and guest communication, can offer valuable lessons for optimizing your own Airbnb operations in Oiso.
How Does Oiso's Airbnb Market Compare to Nearby Cities?
How does the Oiso Airbnb market stack up against its neighbors? Compare key performance metrics like average monthly revenue, ADR, and occupancy rates in surrounding areas to understand the broader regional STR landscape.
Compared with Fujikawaguchiko, Oiso has 11 percentage points lower occupancy and about $143 lower ADR. That helps frame whether this market is winning more on demand, pricing, or both.
| Market | Active Properties | Monthly Revenue | Daily Rate | Avg. Occupancy |
|---|---|---|---|---|
| Futtsu | 30 | $5,141 | $397.52 | 43% |
| Kyonan | 16 | $4,728 | $453.02 | 42% |
| Kamogawa | 37 | $4,325 | $319.72 | 38% |
| Hakone | 312 | $4,240 | $302.23 | 49% |
| Shirako | 22 | $4,101 | $333.44 | 35% |
| Miyota | 39 | $4,029 | $295.40 | 43% |
| Karuizawa | 120 | $4,012 | $408.95 | 40% |
| Fujikawaguchiko | 434 | $3,944 | $258.48 | 53% |
| Oshino | 10 | $3,670 | $305.45 | 37% |
| Hokota | 16 | $3,595 | $272.77 | 47% |
Frequently Asked Questions About Airbnb in Oiso
These quick answers summarize the most common investor and operator questions using AirROI's latest market data for Oiso.
How much do Airbnb hosts make in Oiso?
Oiso hosts earn about $17,903 per year on average, with an average nightly rate of $115 and RevPAR of N/A. Those figures describe the typical revenue environment for active listings in Oiso, Kanagawa Prefecture, not the ceiling for the best operators. Source: AirROI 2025 data, Oiso market, October 2024 to September 2025.
What is the average Airbnb occupancy rate in Oiso?
The average Airbnb occupancy rate in Oiso is 41.9%. August is the strongest month and January is the softest, so hosts should expect demand to move meaningfully throughout the year rather than stay flat.
What is the average Airbnb daily rate in Oiso?
Listings in Oiso average $115 per night. The broader pricing spread also matters: lower-performing listings cluster closer to the lower quartiles, while premium homes can price materially above the city average when demand spikes or listing quality stands out.
How many Airbnb listings are active in Oiso?
Oiso currently has about 18 active Airbnb listings in AirROI's market dataset. That supply count helps explain how competitive the market is, how much depth there is for benchmarking, and whether the market behaves like a niche destination or a scaled urban market.
How strict are short-term rental regulations in Oiso?
AirROI currently classifies the short-term rental regulation level in Oiso as High. The dataset also shows about 94.4% of listings with registration evidence. That is a market signal, not legal advice, so hosts should still confirm current licensing and compliance rules locally before listing.
What is the RevPAR for Airbnb in Oiso?
RevPAR in Oiso is about N/A. That metric combines pricing and occupancy into one efficiency number, so it is often a better quick benchmark than ADR alone when investors want to compare how well listings convert nightly rates into realized revenue.
Is Airbnb profitable in Oiso?
At 41.9% occupancy, Oiso can be profitable — but margins depend heavily on operating costs, property acquisition price, and how well hosts optimize pricing across seasons. Average annual revenue is $17,903, but individual returns depend on property type, location within the city, and the host's operating efficiency.
How far in advance do guests book Airbnb in Oiso?
The average booking lead time in Oiso is about 27 days — a moderate lead time that gives hosts planning visibility while still benefiting from last-minute bookings. Hosts who understand their market's booking cadence can adjust minimum stays and pricing windows accordingly.
What are the best neighborhoods for Airbnb in Oiso?
Based on AirROI's analysis, some of the top neighborhoods for short-term rentals in Oiso include Oiso Beach, Kamakura, Hakone. Each area attracts different guest profiles — from business travelers to leisure visitors — so the best location depends on the property type and target audience a host is aiming for. See the full neighborhood breakdown above.
What type of property performs best on Airbnb in Oiso?
entire_home listings make up 66.7% of the active supply in Oiso. The most common configuration does not always mean the most profitable — operators who identify underserved property types or bedroom counts can sometimes outperform the market average by filling a gap in local supply.
How does Oiso compare to nearby Airbnb markets?
Among neighboring markets, Futtsu posts $61,691 in average annual revenue with 42.5% occupancy, compared to Oiso's $17,903 and 41.9%. Comparing nearby markets helps investors understand whether a destination's performance reflects local demand or broader regional trends.
When is the peak season for Airbnb in Oiso?
August is the highest-revenue month in Oiso, while January is the softest. The revenue spread between them indicates moderate seasonality with a clear peak period, giving hosts opportunities to maximize rates during high demand without facing dramatic off-season drops.
About AirROI Market Data
AirROI tracks over 20 million properties across 190+ countries and maintains 15+ years of historical performance data, making it one of the deepest Airbnb and STR intelligence platforms available. The analytics pipeline aggregates listing-level data monthly — revenue, occupancy, nightly rates, RevPAR, guest demographics, booking patterns, and competitive supply — so investors and operators can benchmark any market against its own history and against neighboring destinations.
Real estate investors, property managers, financial institutions, hedge funds, tourism boards, hospitality consultants, tech platforms, and academic researchers rely on AirROI data to underwrite acquisitions, optimize pricing, model macro trends, and conduct peer-reviewed research. Data is available through in-depth market reports like this one and the Airbnb API with 22 endpoints and an Airbnb MCP Server for AI agents.
AirROI proprietary analytics as of 2025-09-30. Metrics reflect trailing twelve-month aggregates from active listings. Revenue figures are market averages, not projections. Neighborhood descriptions are AI-generated and reviewed for accuracy. For full methodology, see the data methodology page.