Mooloolaba, Queensland Airbnb Market Data 2026: STR Report & Statistics
How much can you earn on Airbnb in Mooloolaba, Queensland? Based on AirROI's 2026 dataset (July 2025 – June 2026), the short answer is $24,385 per year — at a $291 nightly rate, 40.4% occupancy, and a $113 RevPAR that reflects moderate rate-to-revenue efficiency with room to optimize.
At 89 active listings, Mooloolaba is a boutique market where moderate demand with room for well-positioned listings to outperform.
Regulation is low with minimal registration requirements, pointing to an operator-friendly environment. In a market this size, differentiated listings with strong reviews can capture outsized returns relative to the competition.
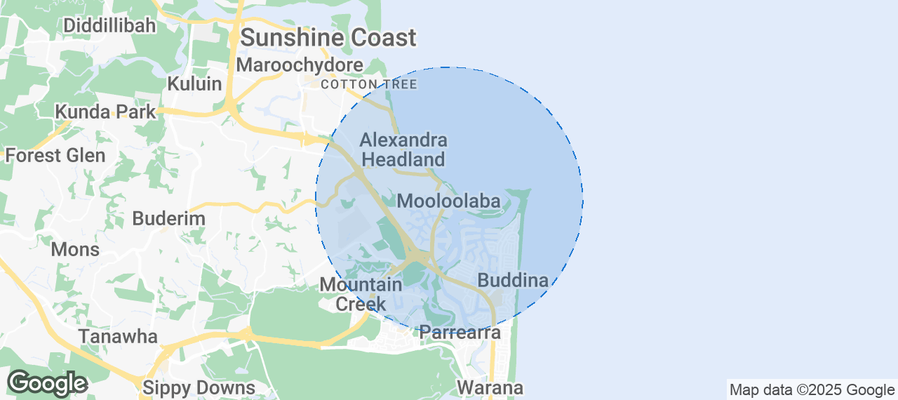
Table of Contents [hide] [show]
What Are the Key Airbnb Metrics in Mooloolaba?
In Mooloolaba, the headline Airbnb metrics are $24,385 in average annual revenue,40.4% occupancy, $291 ADR, and $113 in RevPAR, and guests book about 36 days in advance.
How Much Do Airbnb Hosts Earn Monthly in Mooloolaba?
Understanding the monthly revenue variations for Airbnb listings in Mooloolaba is key to maximizing your short term rental income potential. Seasonality significantly impacts earnings. Our analysis, based on data from the past 12 months, shows that the peak revenue month for STRs in Mooloolaba is typically December, while May often presents the lowest earnings, highlighting opportunities for strategic pricing adjustments during shoulder and low seasons. Explore the typical Airbnb income in Mooloolaba across different performance tiers:
- Best-in-class properties (Top 10%) achieve $7,083+ monthly, often utilizing dynamic pricing and superior guest experiences.
- Strong performing properties (Top 25%) earn $4,546 or more, indicating effective management and desirable locations/amenities.
- Typical properties (Median) generate around $3,195 per month, representing the average market performance.
- Entry-level properties (Bottom 25%) see earnings around $1,787, often with potential for optimization.
Average Monthly Airbnb Earnings Trend in Mooloolaba
What Is the Monthly Airbnb Occupancy Rate in Mooloolaba?
Maximize your bookings by understanding the Mooloolaba STR occupancy trends. Seasonal demand shifts significantly influence how often properties are booked. Typically, Decembersees the highest demand (peak season occupancy), while May experiences the lowest (low season). Effective strategies, like adjusting minimum stays or offering promotions, can boost occupancy during slower periods. Here's how different property tiers perform in Mooloolaba:
- Best-in-class properties (Top 10%) achieve 79%+ occupancy, indicating high desirability and potentially optimized availability.
- Strong performing properties (Top 25%) maintain 63% or higher occupancy, suggesting good market fit and guest satisfaction.
- Typical properties (Median) have an occupancy rate around 42%.
- Entry-level properties (Bottom 25%) average 22% occupancy, potentially facing higher vacancy.
Average Monthly Occupancy Rate Trend in Mooloolaba
What Is the Average Airbnb Nightly Rate in Mooloolaba?
Effective short term rental pricing strategy in Mooloolaba involves understanding monthly ADR fluctuations. The Average Daily Rate (ADR) for Airbnb in Mooloolaba typically peaks in April and dips lowest during February. Leveraging Airbnb dynamic pricing tools or strategies based on this seasonality can significantly boost revenue. Here's a look at the typical nightly rates achieved:
- Best-in-class properties (Top 10%) command rates of $465+ per night, often due to premium features or locations.
- Strong performing properties (Top 25%) achieve nightly rates of $346 or more.
- Typical properties (Median) charge around $264 per night.
- Entry-level properties (Bottom 25%) earn around $203 per night.
Average Daily Rate (ADR) Trend by Month in Mooloolaba
What Is the RevPAR for Airbnb in Mooloolaba?
RevPAR in Mooloolaba is currently $113. Because RevPAR combines nightly rates with realized occupancy, it is one of the cleanest ways to compare how efficiently listings turn demand into revenue across the market.
- Entry-level properties (Bottom 25%) see $77 RevPAR.
- Typical properties (Median) generate $101 RevPAR.
- Strong performers (Top 25%) earn $127 RevPAR.
- Best-in-class (Top 10%) achieve $202 RevPAR.
Average Monthly RevPAR Trend in Mooloolaba
RevPAR Insights for Mooloolaba
- The average RevPAR in Mooloolaba is $113. This metric combines nightly rates with realized occupancy, making it one of the best single-number indicators of market efficiency.
- The gap between the top 10% ($202) and bottom 25% ($77) is $125, indicating significant performance disparity driven by property quality, pricing strategy, and location.
- RevPAR peaks in Dec and bottoms out in May, mirroring the broader seasonal demand pattern and suggesting opportunities for dynamic pricing.
Recommendations for Hosts
- Track your own RevPAR monthly against these Mooloolaba benchmarks. If your RevPAR falls below the median of $101, examine whether low occupancy or low ADR is the primary drag.
- Top-quartile listings achieve $127+ RevPAR through a combination of competitive pricing, strong reviews, and strategic amenities. Target this tier through incremental improvements.
- Use RevPAR rather than revenue alone when comparing properties of different sizes — it normalizes for available nights and gives a more accurate picture of performance.
Get Live Mooloolaba Market Intelligence 👇
Explore Real-time Analytics
When Is the Peak Season for Airbnb in Mooloolaba?
Mooloolaba's peak Airbnb season falls in December, January, September, while the softest stretch is February, May, June. Overall, the market shows highly seasonal trends requiring careful strategy, which should guide pricing, minimum stays, and cash-flow planning.
Peak Season (December, January, September)
- Revenue averages $4,781 per month
- Occupancy rates average 51.0%
- Daily rates average $298
Shoulder Season
- Revenue averages $3,643 per month
- Occupancy maintains around 45.3%
- Daily rates hold near $288
Low Season (February, May, June)
- Revenue drops to average $2,568 per month
- Occupancy decreases to average 34.6%
- Daily rates adjust to average $278
Seasonality Insights for Mooloolaba
- Airbnb seasonality in Mooloolaba is pronounced. Revenue swings sharply between peak and low months, which means pricing strategy, minimum-stay settings, and cash reserves all need to account for extended slower periods.
- During the high season, the absolute peak month showcases Mooloolaba's highest earning potential, with monthly revenues climbing to $5,348, occupancy reaching 53.8%, and ADRs peaking at $320.
- Conversely, the slowest single month marks the market's lowest point — revenue may dip to $2,464, occupancy could drop to 32.6%, and ADRs may adjust to $265.
- Understanding both the seasonal averages and these monthly peaks and troughs in revenue, occupancy, and ADR is crucial for maximizing your Airbnb profit potential in Mooloolaba.
Seasonal Strategies for Maximizing Profit
- Peak Season: Maximize revenue through premium pricing and potentially longer minimum stays. Ensure high availability and consider tightening cancellation policies to reduce last-minute gaps.
- Low Season: Offer competitive pricing, extended-stay discounts, and flexible cancellation policies. Target off-season travelers like remote workers, budget-conscious guests, and travelers with flexible schedules.
- Shoulder Seasons: Implement dynamic pricing that bridges peak and low rates. Target weekend travelers, local events, and business visitors. Slightly more flexible terms than peak season can help maintain occupancy without deep discounting.
- In a highly seasonal market like Mooloolaba, building a cash reserve during the top months is essential for covering fixed costs during the slow period. Automated pricing tools can help capture demand shifts in real time.
Do You Need a License for Airbnb in Mooloolaba?
Low regulation and minimal registration activity in Mooloolaba, Queensland, Australia point to an operator-friendly environment. That said, even low-regulation markets may have tax collection requirements, safety standards, or HOA rules that affect short-term rental operations. Always verify the latest short-term rental regulations and Airbnb license requirements directly with local government authorities for Mooloolaba to ensure full compliance before hosting.
(Source: AirROI data, 2026, finding no licensed listings among those analyzed)
What Are the Best Neighborhoods for Airbnb in Mooloolaba?
Mooloolaba is a smaller vacation rental market where a handful of neighborhoods drive most of the booking activity. Choosing the right area is especially important in boutique markets — there is less room for a mediocre location to succeed on volume alone. The areas below highlight where short-term rental demand is strongest and why.
| Neighborhood / Area | Why Host Here? (Target Guests & Appeal) | Key Attractions & Landmarks |
|---|---|---|
| Mooloolaba Beach | Stunning and popular beach destination known for its beautiful sandy beaches and vibrant dining scene. It attracts a variety of tourists including families and couples looking for a relaxing beach getaway. | Mooloolaba Esplanade, Underwater World, Mooloolaba Beach, Mooloolaba Wharf, Surf Life Saving Club, Spit Beach |
| Alexandra Headland | Adjacent to Mooloolaba, this area boasts a laid-back atmosphere and excellent surf conditions. It's popular among surfers and beachgoers seeking a more relaxed vibe while still being close to Mooloolaba's attractions. | Alex Beach, Headland Park, Alexandra Headland Surf Club, Ocean Terrace, Mooloolaba Walking Path, Local cafes and shops |
| Golden Beach | A family-friendly beachfront area with a relaxed atmosphere, Golden Beach offers calmer waters and is great for families with children, making it an appealing option for family-friendly vacation rentals. | Golden Beach, Caloundra Jet Ski, Paddleboarding, Local playgrounds, Golden Beach Parade |
| Caloundra | Further south along the coast, Caloundra has a wide range of beaches with stunning views. It's a popular holiday destination that attracts families, couples, and retirees, providing ample investment opportunities. | Kings Beach, Bulcock Beach, Caloundra Main Street, Caloundra Lighthouses, Happy Valley |
| Noosa Heads | A little further up the coast, Noosa Heads is renowned for its national parks, stylish boutiques, and fine dining. It attracts a more upscale clientele and offers premium rental opportunities. | Noosa National Park, Hastings Street, Main Beach, Noosa River, Noosa Spit Reserve |
| Buddina | Less crowded compared to Mooloolaba, Buddina offers a more residential feel while still being close to the beach. A hidden gem for those seeking quieter accommodations without sacrificing access to attractions. | Buddina Beach, La Balsa Park, Point Cartwright, Kawana Shoppingworld |
| Maroochydore | As one of the Sunshine Coast's major hubs, Maroochydore has a mix of urban convenience with proximity to beaches. It's growing in popularity with travelers looking for a central location to explore the Sunshine Coast. | Maroochydore Beach, Sunshine Plaza, Cotton Tree Park, Maroochy River |
| Peregian Beach | A quieter alternative to Noosa, Peregian Beach features a beautiful beach and community vibe. It's ideal for those looking for a peaceful beach escape with a local charm. | Peregian Beach, Peregian Village, Peregian Springs, Local surf spots |
With 8 distinct neighborhoods showing meaningful short-term rental activity, Mooloolaba offers diversification within a single market. Investors can tailor their strategy — from high-turnover tourist zones to quieter residential areas that attract longer stays and remote workers.
What Types of Properties Are on Airbnb in Mooloolaba?
Room Type Distribution
Property Type Distribution
Market Composition Insights for Mooloolaba
- The Mooloolaba Airbnb market composition is heavily skewed towards Entire Home/Apt listings, which make up 98.9% of the 89 active rentals. This indicates strong guest preference for privacy and space.
- Looking at the property type distribution in Mooloolaba, Apartment/Condo properties are the most common (75.3%), reflecting the local real estate landscape.
- Houses represent a significant 21.3% portion, catering likely to families or larger groups.
- Smaller segments like others, hotel/boutique (combined 3.3%) offer potential for unique stay experiences.
Mooloolaba Airbnb Room Capacity Analysis (2026): Bedroom Distribution
Distribution of Listings by Number of Bedrooms
Room Capacity Insights for Mooloolaba
- The dominant room capacity in Mooloolaba is 2 bedrooms listings, making up 42.7% of the market. This suggests a strong demand for properties suitable for couples or solo travelers.
- Together, 2 bedrooms and 3 bedrooms properties represent 70.8% of the active Airbnb listings in Mooloolaba, indicating a high concentration in these sizes.
- A significant 36.0% of listings offer 3+ bedrooms, catering to larger groups and families seeking more space in Mooloolaba.
Mooloolaba Vacation Rental Guest Capacity Trends (2026)
Distribution of Listings by Guest Capacity
Guest Capacity Insights for Mooloolaba
- The most common guest capacity trend in Mooloolaba vacation rentals is listings accommodating 4 guests (36%). This suggests the primary traveler segment is likely small families or groups.
- Properties designed for 4 guests and 6 guests dominate the Mooloolaba STR market, accounting for 60.7% of listings.
- 40.4% of properties accommodate 6+ guests, serving the market segment for larger families or group travel in Mooloolaba.
- On average, properties in Mooloolaba are equipped to host 4.8 guests.
How Do Listings in Mooloolaba Compare on Quality?
Listing quality in Mooloolaba can be approximated through presentation depth, bedroom count, and how often hosts disclose exact locations. These signals show how professionally the local supply base is merchandised.
Listing Quality Insights for Mooloolaba
- At 20.3 photos per listing on average, Mooloolaba hosts invest well in visual presentation. Listings with 20+ photos consistently outperform in search ranking and conversion.
- 66.3% of listings show their exact location. Lower disclosure rates can increase booking hesitation — guests want to know exactly where they are staying.
Recommendations for Hosts
- Enable exact location if possible — it removes a common source of guest uncertainty and can improve your listing's position in map-based searches.
- Use these quality indicators as a self-audit checklist. Listings that exceed the Mooloolaba averages across all three metrics are better positioned for premium pricing.
What Amenities Do Airbnb Guests Expect in Mooloolaba?
Amenity Prevalence
Amenity Insights for Mooloolaba
- Essential amenities in Mooloolaba that guests expect include: TV, Smoke alarm, Wifi, Washer. Lacking these (any) could significantly impact bookings.
- Popular amenities like Bed linens, Kitchen, Free parking on premises are common but not universal. Offering these can provide a competitive edge.
Recommendations for Hosts
- Ensure your listing includes all essential amenities for Mooloolaba: TV, Smoke alarm, Wifi, Washer.
- Prioritize adding missing essentials: TV, Smoke alarm, Wifi, Washer.
- Consider adding popular differentiators like Bed linens or Kitchen to increase appeal.
- Highlight unique or less common amenities you offer (e.g., hot tub, dedicated workspace, EV charger) in your listing description and photos.
- Regularly check competitor amenities in Mooloolaba to stay competitive.
Which Airbnb Amenities Boost Revenue in Mooloolaba?
Not every amenity matters equally. This table focuses on the amenities most associated with higher revenue in Mooloolaba, which makes it more useful for prioritizing upgrades than a simple popularity list alone.
| Amenity | Prevalence | Revenue With | Revenue Without | Revenue Uplift |
|---|---|---|---|---|
Microwave | 91.0% | $25,811 | $9,951 | 159.4% |
Stove | 88.8% | $26,072 | $11,060 | 135.7% |
Bed linens | 94.4% | $25,081 | $12,695 | 97.6% |
Refrigerator | 88.8% | $25,765 | $13,482 | 91.1% |
Gym | 10.1% | $42,386 | $22,360 | 89.6% |
Kitchen | 94.4% | $25,033 | $13,506 | 85.3% |
Dishwasher | 78.7% | $26,677 | $15,940 | 67.4% |
Air conditioning | 91.0% | $25,295 | $15,177 | 66.7% |
Waterfront | 41.6% | $31,271 | $19,486 | 60.5% |
Hot tub | 15.7% | $34,405 | $22,515 | 52.8% |
Revenue Impact Insights for Mooloolaba
- Microwave tops the revenue impact list with a 159.4% uplift — listings with this amenity earn $25,811 vs. $9,951 without it.
- Microwave, Stove, Bed linens, Refrigerator, Kitchen, Air conditioning — while widespread — still correlate with meaningful revenue gains, making them table stakes rather than true differentiators.
Recommendations for Hosts
- Focus your upgrade budget on amenities in the top half of this table. Below-median amenities may improve guest experience but contribute less to revenue growth.
- Highlight revenue-impacting amenities prominently in your listing title, photos, and description — guests can't value what they don't notice.
Dive Deeper: Advanced Mooloolaba STR Market Data (2026)
Ready to unlock more insights? AirROI provides access to advanced metrics and comprehensive Airbnb data for Mooloolaba. Explore detailed analytics beyond this report to refine your investment strategy, optimize pricing, and maximize your vacation rental profits.
Explore Advanced MetricsMooloolaba Airbnb Guest Demographics & Profile Analysis (2026)
Guest Profile Summary for Mooloolaba
- The typical guest profile for Airbnb in Mooloolaba consists of primarily domestic travelers (78%), often arriving from nearby Brisbane, typically belonging to the Post-2000s (Gen Z/Alpha) group (50%), primarily speaking English or French.
- Domestic travelers account for 78.1% of guests.
- Key international markets include Australia (78.1%) and New Zealand (5.9%).
- Top languages spoken are English (76.3%) followed by French (6%).
- A significant demographic segment is the Post-2000s (Gen Z/Alpha) group, representing 50% of guests.
Recommendations for Hosts
- Target domestic marketing efforts towards travelers from Brisbane and Queensland.
- Tailor amenities and listing descriptions to appeal to the dominant Post-2000s (Gen Z/Alpha) demographic (e.g., highlight fast WiFi, smart home features, local guides).
- Highlight unique local experiences or amenities relevant to the primary guest profile.
- Consider seasonal promotions aligned with peak travel times for key origin markets.
What Are Airbnb Guest Ratings in Mooloolaba?
Listings in Mooloolaba average 4.71 out of 5 overall, with about 14.8 reviews per active listing and 28.1% of listings carrying the Guest Favorite badge.
Rating Breakdown by Category
Guest Rating Insights for Mooloolaba
- An average rating of 4.71 places Mooloolaba in solid territory. Most guests leave satisfied, though there is room for hosts to push toward the top tier.
- The strongest subcategory is Location (4.87), while Value (4.59) trails behind — a useful signal for hosts looking to prioritize upgrades.
- 28.1% of listings carry the Guest Favorite badge, a strong trust signal that can meaningfully lift click-through and booking rates.
Recommendations for Hosts
- Focus improvement efforts on Value — even small gains in the weakest subcategory can lift overall ratings and search ranking.
- Encourage guests to leave reviews after checkout. Listings with more reviews rank higher in search results and convert browsers into bookers more effectively.
- With only 28.1% of listings earning Guest Favorite status, hosts who consistently exceed expectations have a clear competitive advantage.
Mooloolaba Airbnb Booking Patterns (2026): Available vs. Booked Days
Available Days Distribution
Booked Days Distribution
Booking Pattern Insights for Mooloolaba
- The most common availability pattern in Mooloolaba falls within the 271-366 days range, representing 64% of listings. This suggests many properties have significant open periods on their calendars.
- Approximately 89.8% of listings show high availability (181+ days open annually), indicating potential for increased bookings or specific owner usage patterns.
- For booked days, the 31-90 days range is most frequent in Mooloolaba (47.2%), reflecting common guest stay durations or potential owner blocking patterns.
- A notable 10.1% of properties secure long booking periods (181+ days booked per year), highlighting successful long-term rental strategies or significant owner usage.
How Far in Advance Do Guests Book Airbnb in Mooloolaba?
Average Booking Lead Time by Month
Booking Lead Time Insights for Mooloolaba
- The overall average booking lead time for vacation rentals in Mooloolaba is 36 days.
- Guests book furthest in advance for stays during June (average 46 days), likely coinciding with peak travel demand or local events.
- The shortest booking windows occur for stays in July (average 24 days), indicating more last-minute travel plans during this time.
- Seasonally, Fall (39 days avg.) sees the longest lead times, while Winter (33 days avg.) has the shortest, reflecting typical travel planning cycles.
Recommendations for Hosts
- Use the overall average lead time (36 days) as a baseline for your pricing and availability strategy in Mooloolaba.
- Target marketing efforts for the Fall season well in advance (at least 39 days) to capture early planners.
- Monitor your own booking lead times against these Mooloolaba averages to identify opportunities for dynamic pricing adjustments.
What Is the Average Length of Stay for Airbnb in Mooloolaba?
Guests in Mooloolaba stay about 4.1 nights on average, generating roughly 1,642 reservations and 18.7 bookings per listing in the latest AirROI dataset. The most common check-in time is 2:00 PM and check-out is 10:00 AM.
Monthly Length of Stay in Mooloolaba
Check-in Time Distribution
Check-out Time Distribution
Stay Pattern Insights for Mooloolaba
- A mid-range stay length points to leisure-driven demand — weekend getaways and short vacations. Hosts should optimize for quick turnover efficiency while keeping the guest experience smooth.
- 18.7 bookings per listing is a manageable pace that balances revenue with operational overhead.
- Stay lengths peak in Dec (5.6 nights) and shorten in Oct (3 nights). Adjust minimum-night requirements seasonally to match.
Recommendations for Hosts
- With shorter average stays, focus on streamlining turnover. Self-check-in, reliable cleaning crews, and pre-staged amenities can reduce per-booking operational costs.
- Set your check-in time to match or beat the market standard of 2:00 PM. Offering early check-in flexibility can be a low-cost differentiator.
- Monitor length-of-stay seasonality to adjust minimum-night requirements — longer minimums during peak periods maximize revenue while shorter minimums fill gaps in shoulder seasons.
Mooloolaba Airbnb Minimum Stay Requirements Analysis
Distribution of Listings by Minimum Night Requirement
1 Night
6 listings
6.7% of total
2 Nights
40 listings
44.9% of total
3 Nights
3 listings
3.4% of total
4-6 Nights
4 listings
4.5% of total
7-29 Nights
2 listings
2.2% of total
30+ Nights
34 listings
38.2% of total
Key Insights
- The most prevalent minimum stay requirement in Mooloolaba is 2 Nights, adopted by 44.9% of listings. This highlights the market's preference for shorter, flexible bookings.
- A significant segment (38.2%) caters to monthly stays (30+ nights) in Mooloolaba, pointing to opportunities in the extended-stay market.
Recommendations
- Align with the market by considering a 2 Nights minimum stay, as 44.9% of Mooloolaba hosts use this setting.
- If feasible, allowing 1-night stays, especially midweek or during low season, could capture last-minute bookings, as only 6.7% currently do.
- A 2-night minimum appears standard (44.9%). Consider this for weekends or peak periods.
- Explore offering discounts for stays of 30+ nights to attract the 38.2% of the market seeking extended stays.
- Adjust minimum nights based on seasonality – potentially shorter during low season and longer during peak demand periods in Mooloolaba.
Mooloolaba Airbnb Cancellation Policy Trends Analysis (2026)
Super Strict 30 Days
12 listings
13.5% of total
Limited
7 listings
7.9% of total
Flexible
8 listings
9% of total
Moderate
32 listings
36% of total
Firm
28 listings
31.5% of total
Strict
2 listings
2.2% of total
Cancellation Policy Insights for Mooloolaba
- The prevailing Airbnb cancellation policy trend in Mooloolaba is Moderate, used by 36% of listings.
- There's a relatively balanced mix between guest-friendly (45.0%) and stricter (33.7%) policies, offering choices for different guest needs.
- Strict cancellation policies are quite rare (2.2%), potentially making listings with this policy less competitive unless justified by high demand or property type.
Recommendations for Hosts
- Consider adopting a Moderate policy to align with the 36% market standard in Mooloolaba.
- Using a Strict policy might deter some guests, as only 2.2% of listings use it. Evaluate if potential revenue protection outweighs possible lower booking rates.
- Regularly review your cancellation policy against competitors and market demand shifts in Mooloolaba.
How Much Are Airbnb Cleaning Fees in Mooloolaba?
Cleaning fees in Mooloolaba are meaningful operating levers, not just pass-through charges. What matters most is how often hosts charge them, how high they run relative to market norms, and how large a share of gross revenue they consume.
Cleaning Fee Insights for Mooloolaba
- 82.0% of listings charge a cleaning fee, making it standard practice in Mooloolaba. Guests expect it and factor it into their booking decisions.
- The average cleaning fee of $144 is close to the median ($136), suggesting a relatively consistent fee structure across the market.
- Cleaning fees represent 10.7% of gross revenue on average — a significant line item that impacts total guest cost and competitiveness.
Recommendations for Hosts
- Price your cleaning fee competitively against the Mooloolaba median of $136. Fees significantly above market norms can deter bookings, especially for shorter stays.
- Consider whether bundling the cleaning fee into a slightly higher nightly rate might improve conversion, since many guests filter by total price and separate fees can feel punitive.
- Monitor competitor cleaning fees regularly. Airbnb's search algorithm factors in total price, so a well-calibrated cleaning fee can improve your listing's ranking.
What Do the Top Airbnb Listings in Mooloolaba Look Like?
Benchmark your potential! Explore examples of top-performing Airbnb properties in Mooloolababased on Trailing Twelve Month (TTM) revenue. Analyze their characteristics, revenue, occupancy rate, and ADR to understand what drives success in this market.
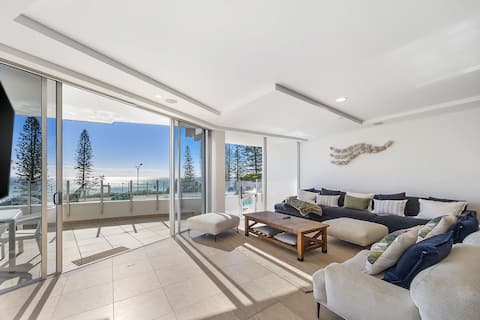
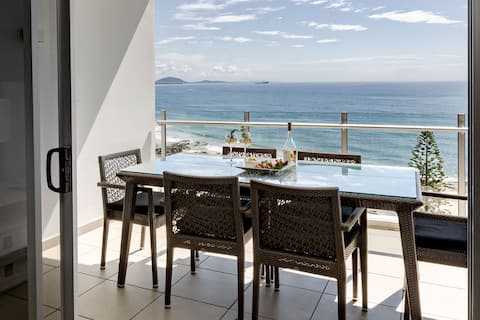
Oceans 203 Luxury Beachfront Apt
Entire Place • 3 bedrooms
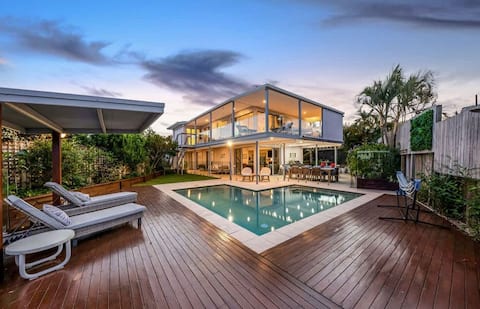
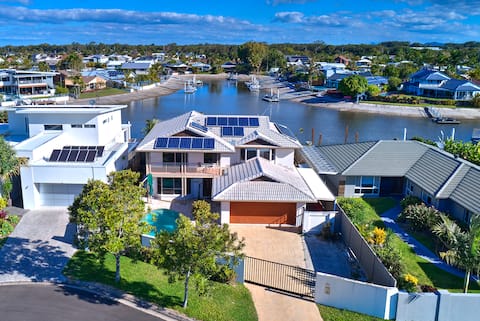
Luxury 5BR Mooloolaba Canal Front Waterfront Stay
Entire Place • 5 bedrooms
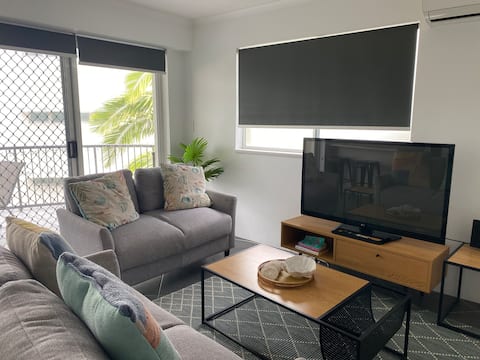
Mooloolaba retreat, close to beach FREE parking.
Entire Place • 2 bedrooms
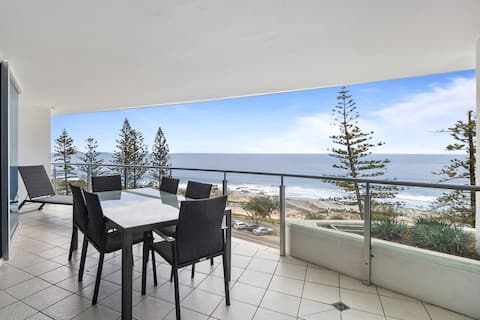
Steps to Ocean & Dining | Theatre | Heated Pool
Entire Place • 3 bedrooms
Large Waterfront Home With Pool
Entire Place • 4 bedrooms
Sirocco 606 magnificent 2 bedroom apartment
Entire Place • 2 bedrooms
Note: Performance varies based on location, size, amenities, seasonality, and management quality. Data reflects the past 12 months.
Who Are the Top Airbnb Hosts in Mooloolaba?
Learn from the best! This table showcases top-performing Airbnb hosts in Mooloolaba based on the number of properties managed and estimated total revenue over the past year. Analyze their scale and performance metrics.
| Host Name | Properties | Grossing Revenue | Stay Reviews | Avg Rating |
|---|---|---|---|---|
| SunnyBNB | 10 | $292,362 | 121 | 4.06/5.0 |
| Holiday Mooloolaba | 4 | $268,476 | 30 | 4.82/5.0 |
| G1 Holidays | 5 | $140,381 | 15 | 4.81/5.0 |
| 5 Star Management | 4 | $115,318 | 134 | 4.97/5.0 |
| Michelle | 2 | $88,526 | 80 | 4.64/5.0 |
| Allure Mooloolaba | 4 | $86,496 | 10 | 4.83/5.0 |
| Dan | 1 | $73,675 | 41 | 4.59/5.0 |
| Jody | 1 | $72,117 | 20 | 5.00/5.0 |
| Breeze Mooloolaba | 7 | $66,087 | 59 | 4.83/5.0 |
| Coco Mooloolaba | 3 | $52,418 | 4 | Not Rated |
Analyzing the strategies of top hosts, such as their property selection, pricing, and guest communication, can offer valuable lessons for optimizing your own Airbnb operations in Mooloolaba.
Who Are the Airbnb Hosts in Mooloolaba?
Mooloolaba is a quality-focused market, with a high Superhost share and fairly mature operating standards.
Host Profile Insights for Mooloolaba
- With 50.6% Superhosts, Mooloolaba has an experienced host base that sets high guest expectations. New entrants should plan for competitive quality standards.
- 43.8% of listings are professionally managed, indicating a mature, competitive market with institutional players.
- 21.3% of listings have Instant Book enabled. Lower Instant Book adoption means many guests must request approval, which can slow conversions.
- 84.3% of listings use Airbnb's simplified pricing (host-only fee), where the host pays the entire platform service fee and the guest sees one all-in price with no separate Airbnb service charge. High adoption signals a professional, PMS-connected host base — Airbnb mandates simplified pricing for software-connected listings.
Recommendations for Hosts
- Consider enabling Instant Book — it reduces booking friction and Airbnb's algorithm tends to favor Instant Book listings in search results.
- With 27.0% cohosted listings, there may be a growing local market for property management services.
- Benchmark your host metrics against these Mooloolaba averages regularly and adjust your hosting strategy based on what top performers do differently.
Top Professional Management Companies in Mooloolaba
These are the highest-grossing professional property management operations in Mooloolaba, ranked by total revenue across their portfolio. Their performance metrics offer a benchmark for what institutional-level hosting looks like in this market.
| Company | Listings | Revenue | ADR | Occ. | Rating |
|---|---|---|---|---|---|
| SunnyBNB | 10 | $292,362 | $345 | 38.9% | 4.06/5 |
| Holiday Mooloolaba | 4 | $268,476 | $461 | 41.7% | 4.82/5 |
| G1 Holidays | 5 | $140,381 | $317 | 33.7% | 4.81/5 |
| Allure Mooloolaba | 4 | $86,496 | $356 | 27.1% | 4.83/5 |
| Breeze Mooloolaba | 7 | $66,087 | $353 | 15.1% | 4.83/5 |
| Coco Mooloolaba | 3 | $52,418 | $341 | 28.2% | N/A |
| Lily | 1 | $44,191 | $199 | 59.5% | 4.73/5 |
| Adam | 3 | $39,886 | $214 | 37.8% | 4.82/5 |
| Welcome Ready Holiday Homes | 2 | $36,959 | $249 | 40.5% | 4.79/5 |
| Define Property | 1 | $34,839 | $221 | 46.5% | 4.50/5 |
Management Company Insights for Mooloolaba
- The leading management company, SunnyBNB, operates 10 listings with $292,362 in gross revenue — a useful benchmark for what scale looks like in Mooloolaba.
- Top managers average 4 properties each, suggesting professional management in Mooloolaba still operates at a relatively boutique scale.
- Professionally managed listings in the top tier average 4.69/5 in guest ratings — suggesting room for quality improvement even among larger operators.
Recommendations
- Study how top management companies price, position, and maintain their portfolios — their ADR and occupancy rates reflect strategies refined across dozens of listings.
- If you're considering hiring a property manager, compare their portfolio performance against these benchmarks before committing.
How Does Mooloolaba's Airbnb Market Compare to Nearby Cities?
How does the Mooloolaba Airbnb market stack up against its neighbors? Compare key performance metrics like average monthly revenue, ADR, and occupancy rates in surrounding areas to understand the broader regional STR landscape.
Compared with Happy Valley, Mooloolaba has 16 percentage points lower occupancy and about $30 higher ADR. That helps frame whether this market is winning more on demand, pricing, or both.
| Market | Active Properties | Monthly Revenue | Daily Rate | Avg. Occupancy |
|---|---|---|---|---|
| Castaways Beach | 19 | $5,446 | $504.59 | 51% |
| Kingfisher Bay | 29 | $4,501 | $355.35 | 47% |
| Point Lookout | 27 | $4,301 | $587.60 | 36% |
| Marcus Beach | 21 | $4,217 | $409.50 | 47% |
| Noosa Heads | 1,054 | $4,192 | $409.95 | 46% |
| Happy Valley | 11 | $4,092 | $260.17 | 56% |
| Sunrise Beach | 107 | $3,878 | $361.90 | 46% |
| Sunshine Beach | 296 | $3,410 | $424.03 | 41% |
| Helensvale | 10 | $3,337 | $481.22 | 43% |
| Mudjimba | 13 | $3,299 | $279.16 | 56% |
Frequently Asked Questions About Airbnb in Mooloolaba
These quick answers summarize the most common investor and operator questions using AirROI's latest market data for Mooloolaba.
How much do Airbnb hosts make in Mooloolaba?
Mooloolaba hosts earn about $24,385 per year on average, with an average nightly rate of $291 and RevPAR of $113. Those figures describe the typical revenue environment for active listings in Mooloolaba, Queensland, not the ceiling for the best operators. Source: AirROI 2026 data, Mooloolaba market, July 2025 to June 2026.
What is the average Airbnb occupancy rate in Mooloolaba?
The average Airbnb occupancy rate in Mooloolaba is 40.4%. December is the strongest month and May is the softest, so hosts should expect demand to move meaningfully throughout the year rather than stay flat.
What is the average Airbnb daily rate in Mooloolaba?
Listings in Mooloolaba average $291 per night. The broader pricing spread also matters: lower-performing listings cluster closer to the lower quartiles, while premium homes can price materially above the city average when demand spikes or listing quality stands out.
How many Airbnb listings are active in Mooloolaba?
Mooloolaba currently has about 89 active Airbnb listings in AirROI's market dataset. That supply count helps explain how competitive the market is, how much depth there is for benchmarking, and whether the market behaves like a niche destination or a scaled urban market.
How strict are short-term rental regulations in Mooloolaba?
AirROI currently classifies the short-term rental regulation level in Mooloolaba as Low. The dataset also shows about 0.0% of listings with registration evidence. That is a market signal, not legal advice, so hosts should still confirm current licensing and compliance rules locally before listing.
What is the RevPAR for Airbnb in Mooloolaba?
RevPAR in Mooloolaba is about $113. That metric combines pricing and occupancy into one efficiency number, so it is often a better quick benchmark than ADR alone when investors want to compare how well listings convert nightly rates into realized revenue.
Is Airbnb profitable in Mooloolaba?
At 40.4% occupancy, Mooloolaba can be profitable — but margins depend heavily on operating costs, property acquisition price, and how well hosts optimize pricing across seasons. Average annual revenue is $24,385, but individual returns depend on property type, location within the city, and the host's operating efficiency.
How far in advance do guests book Airbnb in Mooloolaba?
The average booking lead time in Mooloolaba is about 36 days — a moderate lead time that gives hosts planning visibility while still benefiting from last-minute bookings. Hosts who understand their market's booking cadence can adjust minimum stays and pricing windows accordingly.
What are the best neighborhoods for Airbnb in Mooloolaba?
Based on AirROI's analysis, some of the top neighborhoods for short-term rentals in Mooloolaba include Mooloolaba Beach, Alexandra Headland, Golden Beach. Each area attracts different guest profiles — from business travelers to leisure visitors — so the best location depends on the property type and target audience a host is aiming for. See the full neighborhood breakdown above.
What type of property performs best on Airbnb in Mooloolaba?
entire_home listings make up 98.9% of the active supply in Mooloolaba. The most common configuration does not always mean the most profitable — operators who identify underserved property types or bedroom counts can sometimes outperform the market average by filling a gap in local supply.
How does Mooloolaba compare to nearby Airbnb markets?
Among neighboring markets, Castaways Beach posts $65,354 in average annual revenue with 51.1% occupancy, compared to Mooloolaba's $24,385 and 40.4%. Comparing nearby markets helps investors understand whether a destination's performance reflects local demand or broader regional trends.
What is the average length of stay in Mooloolaba?
The average Airbnb stay length in Mooloolaba is about 4.1 nights. That matters for turnover, cleaning operations, and pricing strategy because shorter stays increase changeovers while longer stays can smooth occupancy and reduce operational friction.
What is the average Airbnb guest rating in Mooloolaba?
Airbnb listings in Mooloolaba average 4.71 out of 5 overall. About 28.1% of listings carry the guest favorite badge, which suggests a meaningful share of inventory is competing on review quality rather than price alone.
Which amenities boost Airbnb revenue in Mooloolaba?
Microwave and Stove are among the strongest revenue-linked amenities in Mooloolaba. In AirROI's latest dataset, listings with these amenities outperform those without on average revenue, which makes amenities analysis useful for prioritizing investment and listing upgrades.
Do Airbnb hosts charge cleaning fees in Mooloolaba?
Yes. About 82.0% of active Airbnb listings in Mooloolaba charge a cleaning fee, and the average fee is $144. The more important operating benchmark is how much of gross revenue that fee consumes, not just the absolute dollar amount.
What percentage of Airbnb hosts are Superhosts in Mooloolaba?
A 50.6% Superhost rate signals a highly competitive market where review quality and responsiveness are table stakes, not differentiators.
About AirROI Market Data
AirROI tracks over 20 million properties across 190+ countries and maintains 15+ years of historical performance data, making it one of the deepest Airbnb and STR intelligence platforms available. The analytics pipeline aggregates listing-level data monthly — revenue, occupancy, nightly rates, RevPAR, guest demographics, booking patterns, and competitive supply — so investors and operators can benchmark any market against its own history and against neighboring destinations.
Real estate investors, property managers, financial institutions, hedge funds, tourism boards, hospitality consultants, tech platforms, and academic researchers rely on AirROI data to underwrite acquisitions, optimize pricing, model macro trends, and conduct peer-reviewed research. Data is available through in-depth market reports like this one and the Airbnb API with 22 endpoints and an Airbnb MCP Server for AI agents.
AirROI proprietary analytics as of 2026-06-30. Metrics reflect trailing twelve-month aggregates from active listings. Revenue figures are market averages, not projections. Neighborhood descriptions are AI-generated and reviewed for accuracy. For full methodology, see the data methodology page.