East Victoria Park, Western Australia Airbnb Market Data 2026: STR Report & Statistics
How much can you earn on Airbnb in East Victoria Park, Western Australia? Based on AirROI's 2026 dataset (July 2025 – June 2026), the short answer is $28,828 per year — at a $157 nightly rate, 59.7% occupancy, and a $97 RevPAR that reflects strong rate-to-revenue efficiency across the market.
At 54 active listings, East Victoria Park is a boutique market where solid booking activity throughout the year. Supply grew 8.0% over the past year, yet revenue and nightly rates both trended upward — a signal that traveler demand is outpacing new inventory rather than being diluted by it. For hosts, pricing power remains intact even as competition increases.
Regulation is high and 100% of listings show active registration — compliance is the cost of entry. In a market this size, differentiated listings with strong reviews can capture outsized returns relative to the competition.

Table of Contents [hide] [show]
What Are the Key Airbnb Metrics in East Victoria Park?
In East Victoria Park, the headline Airbnb metrics are $28,828 in average annual revenue,59.7% occupancy, $157 ADR, and $97 in RevPAR, and guests book about 42 days in advance.
How Much Do Airbnb Hosts Earn Monthly in East Victoria Park?
Understanding the monthly revenue variations for Airbnb listings in East Victoria Park is key to maximizing your short term rental income potential. Seasonality significantly impacts earnings. Our analysis, based on data from the past 12 months, shows that the peak revenue month for STRs in East Victoria Park is typically November, while June often presents the lowest earnings, highlighting opportunities for strategic pricing adjustments during shoulder and low seasons. Explore the typical Airbnb income in East Victoria Park across different performance tiers:
- Best-in-class properties (Top 10%) achieve $5,875+ monthly, often utilizing dynamic pricing and superior guest experiences.
- Strong performing properties (Top 25%) earn $4,650 or more, indicating effective management and desirable locations/amenities.
- Typical properties (Median) generate around $3,046 per month, representing the average market performance.
- Entry-level properties (Bottom 25%) see earnings around $1,289, often with potential for optimization.
Average Monthly Airbnb Earnings Trend in East Victoria Park
What Is the Monthly Airbnb Occupancy Rate in East Victoria Park?
Maximize your bookings by understanding the East Victoria Park STR occupancy trends. Seasonal demand shifts significantly influence how often properties are booked. Typically, Novembersees the highest demand (peak season occupancy), while June experiences the lowest (low season). Effective strategies, like adjusting minimum stays or offering promotions, can boost occupancy during slower periods. Here's how different property tiers perform in East Victoria Park:
- Best-in-class properties (Top 10%) achieve 91%+ occupancy, indicating high desirability and potentially optimized availability.
- Strong performing properties (Top 25%) maintain 84% or higher occupancy, suggesting good market fit and guest satisfaction.
- Typical properties (Median) have an occupancy rate around 69%.
- Entry-level properties (Bottom 25%) average 43% occupancy, potentially facing higher vacancy.
Average Monthly Occupancy Rate Trend in East Victoria Park
What Is the Average Airbnb Nightly Rate in East Victoria Park?
Effective short term rental pricing strategy in East Victoria Park involves understanding monthly ADR fluctuations. The Average Daily Rate (ADR) for Airbnb in East Victoria Park typically peaks in April and dips lowest during August. Leveraging Airbnb dynamic pricing tools or strategies based on this seasonality can significantly boost revenue. Here's a look at the typical nightly rates achieved:
- Best-in-class properties (Top 10%) command rates of $279+ per night, often due to premium features or locations.
- Strong performing properties (Top 25%) achieve nightly rates of $214 or more.
- Typical properties (Median) charge around $130 per night.
- Entry-level properties (Bottom 25%) earn around $71 per night.
Average Daily Rate (ADR) Trend by Month in East Victoria Park
What Is the RevPAR for Airbnb in East Victoria Park?
RevPAR in East Victoria Park is currently $97. Because RevPAR combines nightly rates with realized occupancy, it is one of the cleanest ways to compare how efficiently listings turn demand into revenue across the market.
- Entry-level properties (Bottom 25%) see $37 RevPAR.
- Typical properties (Median) generate $92 RevPAR.
- Strong performers (Top 25%) earn $139 RevPAR.
- Best-in-class (Top 10%) achieve $173 RevPAR.
Average Monthly RevPAR Trend in East Victoria Park
RevPAR Insights for East Victoria Park
- The average RevPAR in East Victoria Park is $97. This metric combines nightly rates with realized occupancy, making it one of the best single-number indicators of market efficiency.
- The gap between the top 10% ($173) and bottom 25% ($37) is $136, indicating significant performance disparity driven by property quality, pricing strategy, and location.
- RevPAR peaks in Nov and bottoms out in Jun, mirroring the broader seasonal demand pattern and suggesting opportunities for dynamic pricing.
Recommendations for Hosts
- Track your own RevPAR monthly against these East Victoria Park benchmarks. If your RevPAR falls below the median of $92, examine whether low occupancy or low ADR is the primary drag.
- Top-quartile listings achieve $139+ RevPAR through a combination of competitive pricing, strong reviews, and strategic amenities. Target this tier through incremental improvements.
- Use RevPAR rather than revenue alone when comparing properties of different sizes — it normalizes for available nights and gives a more accurate picture of performance.
Get Live East Victoria Park Market Intelligence 👇
Explore Real-time Analytics
When Is the Peak Season for Airbnb in East Victoria Park?
East Victoria Park's peak Airbnb season falls in November, October, December, while the softest stretch is January, May, June. Overall, the market shows moderate seasonality with distinct peak and low periods, which should guide pricing, minimum stays, and cash-flow planning.
Peak Season (November, October, December)
- Revenue averages $3,813 per month
- Occupancy rates average 67.7%
- Daily rates average $143
Shoulder Season
- Revenue averages $3,205 per month
- Occupancy maintains around 63.7%
- Daily rates hold near $149
Low Season (January, May, June)
- Revenue drops to average $2,663 per month
- Occupancy decreases to average 54.6%
- Daily rates adjust to average $158
Seasonality Insights for East Victoria Park
- The Airbnb seasonality pattern in East Victoria Park shows moderate seasonality with distinct peak and low periods. While the sections above show seasonal averages, it is also insightful to look at the extremes:
- During the high season, the absolute peak month showcases East Victoria Park's highest earning potential, with monthly revenues climbing to $3,983, occupancy reaching 69.7%, and ADRs peaking at $169.
- Conversely, the slowest single month marks the market's lowest point — revenue may dip to $2,322, occupancy could drop to 45.6%, and ADRs may adjust to $133.
- Understanding both the seasonal averages and these monthly peaks and troughs in revenue, occupancy, and ADR is crucial for maximizing your Airbnb profit potential in East Victoria Park.
Seasonal Strategies for Maximizing Profit
- Peak Season: Maximize revenue through premium pricing. In a high-regulation market like East Victoria Park, ensure your permit covers the number of nights you plan to book — some jurisdictions cap annual rental days.
- Low Season: Even in a market with solid annual occupancy, the slower months benefit from competitive pricing and flexible check-in/check-out windows. Target remote workers and extended-stay travelers who value value over peak-season amenities.
- Shoulder Seasons: Implement dynamic pricing that bridges peak and low rates. Target weekend travelers, local events, and business visitors. Slightly more flexible terms than peak season can help maintain occupancy without deep discounting.
- Regularly analyze your own performance against these East Victoria Park seasonality benchmarks and adjust your pricing and availability strategy accordingly.
Do You Need a License for Airbnb in East Victoria Park?
Yes, East Victoria Park, Western Australia, Australia enforces high STR regulations and 100% of active listings show registration evidence — indicating that enforcement is active and compliance is a prerequisite for operating legally. Hosts entering this market should budget for permit fees, inspections, and potential occupancy tax obligations as part of their startup costs. Always verify the latest short-term rental regulations and Airbnb license requirements directly with local government authorities for East Victoria Park to ensure full compliance before hosting.
(Source: AirROI data, 2026, based on 100% licensed listings)
What Are the Best Neighborhoods for Airbnb in East Victoria Park?
East Victoria Park is a smaller vacation rental market where a handful of neighborhoods drive most of the booking activity. Choosing the right area is especially important in boutique markets — there is less room for a mediocre location to succeed on volume alone. The areas below highlight where short-term rental demand is strongest and why.
| Neighborhood / Area | Why Host Here? (Target Guests & Appeal) | Key Attractions & Landmarks |
|---|---|---|
| East Victoria Park | A vibrant suburb close to Perth city, known for its cafes, restaurants, and parks. It provides a mix of urban and suburban living, making it attractive for both tourists and long-term renters. | McCallum Park, The Balmoral Hotel, Victoria Park Farmers Market, Crown Perth, Perth Golf Centre, Echo Park |
| Burswood | An entertainment precinct with the Crown Casino and Optus Stadium, ideal for guests visiting for events and gaming. The area also features beautiful river views and parklands. | Crown Perth, Optus Stadium, Victoria Park Foreshore, Burswood Park, The Camfield, Perth Zoo |
| South Perth | A picturesque suburb across the river from Perth's CBD, known for its stunning views of the skyline and proximity to recreational areas. Popular with tourists and families. | South Perth Esplanade, Perth Zoo, Mends Street Jetty, Sir James Mitchell Park, The Old Mill, Jazz by the Bay |
| Nollamara | A growing suburb with affordable housing options, attracting families and individuals looking for proximity to the city. It offers various local amenities and parks. | Nollamara Park, Downs Park, Duncan Reserve, Karrinyup Shopping Centre, Mirrabooka Square |
| Tuart Hill | A suburban area with easy access to Perth city, known for its community vibe and parks. It's becoming popular for hosts targeting budget-conscious travelers. | Tuart Hill Community Centre, Parks and Recreation Facilities, Stirling Central Shopping Centre, Mirrabooka Shopping Centre |
| Mount Lawley | A trendy suburb known for its nightlife, cafes, and close proximity to the CBD. It's a prime location for young travelers looking for vibrant experiences. | Beaufort Street, Hyde Park, The Astor Theatre, Local bars and restaurants, Mount Lawley Golf Club |
| Maylands | An up-and-coming area with a mix of culture and nature, located near the Swan River. It's attractive for families and tourists looking for nature activities and local cafes. | Maylands Peninsula Golf Course, Swan River, Maylands Historical Society, Local Art Galleries, Cafes and Restaurants along 8th Avenue |
| Claremont | A high-end suburb known for its shopping center and proximity to the Swan River. Ideal for guests looking for a luxurious stay with access to fine dining and boutique shopping. | Claremont Quarter, Lake Claremont, Claremont Showground, Local parks and gardens, Swanbourne Beach |
Because East Victoria Park has a high regulation profile, confirming that short-term rental permits are available in your target neighborhood is a critical first step before committing to a property purchase. Regulation can vary at the neighborhood or district level even within the same city.
What Types of Properties Are on Airbnb in East Victoria Park?
Room Type Distribution
Property Type Distribution
Market Composition Insights for East Victoria Park
- The East Victoria Park Airbnb market composition is heavily skewed towards Entire Home/Apt listings, which make up 68.5% of the 54 active rentals. This indicates strong guest preference for privacy and space.
- However, a notable 31.5% share for Private Rooms suggests opportunities for budget-conscious travelers or hosts renting out spare rooms.
- Looking at the property type distribution in East Victoria Park, House properties are the most common (72.2%), reflecting the local real estate landscape.
- Houses represent a significant 72.2% portion, catering likely to families or larger groups.
- Smaller segments like others, hotel/boutique (combined 5.6%) offer potential for unique stay experiences.
East Victoria Park Airbnb Room Capacity Analysis (2026): Bedroom Distribution
Distribution of Listings by Number of Bedrooms
Room Capacity Insights for East Victoria Park
- The dominant room capacity in East Victoria Park is 1 bedroom listings, making up 25.9% of the market. This suggests a strong demand for properties suitable for couples or solo travelers.
- Together, 1 bedroom and 3 bedrooms properties represent 50.0% of the active Airbnb listings in East Victoria Park, indicating a high concentration in these sizes.
- A significant 33.4% of listings offer 3+ bedrooms, catering to larger groups and families seeking more space in East Victoria Park.
East Victoria Park Vacation Rental Guest Capacity Trends (2026)
Distribution of Listings by Guest Capacity
Guest Capacity Insights for East Victoria Park
- The most common guest capacity trend in East Victoria Park vacation rentals is listings accommodating 2 guests (18.5%). This suggests the primary traveler segment is likely couples or solo travelers.
- Properties designed for 2 guests and 6 guests dominate the East Victoria Park STR market, accounting for 35.2% of listings.
- 31.5% of properties accommodate 6+ guests, serving the market segment for larger families or group travel in East Victoria Park.
- On average, properties in East Victoria Park are equipped to host 3.4 guests.
How Do Listings in East Victoria Park Compare on Quality?
Listing quality in East Victoria Park can be approximated through presentation depth, bedroom count, and how often hosts disclose exact locations. These signals show how professionally the local supply base is merchandised.
Listing Quality Insights for East Victoria Park
- At 32 photos per listing on average, East Victoria Park hosts invest well in visual presentation. Listings with 20+ photos consistently outperform in search ranking and conversion.
- 24.1% of listings show their exact location. Lower disclosure rates can increase booking hesitation — guests want to know exactly where they are staying.
Recommendations for Hosts
- Enable exact location if possible — it removes a common source of guest uncertainty and can improve your listing's position in map-based searches.
- Use these quality indicators as a self-audit checklist. Listings that exceed the East Victoria Park averages across all three metrics are better positioned for premium pricing.
What Amenities Do Airbnb Guests Expect in East Victoria Park?
Amenity Prevalence
Amenity Insights for East Victoria Park
- Essential amenities in East Victoria Park that guests expect include: Air conditioning, Wifi. Lacking these (any) could significantly impact bookings.
- Popular amenities like Dishes and silverware, Hot water, Kitchen are common but not universal. Offering these can provide a competitive edge.
Recommendations for Hosts
- Ensure your listing includes all essential amenities for East Victoria Park: Air conditioning, Wifi.
- Prioritize adding missing essentials: Wifi.
- Consider adding popular differentiators like Dishes and silverware or Hot water to increase appeal.
- Highlight unique or less common amenities you offer (e.g., hot tub, dedicated workspace, EV charger) in your listing description and photos.
- Regularly check competitor amenities in East Victoria Park to stay competitive.
Which Airbnb Amenities Boost Revenue in East Victoria Park?
Not every amenity matters equally. This table focuses on the amenities most associated with higher revenue in East Victoria Park, which makes it more useful for prioritizing upgrades than a simple popularity list alone.
| Amenity | Prevalence | Revenue With | Revenue Without | Revenue Uplift |
|---|---|---|---|---|
Dishes and silverware | 90.7% | $31,512 | $2,527 | 1147.0% |
Hot water | 90.7% | $31,417 | $3,457 | 808.7% |
Heating | 87.0% | $32,305 | $5,485 | 488.9% |
TV | 81.5% | $34,022 | $5,973 | 469.6% |
Iron | 83.3% | $33,313 | $6,405 | 420.1% |
Hot water kettle | 79.6% | $33,504 | $10,550 | 217.6% |
Refrigerator | 85.2% | $31,977 | $10,721 | 198.3% |
Hangers | 85.2% | $31,940 | $10,936 | 192.1% |
Dishwasher | 46.3% | $43,980 | $15,766 | 179.0% |
Hair dryer | 81.5% | $32,703 | $11,780 | 177.6% |
Revenue Impact Insights for East Victoria Park
- Dishes and silverware tops the revenue impact list with a 1147.0% uplift — listings with this amenity earn $31,512 vs. $2,527 without it.
- Dishes and silverware, Hot water, Heating, TV, Iron, Refrigerator, Hangers, Hair dryer — while widespread — still correlate with meaningful revenue gains, making them table stakes rather than true differentiators.
Recommendations for Hosts
- Focus your upgrade budget on amenities in the top half of this table. Below-median amenities may improve guest experience but contribute less to revenue growth.
- Highlight revenue-impacting amenities prominently in your listing title, photos, and description — guests can't value what they don't notice.
Dive Deeper: Advanced East Victoria Park STR Market Data (2026)
Ready to unlock more insights? AirROI provides access to advanced metrics and comprehensive Airbnb data for East Victoria Park. Explore detailed analytics beyond this report to refine your investment strategy, optimize pricing, and maximize your vacation rental profits.
Explore Advanced MetricsEast Victoria Park Airbnb Guest Demographics & Profile Analysis (2026)
Guest Profile Summary for East Victoria Park
- The typical guest profile for Airbnb in East Victoria Park consists of a mix of domestic (53%) and international guests, often arriving from nearby Perth, typically belonging to the Post-2000s (Gen Z/Alpha) group (50%), primarily speaking English or Chinese.
- Domestic travelers account for 53.4% of guests.
- Key international markets include Australia (53.4%) and Singapore (16%).
- Top languages spoken are English (57.7%) followed by Chinese (10.7%).
- A significant demographic segment is the Post-2000s (Gen Z/Alpha) group, representing 50% of guests.
Recommendations for Hosts
- Balance marketing efforts between domestic and international channels based on the guest mix.
- Tailor amenities and listing descriptions to appeal to the dominant Post-2000s (Gen Z/Alpha) demographic (e.g., highlight fast WiFi, smart home features, local guides).
- Highlight unique local experiences or amenities relevant to the primary guest profile.
- Consider seasonal promotions aligned with peak travel times for key origin markets.
What Are Airbnb Guest Ratings in East Victoria Park?
Listings in East Victoria Park average 4.85 out of 5 overall, with about 74.1 reviews per active listing and 53.7% of listings carrying the Guest Favorite badge.
Rating Breakdown by Category
Guest Rating Insights for East Victoria Park
- With an overall rating of 4.85, East Victoria Park listings meet an exceptionally high bar. Guests consistently report strong satisfaction, which drives repeat bookings and referral traffic.
- The strongest subcategory is Communication (4.91), while Value (4.79) trails behind — a useful signal for hosts looking to prioritize upgrades.
- 53.7% of listings carry the Guest Favorite badge, a strong trust signal that can meaningfully lift click-through and booking rates.
Recommendations for Hosts
- Focus improvement efforts on Value — even small gains in the weakest subcategory can lift overall ratings and search ranking.
- Encourage guests to leave reviews after checkout. Listings with more reviews rank higher in search results and convert browsers into bookers more effectively.
East Victoria Park Airbnb Booking Patterns (2026): Available vs. Booked Days
Available Days Distribution
Booked Days Distribution
Booking Pattern Insights for East Victoria Park
- The most common availability pattern in East Victoria Park falls within the 91-180 days range, representing 37% of listings. This suggests many properties have significant open periods on their calendars.
- Approximately 48.1% of listings show high availability (181+ days open annually), indicating potential for increased bookings or specific owner usage patterns.
- For booked days, the 181-270 days range is most frequent in East Victoria Park (40.7%), reflecting common guest stay durations or potential owner blocking patterns.
- A notable 55.5% of properties secure long booking periods (181+ days booked per year), highlighting successful long-term rental strategies or significant owner usage.
How Far in Advance Do Guests Book Airbnb in East Victoria Park?
Average Booking Lead Time by Month
Booking Lead Time Insights for East Victoria Park
- The overall average booking lead time for vacation rentals in East Victoria Park is 42 days.
- Guests book furthest in advance for stays during November (average 70 days), likely coinciding with peak travel demand or local events.
- The shortest booking windows occur for stays in August (average 29 days), indicating more last-minute travel plans during this time.
- Seasonally, Fall (58 days avg.) sees the longest lead times, while Spring (41 days avg.) has the shortest, reflecting typical travel planning cycles.
Recommendations for Hosts
- Use the overall average lead time (42 days) as a baseline for your pricing and availability strategy in East Victoria Park.
- For November stays, consider implementing length-of-stay discounts or slightly higher rates for bookings made less than 70 days out to capitalize on advance planning.
- Target marketing efforts for the Fall season well in advance (at least 58 days) to capture early planners.
- Monitor your own booking lead times against these East Victoria Park averages to identify opportunities for dynamic pricing adjustments.
What Is the Average Length of Stay for Airbnb in East Victoria Park?
Guests in East Victoria Park stay about 6.6 nights on average, generating roughly 1,502 reservations and 27.8 bookings per listing in the latest AirROI dataset. The most common check-in time is 3:00 PM and check-out is 10:00 AM.
Monthly Length of Stay in East Victoria Park
Check-in Time Distribution
Check-out Time Distribution
Stay Pattern Insights for East Victoria Park
- A mid-range stay length points to leisure-driven demand — weekend getaways and short vacations. Hosts should optimize for quick turnover efficiency while keeping the guest experience smooth.
- At 27.8 bookings per listing, the turnover rate is high. Hosts with streamlined operations (self-check-in, automated messaging, reliable cleaners) have a structural advantage.
- Stay lengths peak in Jan (7.9 nights) and shorten in May (4.6 nights). Adjust minimum-night requirements seasonally to match.
Recommendations for Hosts
- Leverage the longer-stay pattern by offering weekly discounts — even 5-10% off can convert browsing into bookings for guests considering an extended stay.
- Set your check-in time to match or beat the market standard of 3:00 PM. Offering early check-in flexibility can be a low-cost differentiator.
- Monitor length-of-stay seasonality to adjust minimum-night requirements — longer minimums during peak periods maximize revenue while shorter minimums fill gaps in shoulder seasons.
East Victoria Park Airbnb Minimum Stay Requirements Analysis
Distribution of Listings by Minimum Night Requirement
1 Night
5 listings
9.3% of total
2 Nights
12 listings
22.2% of total
3 Nights
6 listings
11.1% of total
4-6 Nights
9 listings
16.7% of total
7-29 Nights
2 listings
3.7% of total
30+ Nights
20 listings
37% of total
Key Insights
- The most prevalent minimum stay requirement in East Victoria Park is 30+ Nights, adopted by 37% of listings. This highlights the market's preference for longer commitments.
- A significant segment (37%) caters to monthly stays (30+ nights) in East Victoria Park, pointing to opportunities in the extended-stay market.
Recommendations
- Align with the market by considering a 30+ Nights minimum stay, as 37% of East Victoria Park hosts use this setting.
- If feasible, allowing 1-night stays, especially midweek or during low season, could capture last-minute bookings, as only 9.3% currently do.
- Explore offering discounts for stays of 30+ nights to attract the 37% of the market seeking extended stays.
- Adjust minimum nights based on seasonality – potentially shorter during low season and longer during peak demand periods in East Victoria Park.
East Victoria Park Airbnb Cancellation Policy Trends Analysis (2026)
Limited
3 listings
5.6% of total
Flexible
12 listings
22.2% of total
Moderate
17 listings
31.5% of total
Firm
15 listings
27.8% of total
Strict
7 listings
13% of total
Cancellation Policy Insights for East Victoria Park
- The prevailing Airbnb cancellation policy trend in East Victoria Park is Moderate, used by 31.5% of listings.
- There's a relatively balanced mix between guest-friendly (53.7%) and stricter (40.8%) policies, offering choices for different guest needs.
Recommendations for Hosts
- Consider adopting a Moderate policy to align with the 31.5% market standard in East Victoria Park.
- Using a Strict policy might deter some guests, as only 13% of listings use it. Evaluate if potential revenue protection outweighs possible lower booking rates.
- Regularly review your cancellation policy against competitors and market demand shifts in East Victoria Park.
How Much Are Airbnb Cleaning Fees in East Victoria Park?
Cleaning fees in East Victoria Park are meaningful operating levers, not just pass-through charges. What matters most is how often hosts charge them, how high they run relative to market norms, and how large a share of gross revenue they consume.
Cleaning Fee Insights for East Victoria Park
- 90.7% of listings charge a cleaning fee, making it standard practice in East Victoria Park. Guests expect it and factor it into their booking decisions.
- The average cleaning fee of $95 is close to the median ($80), suggesting a relatively consistent fee structure across the market.
- Cleaning fees represent 9.4% of gross revenue on average — a modest component of the overall booking price.
Recommendations for Hosts
- Price your cleaning fee competitively against the East Victoria Park median of $80. Fees significantly above market norms can deter bookings, especially for shorter stays.
- Monitor competitor cleaning fees regularly. Airbnb's search algorithm factors in total price, so a well-calibrated cleaning fee can improve your listing's ranking.
What Do the Top Airbnb Listings in East Victoria Park Look Like?
Benchmark your potential! Explore examples of top-performing Airbnb properties in East Victoria Parkbased on Trailing Twelve Month (TTM) revenue. Analyze their characteristics, revenue, occupancy rate, and ADR to understand what drives success in this market.
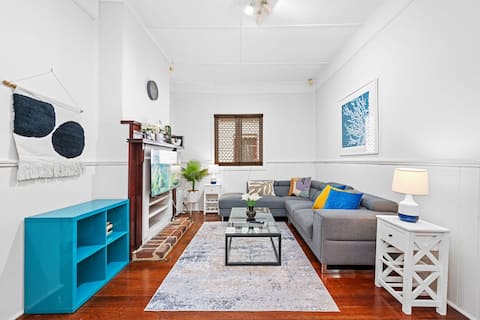
Cafe Strip Home | Alfresco | 3BR
Entire Place • 3 bedrooms
“Hidden Gem”
Entire Place • 3 bedrooms

Central Vic Park Living
Entire Place • 3 bedrooms
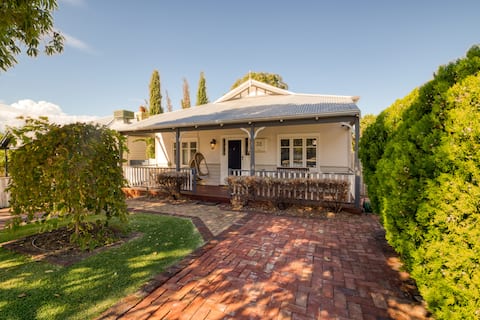
Classic Australian Charm
Entire Place • 4 bedrooms
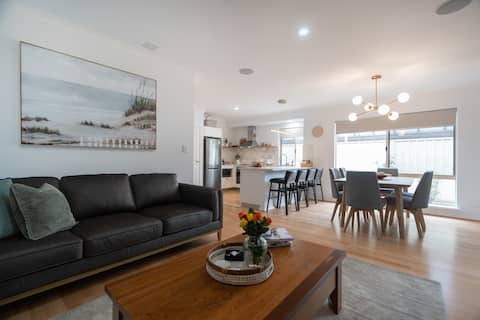
East Vic Park Lux New Home
Entire Place • 4 bedrooms

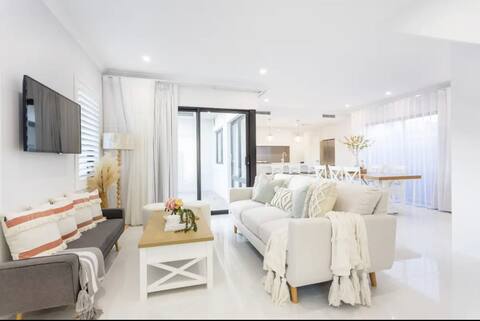
Perfectly located Perth Lotus Retreat.
Entire Place • 3 bedrooms
Note: Performance varies based on location, size, amenities, seasonality, and management quality. Data reflects the past 12 months.
Who Are the Top Airbnb Hosts in East Victoria Park?
Learn from the best! This table showcases top-performing Airbnb hosts in East Victoria Park based on the number of properties managed and estimated total revenue over the past year. Analyze their scale and performance metrics.
| Host Name | Properties | Grossing Revenue | Stay Reviews | Avg Rating |
|---|---|---|---|---|
| Jason | 4 | $169,935 | 817 | 4.78/5.0 |
| Mira | 2 | $88,949 | 67 | 4.81/5.0 |
| Lucy | 2 | $87,443 | 63 | 4.89/5.0 |
| James | 1 | $83,798 | 30 | 4.87/5.0 |
| Phoebe | 2 | $80,868 | 120 | 4.63/5.0 |
| Szczepan | 1 | $69,925 | 162 | 4.99/5.0 |
| Magnus | 2 | $65,145 | 184 | 4.73/5.0 |
| Thomas | 1 | $64,543 | 58 | 4.98/5.0 |
| Rachel | 1 | $64,248 | 24 | 4.58/5.0 |
| Matt | 2 | $61,729 | 117 | 4.89/5.0 |
Analyzing the strategies of top hosts, such as their property selection, pricing, and guest communication, can offer valuable lessons for optimizing your own Airbnb operations in East Victoria Park.
Who Are the Airbnb Hosts in East Victoria Park?
East Victoria Park is a quality-focused market, with a high Superhost share and fairly mature operating standards.
Host Profile Insights for East Victoria Park
- With 57.4% Superhosts, East Victoria Park has an experienced host base that sets high guest expectations. New entrants should plan for competitive quality standards.
- 3.7% of listings are professionally managed, reflecting a market still dominated by individual hosts.
- 0.0% of listings have Instant Book enabled. Lower Instant Book adoption means many guests must request approval, which can slow conversions.
- 85.2% of listings use Airbnb's simplified pricing (host-only fee), where the host pays the entire platform service fee and the guest sees one all-in price with no separate Airbnb service charge. High adoption signals a professional, PMS-connected host base — Airbnb mandates simplified pricing for software-connected listings.
Recommendations for Hosts
- Consider enabling Instant Book — it reduces booking friction and Airbnb's algorithm tends to favor Instant Book listings in search results.
- With 33.3% cohosted listings, there may be a growing local market for property management services.
- Benchmark your host metrics against these East Victoria Park averages regularly and adjust your hosting strategy based on what top performers do differently.
Top Professional Management Companies in East Victoria Park
These are the highest-grossing professional property management operations in East Victoria Park, ranked by total revenue across their portfolio. Their performance metrics offer a benchmark for what institutional-level hosting looks like in this market.
| Company | Listings | Revenue | ADR | Occ. | Rating |
|---|---|---|---|---|---|
| Phoebe | 2 | $80,868 | $200 | 54.6% | 4.63/5 |
Management Company Insights for East Victoria Park
- The leading management company, Phoebe, operates 2 listings with $80,868 in gross revenue — a useful benchmark for what scale looks like in East Victoria Park.
- Top managers average 2 properties each, suggesting professional management in East Victoria Park still operates at a relatively boutique scale.
- Professionally managed listings in the top tier average 4.64/5 in guest ratings — suggesting room for quality improvement even among larger operators.
Recommendations
- With only 3.7% of listings professionally managed, there may be an opportunity to differentiate through more structured operations and consistent guest experiences.
- Study how top management companies price, position, and maintain their portfolios — their ADR and occupancy rates reflect strategies refined across dozens of listings.
- If you're considering hiring a property manager, compare their portfolio performance against these benchmarks before committing.
How Does East Victoria Park's Airbnb Market Compare to Nearby Cities?
How does the East Victoria Park Airbnb market stack up against its neighbors? Compare key performance metrics like average monthly revenue, ADR, and occupancy rates in surrounding areas to understand the broader regional STR landscape.
Compared with Cottesloe, East Victoria Park has 4 percentage points lower occupancy and about $136 lower ADR. That helps frame whether this market is winning more on demand, pricing, or both.
| Market | Active Properties | Monthly Revenue | Daily Rate | Avg. Occupancy |
|---|---|---|---|---|
| Cottesloe | 144 | $4,190 | $292.85 | 64% |
| Hillarys | 12 | $3,410 | $415.12 | 52% |
| City of Joondalup | 47 | $3,294 | $268.03 | 52% |
| Shire Of Murray | 53 | $3,153 | $272.26 | 41% |
| South Fremantle | 102 | $3,064 | $233.92 | 60% |
| Shire Of Mundaring | 35 | $3,062 | $189.80 | 52% |
| North Fremantle | 58 | $3,013 | $235.47 | 62% |
| City of Perth | 39 | $3,012 | $191.04 | 58% |
| Scarborough | 96 | $2,954 | $265.50 | 58% |
| Dwellingup | 21 | $2,937 | $195.64 | 61% |
Frequently Asked Questions About Airbnb in East Victoria Park
These quick answers summarize the most common investor and operator questions using AirROI's latest market data for East Victoria Park.
How much do Airbnb hosts make in East Victoria Park?
East Victoria Park hosts earn about $28,828 per year on average, with an average nightly rate of $157 and RevPAR of $97. Those figures describe the typical revenue environment for active listings in East Victoria Park, Western Australia, not the ceiling for the best operators. Source: AirROI 2026 data, East Victoria Park market, July 2025 to June 2026.
What is the average Airbnb occupancy rate in East Victoria Park?
The average Airbnb occupancy rate in East Victoria Park is 59.7%. November is the strongest month and June is the softest, so hosts should expect demand to move meaningfully throughout the year rather than stay flat.
What is the average Airbnb daily rate in East Victoria Park?
Listings in East Victoria Park average $157 per night. The broader pricing spread also matters: lower-performing listings cluster closer to the lower quartiles, while premium homes can price materially above the city average when demand spikes or listing quality stands out.
How many Airbnb listings are active in East Victoria Park?
East Victoria Park currently has about 54 active Airbnb listings in AirROI's market dataset. That supply count helps explain how competitive the market is, how much depth there is for benchmarking, and whether the market behaves like a niche destination or a scaled urban market.
How strict are short-term rental regulations in East Victoria Park?
AirROI currently classifies the short-term rental regulation level in East Victoria Park as High. The dataset also shows about 100.0% of listings with registration evidence. That is a market signal, not legal advice, so hosts should still confirm current licensing and compliance rules locally before listing.
What is the RevPAR for Airbnb in East Victoria Park?
RevPAR in East Victoria Park is about $97. That metric combines pricing and occupancy into one efficiency number, so it is often a better quick benchmark than ADR alone when investors want to compare how well listings convert nightly rates into realized revenue.
Is Airbnb profitable in East Victoria Park?
At 59.7% occupancy, East Victoria Park can be profitable — but margins depend heavily on operating costs, property acquisition price, and how well hosts optimize pricing across seasons. Average annual revenue is $28,828, but individual returns depend on property type, location within the city, and the host's operating efficiency.
How far in advance do guests book Airbnb in East Victoria Park?
The average booking lead time in East Victoria Park is about 42 days — a moderate lead time that gives hosts planning visibility while still benefiting from last-minute bookings. Hosts who understand their market's booking cadence can adjust minimum stays and pricing windows accordingly.
What are the best neighborhoods for Airbnb in East Victoria Park?
Based on AirROI's analysis, some of the top neighborhoods for short-term rentals in East Victoria Park include East Victoria Park, Burswood, South Perth. Each area attracts different guest profiles — from business travelers to leisure visitors — so the best location depends on the property type and target audience a host is aiming for. See the full neighborhood breakdown above.
What type of property performs best on Airbnb in East Victoria Park?
entire_home listings make up 68.5% of the active supply in East Victoria Park. The most common configuration does not always mean the most profitable — operators who identify underserved property types or bedroom counts can sometimes outperform the market average by filling a gap in local supply.
How does East Victoria Park compare to nearby Airbnb markets?
Among neighboring markets, Cottesloe posts $50,280 in average annual revenue with 63.7% occupancy, compared to East Victoria Park's $28,828 and 59.7%. Comparing nearby markets helps investors understand whether a destination's performance reflects local demand or broader regional trends.
What is the average length of stay in East Victoria Park?
The average Airbnb stay length in East Victoria Park is about 6.6 nights. That matters for turnover, cleaning operations, and pricing strategy because shorter stays increase changeovers while longer stays can smooth occupancy and reduce operational friction.
What is the average Airbnb guest rating in East Victoria Park?
Airbnb listings in East Victoria Park average 4.85 out of 5 overall. About 53.7% of listings carry the guest favorite badge, which suggests a meaningful share of inventory is competing on review quality rather than price alone.
Which amenities boost Airbnb revenue in East Victoria Park?
Dishes and silverware and Hot water are among the strongest revenue-linked amenities in East Victoria Park. In AirROI's latest dataset, listings with these amenities outperform those without on average revenue, which makes amenities analysis useful for prioritizing investment and listing upgrades.
Do Airbnb hosts charge cleaning fees in East Victoria Park?
Yes. About 90.7% of active Airbnb listings in East Victoria Park charge a cleaning fee, and the average fee is $95. The more important operating benchmark is how much of gross revenue that fee consumes, not just the absolute dollar amount.
What percentage of Airbnb hosts are Superhosts in East Victoria Park?
A 57.4% Superhost rate signals a highly competitive market where review quality and responsiveness are table stakes, not differentiators.
About AirROI Market Data
AirROI tracks over 20 million properties across 190+ countries and maintains 15+ years of historical performance data, making it one of the deepest Airbnb and STR intelligence platforms available. The analytics pipeline aggregates listing-level data monthly — revenue, occupancy, nightly rates, RevPAR, guest demographics, booking patterns, and competitive supply — so investors and operators can benchmark any market against its own history and against neighboring destinations.
Real estate investors, property managers, financial institutions, hedge funds, tourism boards, hospitality consultants, tech platforms, and academic researchers rely on AirROI data to underwrite acquisitions, optimize pricing, model macro trends, and conduct peer-reviewed research. Data is available through in-depth market reports like this one and the Airbnb API with 22 endpoints and an Airbnb MCP Server for AI agents.
AirROI proprietary analytics as of 2026-06-30. Metrics reflect trailing twelve-month aggregates from active listings. Revenue figures are market averages, not projections. Neighborhood descriptions are AI-generated and reviewed for accuracy. For full methodology, see the data methodology page.