Zanzibar, Central District Airbnb Market Data 2025: STR Report & Statistics
How much can you earn on Airbnb in Zanzibar, Central District? Based on AirROI's 2025 dataset (May 2024 – April 2025), the short answer is $3,027 per year — at a $400 nightly rate, 21.2% occupancy, and a N/A RevPAR.
With just 16 active listings, Zanzibar is a micro-market where selective demand that rewards strong listing quality and pricing strategy.
Regulation is low with minimal registration requirements, pointing to an operator-friendly environment. In a market this size, differentiated listings with strong reviews can capture outsized returns relative to the competition.
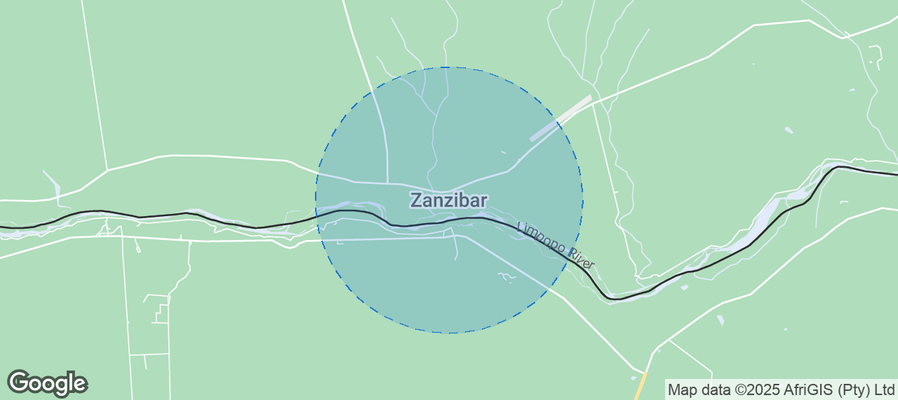
Table of Contents [hide] [show]
What Are the Key Airbnb Metrics in Zanzibar?
In Zanzibar, the headline Airbnb metrics are $3,027 in average annual revenue,21.2% occupancy, $400 ADR, and $0 in RevPAR, and guests book about 4 days in advance.
How Much Do Airbnb Hosts Earn Monthly in Zanzibar?
Understanding the monthly revenue variations for Airbnb listings in Zanzibar is key to maximizing your short term rental income potential. Seasonality significantly impacts earnings. Our analysis, based on data from the past 12 months, shows that the peak revenue month for STRs in Zanzibar is typically April, while March often presents the lowest earnings, highlighting opportunities for strategic pricing adjustments during shoulder and low seasons. Explore the typical Airbnb income in Zanzibar across different performance tiers:
- Best-in-class properties (Top 10%) achieve $1,872+ monthly, often utilizing dynamic pricing and superior guest experiences.
- Strong performing properties (Top 25%) earn $1,649 or more, indicating effective management and desirable locations/amenities.
- Typical properties (Median) generate around $1,527 per month, representing the average market performance.
- Entry-level properties (Bottom 25%) see earnings around $1,299, often with potential for optimization.
Average Monthly Airbnb Earnings Trend in Zanzibar
What Is the Monthly Airbnb Occupancy Rate in Zanzibar?
Maximize your bookings by understanding the Zanzibar STR occupancy trends. Seasonal demand shifts significantly influence how often properties are booked. Typically, Aprilsees the highest demand (peak season occupancy), while March experiences the lowest (low season). Effective strategies, like adjusting minimum stays or offering promotions, can boost occupancy during slower periods. Here's how different property tiers perform in Zanzibar:
- Best-in-class properties (Top 10%) achieve 16%+ occupancy, indicating high desirability and potentially optimized availability.
- Strong performing properties (Top 25%) maintain 14% or higher occupancy, suggesting good market fit and guest satisfaction.
- Typical properties (Median) have an occupancy rate around 10%.
- Entry-level properties (Bottom 25%) average 9% occupancy, potentially facing higher vacancy.
Average Monthly Occupancy Rate Trend in Zanzibar
What Is the Average Airbnb Nightly Rate in Zanzibar?
Effective short term rental pricing strategy in Zanzibar involves understanding monthly ADR fluctuations. The Average Daily Rate (ADR) for Airbnb in Zanzibar typically peaks in April and dips lowest during August. Leveraging Airbnb dynamic pricing tools or strategies based on this seasonality can significantly boost revenue. Here's a look at the typical nightly rates achieved:
- Best-in-class properties (Top 10%) command rates of $569+ per night, often due to premium features or locations.
- Strong performing properties (Top 25%) achieve nightly rates of $414 or more.
- Typical properties (Median) charge around $286 per night.
- Entry-level properties (Bottom 25%) earn around $183 per night.
Average Daily Rate (ADR) Trend by Month in Zanzibar
What Is the RevPAR for Airbnb in Zanzibar?
RevPAR in Zanzibar is currently N/A. Because RevPAR combines nightly rates with realized occupancy, it is one of the cleanest ways to compare how efficiently listings turn demand into revenue across the market.
- Entry-level properties (Bottom 25%) see N/A RevPAR.
- Typical properties (Median) generate N/A RevPAR.
- Strong performers (Top 25%) earn N/A RevPAR.
- Best-in-class (Top 10%) achieve N/A RevPAR.
Average Monthly RevPAR Trend in Zanzibar
RevPAR Insights for Zanzibar
- RevPAR peaks in Jan and bottoms out in Jan, mirroring the broader seasonal demand pattern and suggesting opportunities for dynamic pricing.
Recommendations for Hosts
- Track your own RevPAR monthly against these Zanzibar benchmarks. If your RevPAR falls below the median of N/A, examine whether low occupancy or low ADR is the primary drag.
- Use RevPAR rather than revenue alone when comparing properties of different sizes — it normalizes for available nights and gives a more accurate picture of performance.
Get Live Zanzibar Market Intelligence 👇
Explore Real-time Analytics
When Is the Peak Season for Airbnb in Zanzibar?
Zanzibar's peak Airbnb season falls in April, September, March, while the softest stretch is October, November, December. Overall, the market shows highly seasonal trends requiring careful strategy, which should guide pricing, minimum stays, and cash-flow planning.
Peak Season (April, September, March)
- Revenue averages $1,500 per month
- Occupancy rates average 11.9%
- Daily rates average $397
Shoulder Season
- Revenue averages $0 per month
- Occupancy maintains around 0.0%
- Daily rates hold near $305
Low Season (October, November, December)
- Revenue drops to average $0 per month
- Occupancy decreases to average 0.0%
- Daily rates adjust to average $338
Seasonality Insights for Zanzibar
- Airbnb seasonality in Zanzibar is pronounced. Revenue swings sharply between peak and low months, which means pricing strategy, minimum-stay settings, and cash reserves all need to account for extended slower periods.
- During the high season, the absolute peak month showcases Zanzibar's highest earning potential, with monthly revenues climbing to $2,928, occupancy reaching 22.5%, and ADRs peaking at $474.
- Conversely, the slowest single month marks the market's lowest point — revenue may dip to $0, occupancy could drop to 0.0%, and ADRs may adjust to $189.
- Lower occupancy paired with meaningful seasonality means hosts in Zanzibar need to maximize every peak-season booking and seriously consider whether off-season pricing adjustments or minimum-stay changes can capture incremental revenue.
Seasonal Strategies for Maximizing Profit
- Peak Season: Maximize revenue through premium pricing and potentially longer minimum stays. Ensure high availability and consider tightening cancellation policies to reduce last-minute gaps.
- Low Season: Offer competitive pricing, extended-stay discounts, and flexible cancellation policies. Target off-season travelers like remote workers, budget-conscious guests, and travelers with flexible schedules.
- Shoulder Seasons: Implement dynamic pricing that bridges peak and low rates. Target weekend travelers, local events, and business visitors. Slightly more flexible terms than peak season can help maintain occupancy without deep discounting.
- In a highly seasonal market like Zanzibar, building a cash reserve during the top months is essential for covering fixed costs during the slow period. Automated pricing tools can help capture demand shifts in real time.
Do You Need a License for Airbnb in Zanzibar?
Low regulation and minimal registration activity in Zanzibar, Central District, Botswana point to an operator-friendly environment. That said, even low-regulation markets may have tax collection requirements, safety standards, or HOA rules that affect short-term rental operations. Always verify the latest short-term rental regulations and Airbnb license requirements directly with local government authorities for Zanzibar to ensure full compliance before hosting.
(Source: AirROI data, 2026, finding no licensed listings among those analyzed)
What Are the Best Neighborhoods for Airbnb in Zanzibar?
With a compact short-term rental market, Zanzibar gives early-mover hosts an advantage in the right neighborhoods. The areas listed below are where guest demand and local attractions converge — a useful lens for investors evaluating whether to enter this market and where to position their listing.
| Neighborhood / Area | Why Host Here? (Target Guests & Appeal) | Key Attractions & Landmarks |
|---|---|---|
| Stone Town | A UNESCO World Heritage site known for its rich history and culture. Ideal for tourists wanting to explore the narrow streets, markets, and historical buildings. | Forodhani Gardens, House of Wonders, Old Fort, Darajani Market, Slave Museum, Spice Tour |
| Nungwi | Renowned for its beautiful beaches and vibrant nightlife. A favorite spot for tourists looking for relaxation and water sports. | Nungwi Beach, Mnemba Atoll, Nungwi Aquarium, Kendwa Beach, local night market |
| Kendwa | Offers stunning beaches and calm waters, perfect for swimming and sunbathing. Popular for beach parties and luxury resorts. | Kendwa Beach, Kendwa Rocks, Tamarind Beach, water sports activities, beachfront bars |
| Jambiani | A serene village with beautiful coastlines and a laid-back vibe. Attracts tourists looking for an authentic Zanzibari experience. | Jambiani Beach, local spice farms, cultural tours, water sports, snorkeling |
| Paje | Known for its kite surfing and vibrant beach scene. A hotspot for adventurous travelers and young tourists. | Paje Beach, kite surfing schools, local eateries, snorkeling trips, beach parties |
| Kizimkazi | Famous for dolphin watching and rich marine life. Attracts eco-tourists and nature lovers. | Kizimkazi Beach, dolphin tours, historic mosque, snorkeling spots, local seafood restaurants |
| Matemwe | Quiet area known for its stunning views and proximity to Mnemba Atoll. Perfect for visitors seeking tranquility and beautiful scenery. | Matemwe Beach, Mnemba Atoll, snorkeling, local crafts market, spice tours |
| Chwaka | A charming fishing village with an authentic feel. Offers a glimpse of local life and beautiful natural surroundings. | Chwaka Bay, local markets, fishing tours, beachfront relaxation, cultural experiences |
With 8 distinct neighborhoods showing meaningful short-term rental activity, Zanzibar offers diversification within a single market. Investors can tailor their strategy — from high-turnover tourist zones to quieter residential areas that attract longer stays and remote workers.
What Types of Properties Are on Airbnb in Zanzibar?
Room Type Distribution
Property Type Distribution
Market Composition Insights for Zanzibar
- The Zanzibar Airbnb market composition is heavily skewed towards Private Room listings, which make up 100% of the 16 active rentals. This indicates strong guest preference for privacy and space.
- Looking at the property type distribution in Zanzibar, Hotel/Boutique properties are the most common (100%), reflecting the local real estate landscape.
- The presence of 100% Hotel/Boutique listings indicates integration with traditional hospitality.
Zanzibar Airbnb Room Capacity Analysis (2026): Bedroom Distribution
Distribution of Listings by Number of Bedrooms
Room Capacity Insights for Zanzibar
- The dominant room capacity in Zanzibar is 1 bedroom listings, making up 93.8% of the market. This suggests a strong demand for properties suitable for couples or solo travelers.
- Together, 1 bedroom and 2 bedrooms properties represent 100.1% of the active Airbnb listings in Zanzibar, indicating a high concentration in these sizes.
- With over half the market (93.8%) consisting of studios or 1-bedroom units, Zanzibar is particularly well-suited for individuals or couples.
Zanzibar Vacation Rental Guest Capacity Trends (2026)
Distribution of Listings by Guest Capacity
Guest Capacity Insights for Zanzibar
- The most common guest capacity trend in Zanzibar vacation rentals is listings accommodating 2 guests (100%). This suggests the primary traveler segment is likely couples or solo travelers.
- A significant 100.0% of listings cater specifically to 1-2 guests, highlighting strong demand from couples and solo travelers in Zanzibar.
- On average, properties in Zanzibar are equipped to host 2.0 guests.
What Amenities Do Airbnb Guests Expect in Zanzibar?
Amenity Prevalence
No amenities with partial availability (less than 100%) were found to display in the chart. All essential amenities might be present in all listings. Check insights below.
Amenity Insights for Zanzibar
- Essential amenities in Zanzibar that guests expect include: Carbon monoxide alarm, Hot water, Wifi, Free street parking, Smoke alarm, Air conditioning, Essentials, Heating, TV, Washer. Lacking these (any) could significantly impact bookings.
Recommendations for Hosts
- Ensure your listing includes all essential amenities for Zanzibar: Carbon monoxide alarm, Hot water, Wifi, Free street parking, Smoke alarm, Air conditioning, Essentials, Heating, TV, Washer.
- Highlight unique or less common amenities you offer (e.g., hot tub, dedicated workspace, EV charger) in your listing description and photos.
- Regularly check competitor amenities in Zanzibar to stay competitive.
Dive Deeper: Advanced Zanzibar STR Market Data (2026)
Ready to unlock more insights? AirROI provides access to advanced metrics and comprehensive Airbnb data for Zanzibar. Explore detailed analytics beyond this report to refine your investment strategy, optimize pricing, and maximize your vacation rental profits.
Explore Advanced MetricsZanzibar Airbnb Guest Demographics & Profile (2026)
Traveler profile data is currently unavailable for Zanzibar.
Zanzibar Airbnb Booking Patterns (2026): Available vs. Booked Days
Available Days Distribution
Booked Days Distribution
Booking Pattern Insights for Zanzibar
- The most common availability pattern in Zanzibar falls within the 271-366 days range, representing 100% of listings. This suggests many properties have significant open periods on their calendars.
- Approximately 100.0% of listings show high availability (181+ days open annually), indicating potential for increased bookings or specific owner usage patterns.
- For booked days, the 1-30 days range is most frequent in Zanzibar (100%), reflecting common guest stay durations or potential owner blocking patterns.
How Far in Advance Do Guests Book Airbnb in Zanzibar?
Average Booking Lead Time by Month
Booking Lead Time Insights for Zanzibar
- The overall average booking lead time for vacation rentals in Zanzibar is 4 days.
- Guests book furthest in advance for stays during March (average 7 days), likely coinciding with peak travel demand or local events.
- The shortest booking windows occur for stays in December (average 0 days), indicating more last-minute travel plans during this time.
- Seasonally, Spring (4 days avg.) sees the longest lead times, while Winter (0 days avg.) has the shortest, reflecting typical travel planning cycles.
Recommendations for Hosts
- Use the overall average lead time (4 days) as a baseline for your pricing and availability strategy in Zanzibar.
- Target marketing efforts for the Spring season well in advance (at least 4 days) to capture early planners.
- Monitor your own booking lead times against these Zanzibar averages to identify opportunities for dynamic pricing adjustments.
Zanzibar Airbnb Minimum Stay Requirements Analysis
Distribution of Listings by Minimum Night Requirement
1 Night
16 listings
100% of total
Key Insights
- The most prevalent minimum stay requirement in Zanzibar is 1 Night, adopted by 100% of listings. This highlights the market's preference for shorter, flexible bookings.
- A strong majority (100.0%) of the Zanzibar Airbnb data shows acceptance of very short stays (1-2 nights), indicating a dynamic, high-turnover market.
Recommendations
- Align with the market by considering a 1 Night minimum stay, as 100% of Zanzibar hosts use this setting.
- Adjust minimum nights based on seasonality – potentially shorter during low season and longer during peak demand periods in Zanzibar.
Zanzibar Airbnb Cancellation Policy Trends (2026)
Cancellation policy data is currently unavailable for Zanzibar.
What Do the Top Airbnb Listings in Zanzibar Look Like?
Benchmark your potential! Explore examples of top-performing Airbnb properties in Zanzibarbased on Trailing Twelve Month (TTM) revenue. Analyze their characteristics, revenue, occupancy rate, and ADR to understand what drives success in this market.
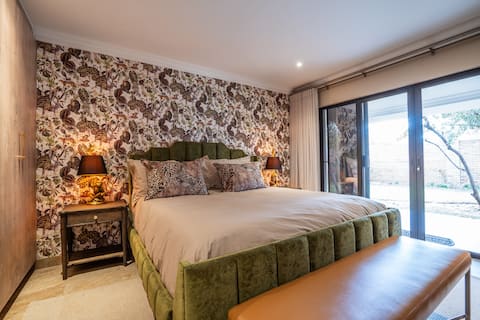
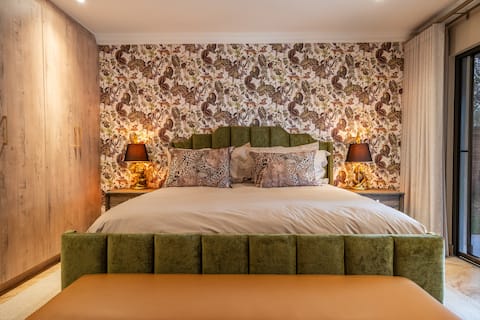
Lotsane Limpopo Luxury River Lodge Room 1
Private Room • N/A

Lotsane Limpopo Luxury River Tent GrandHippo Suite
Private Room • 1 bedroom
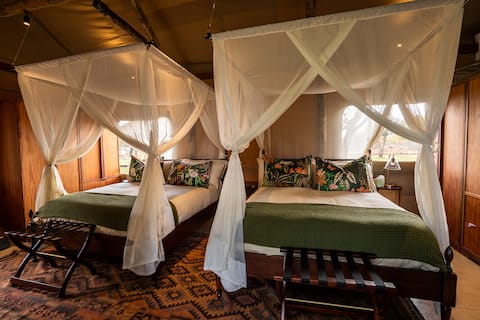
Lotsane Limpopo Luxury River Tent Monkey Suite
Private Room • 1 bedroom

Lotsane Limpopo Luxury River Lodge Suite 11
Private Room • 2 bedrooms
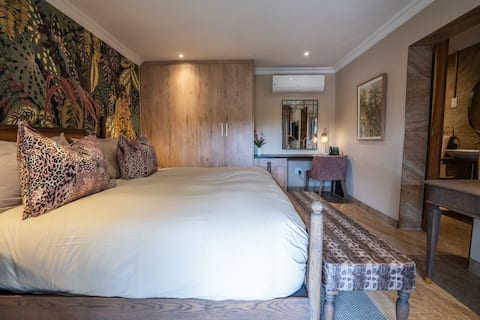
Lotsane Limpopo Luxury River Lodge Room 2
Private Room • 1 bedroom
Lotsane Limpopo Luxury River Lodge Room 12
Private Room • N/A
Note: Performance varies based on location, size, amenities, seasonality, and management quality. Data reflects the past 12 months.
Who Are the Top Airbnb Hosts in Zanzibar?
Learn from the best! This table showcases top-performing Airbnb hosts in Zanzibar based on the number of properties managed and estimated total revenue over the past year. Analyze their scale and performance metrics.
| Host Name | Properties | Grossing Revenue | Stay Reviews | Avg Rating |
|---|---|---|---|---|
| Host #260386271 | 16 | $48,424 | 0 | 0.00/5.0 |
Analyzing the strategies of top hosts, such as their property selection, pricing, and guest communication, can offer valuable lessons for optimizing your own Airbnb operations in Zanzibar.
How Does Zanzibar's Airbnb Market Compare to Nearby Cities?
How does the Zanzibar Airbnb market stack up against its neighbors? Compare key performance metrics like average monthly revenue, ADR, and occupancy rates in surrounding areas to understand the broader regional STR landscape.
Compared with Makhado Local Municipality, Zanzibar has 1 percentage points lower occupancy and about $344 higher ADR. That helps frame whether this market is winning more on demand, pricing, or both.
| Market | Active Properties | Monthly Revenue | Daily Rate | Avg. Occupancy |
|---|---|---|---|---|
| Lephalale Local Municipality | 35 | $678 | $188.71 | 18% |
| Makhado Local Municipality | 30 | $231 | $55.67 | 22% |
| Polokwane Local Municipality | 115 | $230 | $56.01 | 22% |
| Musina Local Municipality | 18 | $228 | $60.56 | 19% |
| Francistown | 11 | $167 | $53.35 | 22% |
Frequently Asked Questions About Airbnb in Zanzibar
These quick answers summarize the most common investor and operator questions using AirROI's latest market data for Zanzibar.
How much do Airbnb hosts make in Zanzibar?
Zanzibar hosts earn about $3,027 per year on average, with an average nightly rate of $400 and RevPAR of N/A. Those figures describe the typical revenue environment for active listings in Zanzibar, Central District, not the ceiling for the best operators. Source: AirROI 2025 data, Zanzibar market, May 2024 to April 2025.
What is the average Airbnb occupancy rate in Zanzibar?
The average Airbnb occupancy rate in Zanzibar is 21.2%. April is the strongest month and March is the softest, so hosts should expect demand to move meaningfully throughout the year rather than stay flat.
What is the average Airbnb daily rate in Zanzibar?
Listings in Zanzibar average $400 per night. The broader pricing spread also matters: lower-performing listings cluster closer to the lower quartiles, while premium homes can price materially above the city average when demand spikes or listing quality stands out.
How many Airbnb listings are active in Zanzibar?
Zanzibar currently has about 16 active Airbnb listings in AirROI's market dataset. That supply count helps explain how competitive the market is, how much depth there is for benchmarking, and whether the market behaves like a niche destination or a scaled urban market.
How strict are short-term rental regulations in Zanzibar?
AirROI currently classifies the short-term rental regulation level in Zanzibar as Low. The dataset also shows about 0.0% of listings with registration evidence. That is a market signal, not legal advice, so hosts should still confirm current licensing and compliance rules locally before listing.
What is the RevPAR for Airbnb in Zanzibar?
RevPAR in Zanzibar is about N/A. That metric combines pricing and occupancy into one efficiency number, so it is often a better quick benchmark than ADR alone when investors want to compare how well listings convert nightly rates into realized revenue.
Is Airbnb profitable in Zanzibar?
Occupancy of 21.2% means Zanzibar is a more selective market. Profitability is achievable but requires careful cost management, premium positioning, or targeting longer stays to reduce turnover. Average annual revenue is $3,027, but individual returns depend on property type, location within the city, and the host's operating efficiency.
How far in advance do guests book Airbnb in Zanzibar?
The average booking lead time in Zanzibar is about 4 days — an extremely short window that favors hosts with flexible availability and last-minute pricing strategies. Hosts who understand their market's booking cadence can adjust minimum stays and pricing windows accordingly.
What are the best neighborhoods for Airbnb in Zanzibar?
Based on AirROI's analysis, some of the top neighborhoods for short-term rentals in Zanzibar include Stone Town, Nungwi, Kendwa. Each area attracts different guest profiles — from business travelers to leisure visitors — so the best location depends on the property type and target audience a host is aiming for. See the full neighborhood breakdown above.
What type of property performs best on Airbnb in Zanzibar?
private_room listings make up 100.0% of the active supply in Zanzibar. The most common configuration does not always mean the most profitable — operators who identify underserved property types or bedroom counts can sometimes outperform the market average by filling a gap in local supply.
How does Zanzibar compare to nearby Airbnb markets?
Among neighboring markets, Lephalale Local Municipality posts $8,136 in average annual revenue with 17.6% occupancy, compared to Zanzibar's $3,027 and 21.2%. Comparing nearby markets helps investors understand whether a destination's performance reflects local demand or broader regional trends.
About AirROI Market Data
AirROI tracks over 20 million properties across 190+ countries and maintains 15+ years of historical performance data, making it one of the deepest Airbnb and STR intelligence platforms available. The analytics pipeline aggregates listing-level data monthly — revenue, occupancy, nightly rates, RevPAR, guest demographics, booking patterns, and competitive supply — so investors and operators can benchmark any market against its own history and against neighboring destinations.
Real estate investors, property managers, financial institutions, hedge funds, tourism boards, hospitality consultants, tech platforms, and academic researchers rely on AirROI data to underwrite acquisitions, optimize pricing, model macro trends, and conduct peer-reviewed research. Data is available through in-depth market reports like this one and the Airbnb API with 22 endpoints and an Airbnb MCP Server for AI agents.
AirROI proprietary analytics as of 2025-04-30. Metrics reflect trailing twelve-month aggregates from active listings. Revenue figures are market averages, not projections. Neighborhood descriptions are AI-generated and reviewed for accuracy. For full methodology, see the data methodology page.