Chandler, Quebec Airbnb Market Data 2025: STR Report & Statistics
How much can you earn on Airbnb in Chandler, Quebec? Based on AirROI's 2025 dataset (December 2024 – November 2025), the short answer is $16,416 per year — at a $123 nightly rate, 48.3% occupancy, and a N/A RevPAR.
With just 18 active listings, Chandler is a micro-market where moderate demand with room for well-positioned listings to outperform. Supply declined 25.0% and revenue has grown even as nightly rates softened, pointing to strengthened occupancy among remaining listings. Fewer competitors and resilient demand create favorable conditions for well-run properties.
Regulation is high and 83% of listings show active registration — compliance is the cost of entry. In a market this size, differentiated listings with strong reviews can capture outsized returns relative to the competition.

Table of Contents [hide] [show]
What Are the Key Airbnb Metrics in Chandler?
In Chandler, the headline Airbnb metrics are $16,416 in average annual revenue,48.3% occupancy, $123 ADR, and $0 in RevPAR, and guests book about 78 days in advance.
How Much Do Airbnb Hosts Earn Monthly in Chandler?
Understanding the monthly revenue variations for Airbnb listings in Chandler is key to maximizing your short term rental income potential. Seasonality significantly impacts earnings. Our analysis, based on data from the past 12 months, shows that the peak revenue month for STRs in Chandler is typically August, while December often presents the lowest earnings, highlighting opportunities for strategic pricing adjustments during shoulder and low seasons. Explore the typical Airbnb income in Chandler across different performance tiers:
- Best-in-class properties (Top 10%) achieve $3,603+ monthly, often utilizing dynamic pricing and superior guest experiences.
- Strong performing properties (Top 25%) earn $2,802 or more, indicating effective management and desirable locations/amenities.
- Typical properties (Median) generate around $2,027 per month, representing the average market performance.
- Entry-level properties (Bottom 25%) see earnings around $1,311, often with potential for optimization.
Average Monthly Airbnb Earnings Trend in Chandler
What Is the Monthly Airbnb Occupancy Rate in Chandler?
Maximize your bookings by understanding the Chandler STR occupancy trends. Seasonal demand shifts significantly influence how often properties are booked. Typically, Augustsees the highest demand (peak season occupancy), while December experiences the lowest (low season). Effective strategies, like adjusting minimum stays or offering promotions, can boost occupancy during slower periods. Here's how different property tiers perform in Chandler:
- Best-in-class properties (Top 10%) achieve 80%+ occupancy, indicating high desirability and potentially optimized availability.
- Strong performing properties (Top 25%) maintain 73% or higher occupancy, suggesting good market fit and guest satisfaction.
- Typical properties (Median) have an occupancy rate around 55%.
- Entry-level properties (Bottom 25%) average 36% occupancy, potentially facing higher vacancy.
Average Monthly Occupancy Rate Trend in Chandler
What Is the Average Airbnb Nightly Rate in Chandler?
Effective short term rental pricing strategy in Chandler involves understanding monthly ADR fluctuations. The Average Daily Rate (ADR) for Airbnb in Chandler typically peaks in July and dips lowest during December. Leveraging Airbnb dynamic pricing tools or strategies based on this seasonality can significantly boost revenue. Here's a look at the typical nightly rates achieved:
- Best-in-class properties (Top 10%) command rates of $202+ per night, often due to premium features or locations.
- Strong performing properties (Top 25%) achieve nightly rates of $162 or more.
- Typical properties (Median) charge around $125 per night.
- Entry-level properties (Bottom 25%) earn around $88 per night.
Average Daily Rate (ADR) Trend by Month in Chandler
What Is the RevPAR for Airbnb in Chandler?
RevPAR in Chandler is currently N/A. Because RevPAR combines nightly rates with realized occupancy, it is one of the cleanest ways to compare how efficiently listings turn demand into revenue across the market.
- Entry-level properties (Bottom 25%) see N/A RevPAR.
- Typical properties (Median) generate N/A RevPAR.
- Strong performers (Top 25%) earn N/A RevPAR.
- Best-in-class (Top 10%) achieve N/A RevPAR.
Average Monthly RevPAR Trend in Chandler
RevPAR Insights for Chandler
- RevPAR peaks in Jan and bottoms out in Jan, mirroring the broader seasonal demand pattern and suggesting opportunities for dynamic pricing.
Recommendations for Hosts
- Track your own RevPAR monthly against these Chandler benchmarks. If your RevPAR falls below the median of N/A, examine whether low occupancy or low ADR is the primary drag.
- Use RevPAR rather than revenue alone when comparing properties of different sizes — it normalizes for available nights and gives a more accurate picture of performance.
Get Live Chandler Market Intelligence 👇
Explore Real-time Analytics
When Is the Peak Season for Airbnb in Chandler?
Chandler's peak Airbnb season falls in August, July, June, while the softest stretch is April, November, December. Overall, the market shows highly seasonal trends requiring careful strategy, which should guide pricing, minimum stays, and cash-flow planning.
Peak Season (August, July, June)
- Revenue averages $3,433 per month
- Occupancy rates average 68.1%
- Daily rates average $142
Shoulder Season
- Revenue averages $1,694 per month
- Occupancy maintains around 48.8%
- Daily rates hold near $125
Low Season (April, November, December)
- Revenue drops to average $1,438 per month
- Occupancy decreases to average 46.2%
- Daily rates adjust to average $123
Seasonality Insights for Chandler
- Airbnb seasonality in Chandler is pronounced. Revenue swings sharply between peak and low months, which means pricing strategy, minimum-stay settings, and cash reserves all need to account for extended slower periods.
- During the high season, the absolute peak month showcases Chandler's highest earning potential, with monthly revenues climbing to $4,109, occupancy reaching 78.9%, and ADRs peaking at $146.
- Conversely, the slowest single month marks the market's lowest point — revenue may dip to $1,428, occupancy could drop to 41.3%, and ADRs may adjust to $121.
- Understanding both the seasonal averages and these monthly peaks and troughs in revenue, occupancy, and ADR is crucial for maximizing your Airbnb profit potential in Chandler.
Seasonal Strategies for Maximizing Profit
- Peak Season: Maximize revenue through premium pricing. In a high-regulation market like Chandler, ensure your permit covers the number of nights you plan to book — some jurisdictions cap annual rental days.
- Low Season: Offer competitive pricing, extended-stay discounts, and flexible cancellation policies. Target off-season travelers like remote workers, budget-conscious guests, and travelers with flexible schedules.
- Shoulder Seasons: Implement dynamic pricing that bridges peak and low rates. Target weekend travelers, local events, and business visitors. Slightly more flexible terms than peak season can help maintain occupancy without deep discounting.
- In a highly seasonal market like Chandler, building a cash reserve during the top months is essential for covering fixed costs during the slow period. Automated pricing tools can help capture demand shifts in real time.
Do You Need a License for Airbnb in Chandler?
Yes, Chandler, Quebec, Canada enforces high STR regulations and 83% of active listings show registration evidence — indicating that enforcement is active and compliance is a prerequisite for operating legally. Hosts entering this market should budget for permit fees, inspections, and potential occupancy tax obligations as part of their startup costs. Always verify the latest short-term rental regulations and Airbnb license requirements directly with local government authorities for Chandler to ensure full compliance before hosting.
(Source: AirROI data, 2026, based on 83% licensed listings)
What Are the Best Neighborhoods for Airbnb in Chandler?
With a compact short-term rental market, Chandler gives early-mover hosts an advantage in the right neighborhoods. The areas listed below are where guest demand and local attractions converge — a useful lens for investors evaluating whether to enter this market and where to position their listing.
| Neighborhood / Area | Why Host Here? (Target Guests & Appeal) | Key Attractions & Landmarks |
|---|---|---|
| Old Town Chandler | Charming historic district with a variety of boutique shops, restaurants, and art galleries. Attracts visitors interested in culture and history, and hosts numerous local events throughout the year. | Chandler Museum, Chandler Center for the Arts, Downtown Chandler Farmers Market, The Vision Gallery, Tumbleweed Park |
| Chandler Fashion Center | The largest shopping center in the region, featuring major retail stores, dining options, and entertainment. A prime location for shopping enthusiasts and families looking to spend a day out. | Chandler Fashion Center Mall, AMC Theatres, District Stage, fancy dining options, escape rooms |
| Downtown Chandler | A vibrant area known for its nightlife, dining, and entertainment options. Hosts a variety of events and festivals, attracting tourists and locals alike throughout the year. | Downtown Chandler Art Walk, Chandler Center for the Arts, numerous restaurants and bars, local boutiques, outdoor concerts |
| Desert Breeze Park | A beautiful park featuring playgrounds, a lake, and walking trails. Ideal for families and outdoor enthusiasts looking for relaxation and recreation. | Desert Breeze Lake, playgrounds, walking trails, barbecuing areas, picnic spots |
| Ocotillo | An upscale neighborhood with luxury homes and golf courses. Appeals to travelers looking for a more tranquil and high-end experience, with proximity to beautiful landscapes. | Ocotillo Golf Resort, luxury spas, gorgeous lake paths, fine dining, local art |
| South Chandler | A growing area featuring family-friendly neighborhoods and community parks. Attracts families visiting for extended stays and those relocating to the area. | community parks, family restaurants, shopping centers, nearby golf courses, local schools |
| North Chandler | Offers a mix of suburban comfort and proximity to major highways and amenities, appealing to visitors wanting a quiet stay while still being close to city attractions. | local parks, community centers, shopping plazas, gyms and fitness centers, proximity to major freeways |
| East Valley | A broader region that encompasses Chandler and is known for its recreational opportunities and vibrant community feel, perfect for those wanting a home base to explore the entire valley. | local lakes, Phoenix Zoo, Tempe Town Lake, Mesa Arts Center, nearby hiking trails |
Because Chandler has a high regulation profile, confirming that short-term rental permits are available in your target neighborhood is a critical first step before committing to a property purchase. Regulation can vary at the neighborhood or district level even within the same city.
What Types of Properties Are on Airbnb in Chandler?
Room Type Distribution
Property Type Distribution
Market Composition Insights for Chandler
- The Chandler Airbnb market composition is heavily skewed towards Entire Home/Apt listings, which make up 88.9% of the 18 active rentals. This indicates strong guest preference for privacy and space.
- Looking at the property type distribution in Chandler, House properties are the most common (77.8%), reflecting the local real estate landscape.
- Houses represent a significant 77.8% portion, catering likely to families or larger groups.
- The presence of 5.6% Hotel/Boutique listings indicates integration with traditional hospitality.
Chandler Airbnb Room Capacity Analysis (2026): Bedroom Distribution
Distribution of Listings by Number of Bedrooms
Room Capacity Insights for Chandler
- The dominant room capacity in Chandler is 2 bedrooms listings, making up 38.9% of the market. This suggests a strong demand for properties suitable for couples or solo travelers.
- Together, 2 bedrooms and 3 bedrooms properties represent 72.2% of the active Airbnb listings in Chandler, indicating a high concentration in these sizes.
- A significant 33.3% of listings offer 3+ bedrooms, catering to larger groups and families seeking more space in Chandler.
Chandler Vacation Rental Guest Capacity Trends (2026)
Distribution of Listings by Guest Capacity
Guest Capacity Insights for Chandler
- The most common guest capacity trend in Chandler vacation rentals is listings accommodating 4 guests (16.7%). This suggests the primary traveler segment is likely small families or groups.
- Properties designed for 4 guests and 6 guests dominate the Chandler STR market, accounting for 33.4% of listings.
- 33.4% of properties accommodate 6+ guests, serving the market segment for larger families or group travel in Chandler.
- On average, properties in Chandler are equipped to host 4.2 guests.
What Amenities Do Airbnb Guests Expect in Chandler?
Amenity Prevalence
Amenity Insights for Chandler
- Essential amenities in Chandler that guests expect include: Smoke alarm, Hot water, Wifi, Kitchen, TV, Free parking on premises, Heating. Lacking these (any) could significantly impact bookings.
- Popular amenities like Refrigerator, Dishes and silverware, Coffee maker are common but not universal. Offering these can provide a competitive edge.
Recommendations for Hosts
- Ensure your listing includes all essential amenities for Chandler: Smoke alarm, Hot water, Wifi, Kitchen, TV, Free parking on premises, Heating.
- Consider adding popular differentiators like Refrigerator or Dishes and silverware to increase appeal.
- Highlight unique or less common amenities you offer (e.g., hot tub, dedicated workspace, EV charger) in your listing description and photos.
- Regularly check competitor amenities in Chandler to stay competitive.
Dive Deeper: Advanced Chandler STR Market Data (2026)
Ready to unlock more insights? AirROI provides access to advanced metrics and comprehensive Airbnb data for Chandler. Explore detailed analytics beyond this report to refine your investment strategy, optimize pricing, and maximize your vacation rental profits.
Explore Advanced MetricsChandler Airbnb Guest Demographics & Profile Analysis (2026)
Guest Profile Summary for Chandler
- The typical guest profile for Airbnb in Chandler consists of primarily domestic travelers (86%), often arriving from nearby Montreal, typically belonging to the Post-2000s (Gen Z/Alpha) group (50%), primarily speaking French or English.
- Domestic travelers account for 86.4% of guests.
- Key international markets include Canada (86.4%) and France (9.1%).
- Top languages spoken are French (51.4%) followed by English (36.2%).
- A significant demographic segment is the Post-2000s (Gen Z/Alpha) group, representing 50% of guests.
Recommendations for Hosts
- Target domestic marketing efforts towards travelers from Montreal and Quebec City.
- Tailor amenities and listing descriptions to appeal to the dominant Post-2000s (Gen Z/Alpha) demographic (e.g., highlight fast WiFi, smart home features, local guides).
- Highlight unique local experiences or amenities relevant to the primary guest profile.
- Consider seasonal promotions aligned with peak travel times for key origin markets.
Chandler Airbnb Booking Patterns (2026): Available vs. Booked Days
Available Days Distribution
Booked Days Distribution
Booking Pattern Insights for Chandler
- The most common availability pattern in Chandler falls within the 91-180 days range, representing 33.3% of listings. This suggests many properties have significant open periods on their calendars.
- Approximately 61.1% of listings show high availability (181+ days open annually), indicating potential for increased bookings or specific owner usage patterns.
- For booked days, the 181-270 days range is most frequent in Chandler (33.3%), reflecting common guest stay durations or potential owner blocking patterns.
- A notable 38.9% of properties secure long booking periods (181+ days booked per year), highlighting successful long-term rental strategies or significant owner usage.
How Far in Advance Do Guests Book Airbnb in Chandler?
Average Booking Lead Time by Month
Booking Lead Time Insights for Chandler
- The overall average booking lead time for vacation rentals in Chandler is 78 days.
- Guests book furthest in advance for stays during July (average 115 days), likely coinciding with peak travel demand or local events.
- The shortest booking windows occur for stays in March (average 24 days), indicating more last-minute travel plans during this time.
- Seasonally, Summer (96 days avg.) sees the longest lead times, while Winter (34 days avg.) has the shortest, reflecting typical travel planning cycles.
Recommendations for Hosts
- Use the overall average lead time (78 days) as a baseline for your pricing and availability strategy in Chandler.
- For July stays, consider implementing length-of-stay discounts or slightly higher rates for bookings made less than 115 days out to capitalize on advance planning.
- Target marketing efforts for the Summer season well in advance (at least 96 days) to capture early planners.
- Monitor your own booking lead times against these Chandler averages to identify opportunities for dynamic pricing adjustments.
Chandler Airbnb Minimum Stay Requirements Analysis
Distribution of Listings by Minimum Night Requirement
1 Night
2 listings
11.1% of total
2 Nights
2 listings
11.1% of total
4-6 Nights
1 listings
5.6% of total
7-29 Nights
2 listings
11.1% of total
30+ Nights
11 listings
61.1% of total
Key Insights
- The most prevalent minimum stay requirement in Chandler is 30+ Nights, adopted by 61.1% of listings. This highlights the market's preference for longer commitments.
- A significant segment (61.1%) caters to monthly stays (30+ nights) in Chandler, pointing to opportunities in the extended-stay market.
Recommendations
- Align with the market by considering a 30+ Nights minimum stay, as 61.1% of Chandler hosts use this setting.
- If feasible, allowing 1-night stays, especially midweek or during low season, could capture last-minute bookings, as only 11.1% currently do.
- Explore offering discounts for stays of 30+ nights to attract the 61.1% of the market seeking extended stays.
- Adjust minimum nights based on seasonality – potentially shorter during low season and longer during peak demand periods in Chandler.
Chandler Airbnb Cancellation Policy Trends Analysis (2026)
Limited
1 listings
5.9% of total
Flexible
3 listings
17.6% of total
Moderate
3 listings
17.6% of total
Firm
9 listings
52.9% of total
Strict
1 listings
5.9% of total
Cancellation Policy Insights for Chandler
- The prevailing Airbnb cancellation policy trend in Chandler is Firm, used by 52.9% of listings.
- A majority (58.8%) of hosts in Chandler utilize Firm or Strict policies, indicating a market where hosts prioritize booking security.
- Strict cancellation policies are quite rare (5.9%), potentially making listings with this policy less competitive unless justified by high demand or property type.
Recommendations for Hosts
- Consider adopting a Firm policy to align with the 52.9% market standard in Chandler.
- Using a Strict policy might deter some guests, as only 5.9% of listings use it. Evaluate if potential revenue protection outweighs possible lower booking rates.
- Regularly review your cancellation policy against competitors and market demand shifts in Chandler.
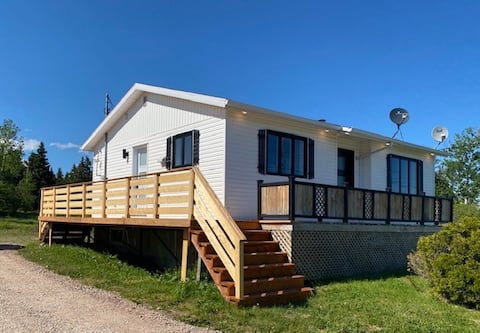
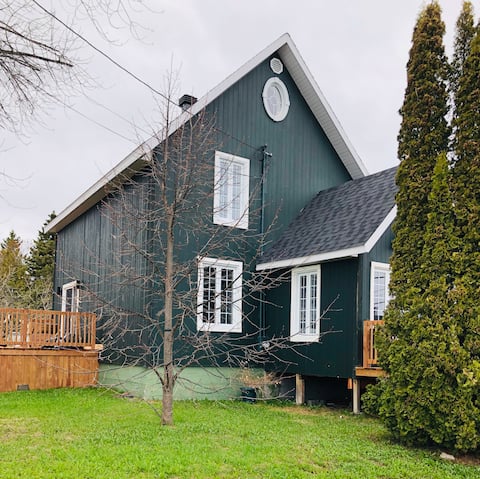
What Do the Top Airbnb Listings in Chandler Look Like?
Benchmark your potential! Explore examples of top-performing Airbnb properties in Chandlerbased on Trailing Twelve Month (TTM) revenue. Analyze their characteristics, revenue, occupancy rate, and ADR to understand what drives success in this market.

Pabos's Little House
Entire Place • 3 bedrooms

The suites of 31
Entire Place • 3 bedrooms

La Gaspésienne, comfortable and very well located!
Entire Place • 2 bedrooms
The Beach House
Entire Place • 2 bedrooms
Modern house located in the heart of the city
Entire Place • 3 bedrooms

Chalet Bord de L'eau, establishment no.: 304741
Entire Place • 3 bedrooms
Note: Performance varies based on location, size, amenities, seasonality, and management quality. Data reflects the past 12 months.
Who Are the Top Airbnb Hosts in Chandler?
Learn from the best! This table showcases top-performing Airbnb hosts in Chandler based on the number of properties managed and estimated total revenue over the past year. Analyze their scale and performance metrics.
| Host Name | Properties | Grossing Revenue | Stay Reviews | Avg Rating |
|---|---|---|---|---|
| Jessy | 3 | $83,536 | 455 | 4.67/5.0 |
| Méliza | 1 | $37,459 | 61 | 4.92/5.0 |
| Christine | 1 | $33,727 | 53 | 4.96/5.0 |
| Maude Hautcoeur Inc | 1 | $22,756 | 106 | 4.66/5.0 |
| Donna | 1 | $22,043 | 25 | 4.76/5.0 |
| Annick | 1 | $21,719 | 155 | 4.95/5.0 |
| Julie | 1 | $17,563 | 24 | 4.75/5.0 |
| Jean-Guy | 1 | $17,268 | 96 | 4.86/5.0 |
| Peggy Et J-F | 1 | $15,286 | 88 | 4.77/5.0 |
| Eveline | 1 | $10,207 | 46 | 4.96/5.0 |
Analyzing the strategies of top hosts, such as their property selection, pricing, and guest communication, can offer valuable lessons for optimizing your own Airbnb operations in Chandler.
How Does Chandler's Airbnb Market Compare to Nearby Cities?
How does the Chandler Airbnb market stack up against its neighbors? Compare key performance metrics like average monthly revenue, ADR, and occupancy rates in surrounding areas to understand the broader regional STR landscape.
Compared with Rivière-Bonaventure, Chandler has 8 percentage points lower occupancy and about $23 lower ADR. That helps frame whether this market is winning more on demand, pricing, or both.
| Market | Active Properties | Monthly Revenue | Daily Rate | Avg. Occupancy |
|---|---|---|---|---|
| Rivière-Bonaventure | 10 | $2,241 | $146.77 | 56% |
| Bonaventure | 20 | $2,009 | $160.41 | 45% |
| Bathurst | 33 | $1,505 | $159.85 | 49% |
| Tracadie-Sheila | 14 | $1,443 | $149.68 | 36% |
| Gaspé | 106 | $1,385 | $141.84 | 44% |
| Beresford | 20 | $1,302 | $152.01 | 38% |
| Percé | 50 | $1,261 | $146.58 | 45% |
| Shippagan | 12 | $1,219 | $123.64 | 46% |
| Caraquet | 40 | $1,195 | $137.87 | 43% |
| Miramichi | 21 | $1,125 | $122.68 | 41% |
Frequently Asked Questions About Airbnb in Chandler
These quick answers summarize the most common investor and operator questions using AirROI's latest market data for Chandler.
How much do Airbnb hosts make in Chandler?
Chandler hosts earn about $16,416 per year on average, with an average nightly rate of $123 and RevPAR of N/A. Those figures describe the typical revenue environment for active listings in Chandler, Quebec, not the ceiling for the best operators. Source: AirROI 2025 data, Chandler market, December 2024 to November 2025.
What is the average Airbnb occupancy rate in Chandler?
The average Airbnb occupancy rate in Chandler is 48.3%. August is the strongest month and December is the softest, so hosts should expect demand to move meaningfully throughout the year rather than stay flat.
What is the average Airbnb daily rate in Chandler?
Listings in Chandler average $123 per night. The broader pricing spread also matters: lower-performing listings cluster closer to the lower quartiles, while premium homes can price materially above the city average when demand spikes or listing quality stands out.
How many Airbnb listings are active in Chandler?
Chandler currently has about 18 active Airbnb listings in AirROI's market dataset. That supply count helps explain how competitive the market is, how much depth there is for benchmarking, and whether the market behaves like a niche destination or a scaled urban market.
How strict are short-term rental regulations in Chandler?
AirROI currently classifies the short-term rental regulation level in Chandler as High. The dataset also shows about 83.3% of listings with registration evidence. That is a market signal, not legal advice, so hosts should still confirm current licensing and compliance rules locally before listing.
What is the RevPAR for Airbnb in Chandler?
RevPAR in Chandler is about N/A. That metric combines pricing and occupancy into one efficiency number, so it is often a better quick benchmark than ADR alone when investors want to compare how well listings convert nightly rates into realized revenue.
Is Airbnb profitable in Chandler?
At 48.3% occupancy, Chandler can be profitable — but margins depend heavily on operating costs, property acquisition price, and how well hosts optimize pricing across seasons. Average annual revenue is $16,416, but individual returns depend on property type, location within the city, and the host's operating efficiency.
How far in advance do guests book Airbnb in Chandler?
The average booking lead time in Chandler is about 78 days — a longer planning horizon typical of destination or vacation markets where travelers book well in advance. Hosts who understand their market's booking cadence can adjust minimum stays and pricing windows accordingly.
What are the best neighborhoods for Airbnb in Chandler?
Based on AirROI's analysis, some of the top neighborhoods for short-term rentals in Chandler include Old Town Chandler, Chandler Fashion Center, Downtown Chandler. Each area attracts different guest profiles — from business travelers to leisure visitors — so the best location depends on the property type and target audience a host is aiming for. See the full neighborhood breakdown above.
What type of property performs best on Airbnb in Chandler?
entire_home listings make up 88.9% of the active supply in Chandler. The most common configuration does not always mean the most profitable — operators who identify underserved property types or bedroom counts can sometimes outperform the market average by filling a gap in local supply.
How does Chandler compare to nearby Airbnb markets?
Among neighboring markets, Rivière-Bonaventure posts $26,894 in average annual revenue with 56.5% occupancy, compared to Chandler's $16,416 and 48.3%. Comparing nearby markets helps investors understand whether a destination's performance reflects local demand or broader regional trends.
When is the peak season for Airbnb in Chandler?
August is the highest-revenue month in Chandler, while December is the softest. The revenue spread between them indicates a highly seasonal market — revenue in the peak month is more than double the low month, so cash-flow planning and pricing automation are critical.
About AirROI Market Data
AirROI tracks over 20 million properties across 190+ countries and maintains 15+ years of historical performance data, making it one of the deepest Airbnb and STR intelligence platforms available. The analytics pipeline aggregates listing-level data monthly — revenue, occupancy, nightly rates, RevPAR, guest demographics, booking patterns, and competitive supply — so investors and operators can benchmark any market against its own history and against neighboring destinations.
Real estate investors, property managers, financial institutions, hedge funds, tourism boards, hospitality consultants, tech platforms, and academic researchers rely on AirROI data to underwrite acquisitions, optimize pricing, model macro trends, and conduct peer-reviewed research. Data is available through in-depth market reports like this one and the Airbnb API with 22 endpoints and an Airbnb MCP Server for AI agents.
AirROI proprietary analytics as of 2025-11-30. Metrics reflect trailing twelve-month aggregates from active listings. Revenue figures are market averages, not projections. Neighborhood descriptions are AI-generated and reviewed for accuracy. For full methodology, see the data methodology page.