Pandowoharjo, Special Region of Yogyakarta Airbnb Market Data 2025: STR Report & Statistics
How much can you earn on Airbnb in Pandowoharjo, Special Region of Yogyakarta? Based on AirROI's 2025 dataset (October 2024 – September 2025), the short answer is $4,743 per year — at a $108 nightly rate, 18.1% occupancy, and a N/A RevPAR.
With just 20 active listings, Pandowoharjo is a micro-market where selective demand that rewards strong listing quality and pricing strategy. Supply grew 300.0% year over year, and the market is recalibrating around a new competitive baseline. This is the stage where hosts who invest in amenities, guest experience, and dynamic pricing build durable advantages that compound as the market matures.
Regulation is low, reducing the compliance barrier — though local ordinances should still be verified. In a market this size, differentiated listings with strong reviews can capture outsized returns relative to the competition.

Table of Contents [hide] [show]
What Are the Key Airbnb Metrics in Pandowoharjo?
In Pandowoharjo, the headline Airbnb metrics are $4,743 in average annual revenue,18.1% occupancy, $108 ADR, and $0 in RevPAR, and guests book about 14 days in advance.
How Much Do Airbnb Hosts Earn Monthly in Pandowoharjo?
Understanding the monthly revenue variations for Airbnb listings in Pandowoharjo is key to maximizing your short term rental income potential. Seasonality significantly impacts earnings. Our analysis, based on data from the past 12 months, shows that the peak revenue month for STRs in Pandowoharjo is typically April, while November often presents the lowest earnings, highlighting opportunities for strategic pricing adjustments during shoulder and low seasons. Explore the typical Airbnb income in Pandowoharjo across different performance tiers:
- Best-in-class properties (Top 10%) achieve $1,289+ monthly, often utilizing dynamic pricing and superior guest experiences.
- Strong performing properties (Top 25%) earn $859 or more, indicating effective management and desirable locations/amenities.
- Typical properties (Median) generate around $462 per month, representing the average market performance.
- Entry-level properties (Bottom 25%) see earnings around $232, often with potential for optimization.
Average Monthly Airbnb Earnings Trend in Pandowoharjo
What Is the Monthly Airbnb Occupancy Rate in Pandowoharjo?
Maximize your bookings by understanding the Pandowoharjo STR occupancy trends. Seasonal demand shifts significantly influence how often properties are booked. Typically, Aprilsees the highest demand (peak season occupancy), while November experiences the lowest (low season). Effective strategies, like adjusting minimum stays or offering promotions, can boost occupancy during slower periods. Here's how different property tiers perform in Pandowoharjo:
- Best-in-class properties (Top 10%) achieve 33%+ occupancy, indicating high desirability and potentially optimized availability.
- Strong performing properties (Top 25%) maintain 26% or higher occupancy, suggesting good market fit and guest satisfaction.
- Typical properties (Median) have an occupancy rate around 15%.
- Entry-level properties (Bottom 25%) average 10% occupancy, potentially facing higher vacancy.
Average Monthly Occupancy Rate Trend in Pandowoharjo
What Is the Average Airbnb Nightly Rate in Pandowoharjo?
Effective short term rental pricing strategy in Pandowoharjo involves understanding monthly ADR fluctuations. The Average Daily Rate (ADR) for Airbnb in Pandowoharjo typically peaks in December and dips lowest during August. Leveraging Airbnb dynamic pricing tools or strategies based on this seasonality can significantly boost revenue. Here's a look at the typical nightly rates achieved:
- Best-in-class properties (Top 10%) command rates of $166+ per night, often due to premium features or locations.
- Strong performing properties (Top 25%) achieve nightly rates of $131 or more.
- Typical properties (Median) charge around $109 per night.
- Entry-level properties (Bottom 25%) earn around $61 per night.
Average Daily Rate (ADR) Trend by Month in Pandowoharjo
What Is the RevPAR for Airbnb in Pandowoharjo?
RevPAR in Pandowoharjo is currently N/A. Because RevPAR combines nightly rates with realized occupancy, it is one of the cleanest ways to compare how efficiently listings turn demand into revenue across the market.
- Entry-level properties (Bottom 25%) see N/A RevPAR.
- Typical properties (Median) generate N/A RevPAR.
- Strong performers (Top 25%) earn N/A RevPAR.
- Best-in-class (Top 10%) achieve N/A RevPAR.
Average Monthly RevPAR Trend in Pandowoharjo
RevPAR Insights for Pandowoharjo
- RevPAR peaks in Jan and bottoms out in Jan, mirroring the broader seasonal demand pattern and suggesting opportunities for dynamic pricing.
Recommendations for Hosts
- Track your own RevPAR monthly against these Pandowoharjo benchmarks. If your RevPAR falls below the median of N/A, examine whether low occupancy or low ADR is the primary drag.
- Use RevPAR rather than revenue alone when comparing properties of different sizes — it normalizes for available nights and gives a more accurate picture of performance.
Get Live Pandowoharjo Market Intelligence 👇
Explore Real-time Analytics
When Is the Peak Season for Airbnb in Pandowoharjo?
Pandowoharjo's peak Airbnb season falls in April, January, October, while the softest stretch is August, September, November. Overall, the market shows highly seasonal trends requiring careful strategy, which should guide pricing, minimum stays, and cash-flow planning.
Peak Season (April, January, October)
- Revenue averages $957 per month
- Occupancy rates average 26.6%
- Daily rates average $114
Shoulder Season
- Revenue averages $587 per month
- Occupancy maintains around 17.7%
- Daily rates hold near $104
Low Season (August, September, November)
- Revenue drops to average $365 per month
- Occupancy decreases to average 12.4%
- Daily rates adjust to average $98
Seasonality Insights for Pandowoharjo
- Airbnb seasonality in Pandowoharjo is pronounced. Revenue swings sharply between peak and low months, which means pricing strategy, minimum-stay settings, and cash reserves all need to account for extended slower periods.
- During the high season, the absolute peak month showcases Pandowoharjo's highest earning potential, with monthly revenues climbing to $1,096, occupancy reaching 28.4%, and ADRs peaking at $123.
- Conversely, the slowest single month marks the market's lowest point — revenue may dip to $254, occupancy could drop to 7.4%, and ADRs may adjust to $90.
- Lower occupancy paired with meaningful seasonality means hosts in Pandowoharjo need to maximize every peak-season booking and seriously consider whether off-season pricing adjustments or minimum-stay changes can capture incremental revenue.
Seasonal Strategies for Maximizing Profit
- Peak Season: Maximize revenue through premium pricing and potentially longer minimum stays. Ensure high availability and consider tightening cancellation policies to reduce last-minute gaps.
- Low Season: Offer competitive pricing, extended-stay discounts, and flexible cancellation policies. Target off-season travelers like remote workers, budget-conscious guests, and travelers with flexible schedules.
- Shoulder Seasons: Implement dynamic pricing that bridges peak and low rates. Target weekend travelers, local events, and business visitors. Slightly more flexible terms than peak season can help maintain occupancy without deep discounting.
- In a highly seasonal market like Pandowoharjo, building a cash reserve during the top months is essential for covering fixed costs during the slow period. Automated pricing tools can help capture demand shifts in real time.
Do You Need a License for Airbnb in Pandowoharjo?
While Pandowoharjo, Special Region of Yogyakarta, Indonesia currently shows low STR regulations, 5% of listings carry registration evidence — suggesting some hosts proactively register or that certain neighborhoods have their own rules. Checking local zoning and tax obligations before listing is still wise. Always verify the latest short-term rental regulations and Airbnb license requirements directly with local government authorities for Pandowoharjo to ensure full compliance before hosting.
(Source: AirROI data, 2026, based on 5% licensed listings)
What Are the Best Neighborhoods for Airbnb in Pandowoharjo?
With a compact short-term rental market, Pandowoharjo gives early-mover hosts an advantage in the right neighborhoods. The areas listed below are where guest demand and local attractions converge — a useful lens for investors evaluating whether to enter this market and where to position their listing.
| Neighborhood / Area | Why Host Here? (Target Guests & Appeal) | Key Attractions & Landmarks |
|---|---|---|
| Jalan Kaliurang | A popular road in Yogyakarta that leads to Mount Merapi. It's favored by tourists seeking adventure and natural beauty, with easy access to hiking trails and scenic views. | Mount Merapi, Taman Nasional Gunung Merapi, Candi Prambanan, Bunker Kaliadem, Ullen Sentalu Museum |
| Malioboro | The main shopping street of Yogyakarta, known for its vibrant culture and history. It attracts tourists looking to experience local art, street food, and shopping. | Malioboro Street, Batik Keris, Pasar Beringharjo, Fort Vredeburg, Yogyakarta Palace |
| Kotagede | Famous for its silver crafts and traditional Javanese architecture, Kotagede attracts tourists interested in local heritage and crafts. | Kotagede Silver, Sunan Pandanaran Mosque, Candi Barong, Masjid Agung Kotagede, Gereja Hati Kudus Yesus |
| Sleman | A regency just north of Yogyakarta with beautiful landscapes and the famous Prambanan Temple, attracting visitors seeking serenity and cultural experiences. | Prambanan Temple, Sleman City Hall, Candi Ratu Boko, Puncak Sewa, Bojong Luwur Waterfall |
| Bantul | Known for its beautiful beaches and rural tourism, Bantul is great for tourists who want to explore nature and enjoy local culinary delights. | Parangtritis Beach, Pantai Depok, Gembira Loka Zoo, Gua Cerme, Bamboo Village |
| Gunung Kidul | Famous for its stunning beaches and karst landscape, Gunung Kidul is popular for beach enthusiasts and nature lovers seeking adventure. | Nglambor Beach, Siung Beach, Gereja Jesus Kristus, Pindul Cave, Wet N Wild Waterpark |
| Prawirotaman | A trendy neighborhood known for its guesthouses and vibrant nightlife, drawing in travelers looking for a lively atmosphere and cultural experiences. | Prawirotaman Street, Yogyakarta Expat Community, Café Marah, Sultan’s Palace, Sate Klathak |
| Kasihan | A growing area close to the city center that offers a mix of urban life and local culture. It is ideal for guests who want affordability with accessibility. | Museum Affandi, Batik Museum, Kasihan Market, Bubrah Hill, Puncak Sewa View |
With 8 distinct neighborhoods showing meaningful short-term rental activity, Pandowoharjo offers diversification within a single market. Investors can tailor their strategy — from high-turnover tourist zones to quieter residential areas that attract longer stays and remote workers.
What Types of Properties Are on Airbnb in Pandowoharjo?
Room Type Distribution
Property Type Distribution
Market Composition Insights for Pandowoharjo
- The Pandowoharjo Airbnb market composition is heavily skewed towards Entire Home/Apt listings, which make up 85% of the 20 active rentals. This indicates strong guest preference for privacy and space.
- Looking at the property type distribution in Pandowoharjo, House properties are the most common (90%), reflecting the local real estate landscape.
- Houses represent a significant 90% portion, catering likely to families or larger groups.
Pandowoharjo Airbnb Room Capacity Analysis (2026): Bedroom Distribution
Distribution of Listings by Number of Bedrooms
Room Capacity Insights for Pandowoharjo
- The dominant room capacity in Pandowoharjo is 1 bedroom listings, making up 40% of the market. This suggests a strong demand for properties suitable for couples or solo travelers.
- Together, 1 bedroom and 3 bedrooms properties represent 60.0% of the active Airbnb listings in Pandowoharjo, indicating a high concentration in these sizes.
- A significant 40.0% of listings offer 3+ bedrooms, catering to larger groups and families seeking more space in Pandowoharjo.
Pandowoharjo Vacation Rental Guest Capacity Trends (2026)
Distribution of Listings by Guest Capacity
Guest Capacity Insights for Pandowoharjo
- The most common guest capacity trend in Pandowoharjo vacation rentals is listings accommodating 2 guests (40%). This suggests the primary traveler segment is likely couples or solo travelers.
- Properties designed for 2 guests and 8+ guests dominate the Pandowoharjo STR market, accounting for 70.0% of listings.
- 40.0% of properties accommodate 6+ guests, serving the market segment for larger families or group travel in Pandowoharjo.
- On average, properties in Pandowoharjo are equipped to host 4.4 guests.
What Amenities Do Airbnb Guests Expect in Pandowoharjo?
Amenity Prevalence
Amenity Insights for Pandowoharjo
- Essential amenities in Pandowoharjo that guests expect include: TV, Air conditioning, Free parking on premises, Wifi. Lacking these (any) could significantly impact bookings.
- Popular amenities like Hot water, Kitchen, Refrigerator are common but not universal. Offering these can provide a competitive edge.
- A pool is a highly desired but not standard amenity, making it a key feature for attracting guests seeking leisure in Pandowoharjo.
Recommendations for Hosts
- Ensure your listing includes all essential amenities for Pandowoharjo: TV, Air conditioning, Free parking on premises, Wifi.
- Consider adding popular differentiators like Hot water or Kitchen to increase appeal.
- Highlight unique or less common amenities you offer (e.g., hot tub, dedicated workspace, EV charger) in your listing description and photos.
- Regularly check competitor amenities in Pandowoharjo to stay competitive.
Dive Deeper: Advanced Pandowoharjo STR Market Data (2026)
Ready to unlock more insights? AirROI provides access to advanced metrics and comprehensive Airbnb data for Pandowoharjo. Explore detailed analytics beyond this report to refine your investment strategy, optimize pricing, and maximize your vacation rental profits.
Explore Advanced MetricsPandowoharjo Airbnb Guest Demographics & Profile Analysis (2026)
Guest Profile Summary for Pandowoharjo
- The typical guest profile for Airbnb in Pandowoharjo consists of predominantly international visitors (67%), with top international origins including France, typically belonging to the Post-2000s (Gen Z/Alpha) group (50%), primarily speaking English or Indonesian.
- Domestic travelers account for 33.3% of guests.
- Key international markets include Indonesia (33.3%) and France (33.3%).
- Top languages spoken are English (40%) followed by Indonesian (26.7%).
- A significant demographic segment is the Post-2000s (Gen Z/Alpha) group, representing 50% of guests.
Recommendations for Hosts
- Focus marketing internationally, particularly towards travelers from France.
- Tailor amenities and listing descriptions to appeal to the dominant Post-2000s (Gen Z/Alpha) demographic (e.g., highlight fast WiFi, smart home features, local guides).
- Highlight unique local experiences or amenities relevant to the primary guest profile.
- Consider seasonal promotions aligned with peak travel times for key origin markets.
Pandowoharjo Airbnb Booking Patterns (2026): Available vs. Booked Days
Available Days Distribution
Booked Days Distribution
Booking Pattern Insights for Pandowoharjo
- The most common availability pattern in Pandowoharjo falls within the 271-366 days range, representing 100% of listings. This suggests many properties have significant open periods on their calendars.
- Approximately 100.0% of listings show high availability (181+ days open annually), indicating potential for increased bookings or specific owner usage patterns.
- For booked days, the 31-90 days range is most frequent in Pandowoharjo (70%), reflecting common guest stay durations or potential owner blocking patterns.
How Far in Advance Do Guests Book Airbnb in Pandowoharjo?
Average Booking Lead Time by Month
Booking Lead Time Insights for Pandowoharjo
- The overall average booking lead time for vacation rentals in Pandowoharjo is 14 days.
- Guests book furthest in advance for stays during May (average 21 days), likely coinciding with peak travel demand or local events.
- The shortest booking windows occur for stays in September (average 8 days), indicating more last-minute travel plans during this time.
- Seasonally, Summer (17 days avg.) sees the longest lead times, while Winter (11 days avg.) has the shortest, reflecting typical travel planning cycles.
Recommendations for Hosts
- Use the overall average lead time (14 days) as a baseline for your pricing and availability strategy in Pandowoharjo.
- Target marketing efforts for the Summer season well in advance (at least 17 days) to capture early planners.
- Monitor your own booking lead times against these Pandowoharjo averages to identify opportunities for dynamic pricing adjustments.
Pandowoharjo Airbnb Minimum Stay Requirements Analysis
Distribution of Listings by Minimum Night Requirement
1 Night
19 listings
95% of total
30+ Nights
1 listings
5% of total
Key Insights
- The most prevalent minimum stay requirement in Pandowoharjo is 1 Night, adopted by 95% of listings. This highlights the market's preference for shorter, flexible bookings.
- A strong majority (95.0%) of the Pandowoharjo Airbnb data shows acceptance of very short stays (1-2 nights), indicating a dynamic, high-turnover market.
Recommendations
- Align with the market by considering a 1 Night minimum stay, as 95% of Pandowoharjo hosts use this setting.
- Adjust minimum nights based on seasonality – potentially shorter during low season and longer during peak demand periods in Pandowoharjo.
Pandowoharjo Airbnb Cancellation Policy Trends Analysis (2026)
Flexible
3 listings
15% of total
Moderate
2 listings
10% of total
Firm
1 listings
5% of total
Strict
14 listings
70% of total
Cancellation Policy Insights for Pandowoharjo
- The prevailing Airbnb cancellation policy trend in Pandowoharjo is Strict, used by 70% of listings.
- A majority (75.0%) of hosts in Pandowoharjo utilize Firm or Strict policies, indicating a market where hosts prioritize booking security.
Recommendations for Hosts
- Consider adopting a Strict policy to align with the 70% market standard in Pandowoharjo.
- With 70% using Strict terms, this is a viable option in Pandowoharjo, particularly for high-value properties or during peak demand periods.
- Regularly review your cancellation policy against competitors and market demand shifts in Pandowoharjo.
What Do the Top Airbnb Listings in Pandowoharjo Look Like?
Benchmark your potential! Explore examples of top-performing Airbnb properties in Pandowoharjobased on Trailing Twelve Month (TTM) revenue. Analyze their characteristics, revenue, occupancy rate, and ADR to understand what drives success in this market.
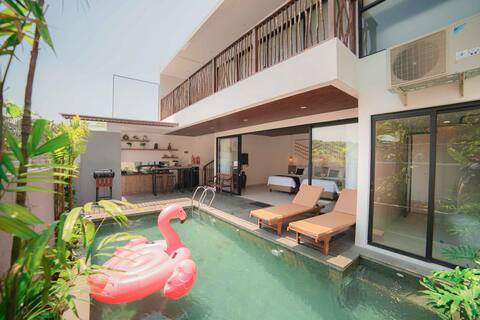
Amarta Poolside Escape - 2 BR Villa
Entire Place • 2 bedrooms
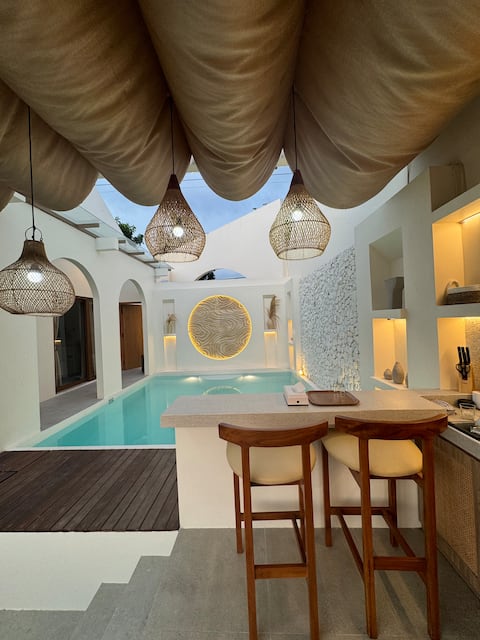
Private Villa Mediterania unique
Entire Place • 2 bedrooms

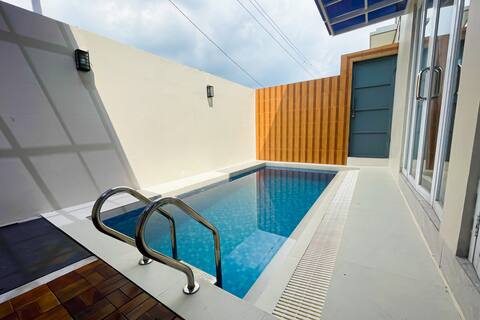
Spacious 2BR• Amarta Private Pool Villa Yogyakarta
Entire Place • 2 bedrooms
WHouse Persada Pool 1 | 3BR | Kaliurang
Entire Place • 3 bedrooms

Ubu Villa Amarta 01
Entire Place • 1 bedroom

Honeymoon Villa Romantic Vibe
Entire Place • 1 bedroom
Note: Performance varies based on location, size, amenities, seasonality, and management quality. Data reflects the past 12 months.
Who Are the Top Airbnb Hosts in Pandowoharjo?
Learn from the best! This table showcases top-performing Airbnb hosts in Pandowoharjo based on the number of properties managed and estimated total revenue over the past year. Analyze their scale and performance metrics.
| Host Name | Properties | Grossing Revenue | Stay Reviews | Avg Rating |
|---|---|---|---|---|
| Ubu Villa | 9 | $55,398 | 28 | 4.79/5.0 |
| Fulton Villa | 2 | $16,046 | 7 | 5.00/5.0 |
| Andrean | 3 | $13,100 | 11 | 4.83/5.0 |
| Hendriyani | 1 | $4,704 | 5 | 5.00/5.0 |
| Arie | 3 | $4,271 | 15 | 5.00/5.0 |
| Clara | 1 | $1,044 | 5 | 4.20/5.0 |
| Host #522249245 | 1 | $288 | 1 | Not Rated |
Analyzing the strategies of top hosts, such as their property selection, pricing, and guest communication, can offer valuable lessons for optimizing your own Airbnb operations in Pandowoharjo.
How Does Pandowoharjo's Airbnb Market Compare to Nearby Cities?
How does the Pandowoharjo Airbnb market stack up against its neighbors? Compare key performance metrics like average monthly revenue, ADR, and occupancy rates in surrounding areas to understand the broader regional STR landscape.
Compared with Sariharjo, Pandowoharjo has 11 percentage points lower occupancy and about $52 higher ADR. That helps frame whether this market is winning more on demand, pricing, or both.
| Market | Active Properties | Monthly Revenue | Daily Rate | Avg. Occupancy |
|---|---|---|---|---|
| Candibinangun | 13 | $647 | $98.51 | 19% |
| Sukoharjo | 15 | $627 | $94.68 | 27% |
| Bangunjiwo | 27 | $612 | $81.40 | 25% |
| Sardonoharjo | 10 | $594 | $116.37 | 19% |
| Maguwoharjo | 39 | $491 | $73.21 | 25% |
| Nogotirto | 12 | $381 | $79.38 | 22% |
| Sariharjo | 164 | $377 | $56.20 | 29% |
| Sinduadi | 92 | $367 | $66.19 | 28% |
| Sendangadi | 18 | $367 | $89.81 | 24% |
| Sinduharjo | 28 | $357 | $57.77 | 24% |
Frequently Asked Questions About Airbnb in Pandowoharjo
These quick answers summarize the most common investor and operator questions using AirROI's latest market data for Pandowoharjo.
How much do Airbnb hosts make in Pandowoharjo?
Pandowoharjo hosts earn about $4,743 per year on average, with an average nightly rate of $108 and RevPAR of N/A. Those figures describe the typical revenue environment for active listings in Pandowoharjo, Special Region of Yogyakarta, not the ceiling for the best operators. Source: AirROI 2025 data, Pandowoharjo market, October 2024 to September 2025.
What is the average Airbnb occupancy rate in Pandowoharjo?
The average Airbnb occupancy rate in Pandowoharjo is 18.1%. April is the strongest month and November is the softest, so hosts should expect demand to move meaningfully throughout the year rather than stay flat.
What is the average Airbnb daily rate in Pandowoharjo?
Listings in Pandowoharjo average $108 per night. The broader pricing spread also matters: lower-performing listings cluster closer to the lower quartiles, while premium homes can price materially above the city average when demand spikes or listing quality stands out.
How many Airbnb listings are active in Pandowoharjo?
Pandowoharjo currently has about 20 active Airbnb listings in AirROI's market dataset. That supply count helps explain how competitive the market is, how much depth there is for benchmarking, and whether the market behaves like a niche destination or a scaled urban market.
How strict are short-term rental regulations in Pandowoharjo?
AirROI currently classifies the short-term rental regulation level in Pandowoharjo as Low. The dataset also shows about 5.0% of listings with registration evidence. That is a market signal, not legal advice, so hosts should still confirm current licensing and compliance rules locally before listing.
What is the RevPAR for Airbnb in Pandowoharjo?
RevPAR in Pandowoharjo is about N/A. That metric combines pricing and occupancy into one efficiency number, so it is often a better quick benchmark than ADR alone when investors want to compare how well listings convert nightly rates into realized revenue.
Is Airbnb profitable in Pandowoharjo?
Occupancy of 18.1% means Pandowoharjo is a more selective market. Profitability is achievable but requires careful cost management, premium positioning, or targeting longer stays to reduce turnover. Average annual revenue is $4,743, but individual returns depend on property type, location within the city, and the host's operating efficiency.
How far in advance do guests book Airbnb in Pandowoharjo?
The average booking lead time in Pandowoharjo is about 14 days — a relatively short booking window, meaning most guests decide within a few weeks of their trip — dynamic pricing can capture late demand. Hosts who understand their market's booking cadence can adjust minimum stays and pricing windows accordingly.
What are the best neighborhoods for Airbnb in Pandowoharjo?
Based on AirROI's analysis, some of the top neighborhoods for short-term rentals in Pandowoharjo include Jalan Kaliurang, Malioboro, Kotagede. Each area attracts different guest profiles — from business travelers to leisure visitors — so the best location depends on the property type and target audience a host is aiming for. See the full neighborhood breakdown above.
What type of property performs best on Airbnb in Pandowoharjo?
entire_home listings make up 85.0% of the active supply in Pandowoharjo. The most common configuration does not always mean the most profitable — operators who identify underserved property types or bedroom counts can sometimes outperform the market average by filling a gap in local supply.
How does Pandowoharjo compare to nearby Airbnb markets?
Among neighboring markets, Candibinangun posts $7,763 in average annual revenue with 18.6% occupancy, compared to Pandowoharjo's $4,743 and 18.1%. Comparing nearby markets helps investors understand whether a destination's performance reflects local demand or broader regional trends.
When is the peak season for Airbnb in Pandowoharjo?
April is the highest-revenue month in Pandowoharjo, while November is the softest. The revenue spread between them indicates a highly seasonal market — revenue in the peak month is more than double the low month, so cash-flow planning and pricing automation are critical.
About AirROI Market Data
AirROI tracks over 20 million properties across 190+ countries and maintains 15+ years of historical performance data, making it one of the deepest Airbnb and STR intelligence platforms available. The analytics pipeline aggregates listing-level data monthly — revenue, occupancy, nightly rates, RevPAR, guest demographics, booking patterns, and competitive supply — so investors and operators can benchmark any market against its own history and against neighboring destinations.
Real estate investors, property managers, financial institutions, hedge funds, tourism boards, hospitality consultants, tech platforms, and academic researchers rely on AirROI data to underwrite acquisitions, optimize pricing, model macro trends, and conduct peer-reviewed research. Data is available through in-depth market reports like this one and the Airbnb API with 22 endpoints and an Airbnb MCP Server for AI agents.
AirROI proprietary analytics as of 2025-09-30. Metrics reflect trailing twelve-month aggregates from active listings. Revenue figures are market averages, not projections. Neighborhood descriptions are AI-generated and reviewed for accuracy. For full methodology, see the data methodology page.