Beverino, Liguria Airbnb Market Data 2026: STR Report & Statistics
How much can you earn on Airbnb in Beverino, Liguria? Based on AirROI's 2026 dataset (May 2025 – April 2026), the short answer is $6,986 per year — at a $125 nightly rate, 30.6% occupancy, and a $41 RevPAR that reflects a wider gap between nightly rates and realized revenue that rewards occupancy-focused strategies.
With just 19 active listings, Beverino is a micro-market where selective demand that rewards strong listing quality and pricing strategy. Supply grew 26.7% and nightly rates have risen, creating an environment where the most bookable listings stand to capture outsized share. Hosts who pair competitive pricing with strong guest experience are well-positioned to convert the growing traveler base into consistent bookings.
Regulation is high and 74% of listings show active registration — compliance is the cost of entry. In a market this size, differentiated listings with strong reviews can capture outsized returns relative to the competition.
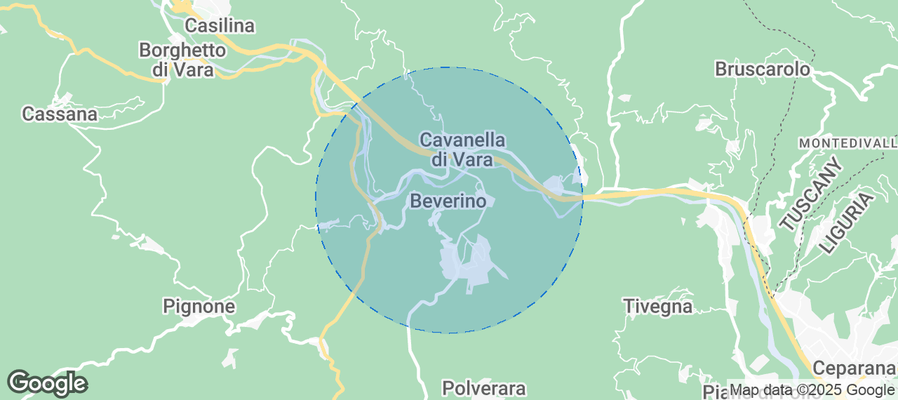
Table of Contents [hide] [show]
What Are the Key Airbnb Metrics in Beverino?
In Beverino, the headline Airbnb metrics are $6,986 in average annual revenue,30.6% occupancy, $125 ADR, and $41 in RevPAR, and guests book about 64 days in advance.
How Much Do Airbnb Hosts Earn Monthly in Beverino?
Understanding the monthly revenue variations for Airbnb listings in Beverino is key to maximizing your short term rental income potential. Seasonality significantly impacts earnings. Our analysis, based on data from the past 12 months, shows that the peak revenue month for STRs in Beverino is typically August, while February often presents the lowest earnings, highlighting opportunities for strategic pricing adjustments during shoulder and low seasons. Explore the typical Airbnb income in Beverino across different performance tiers:
- Best-in-class properties (Top 10%) achieve $2,185+ monthly, often utilizing dynamic pricing and superior guest experiences.
- Strong performing properties (Top 25%) earn $1,336 or more, indicating effective management and desirable locations/amenities.
- Typical properties (Median) generate around $537 per month, representing the average market performance.
- Entry-level properties (Bottom 25%) see earnings around $315, often with potential for optimization.
Average Monthly Airbnb Earnings Trend in Beverino
What Is the Monthly Airbnb Occupancy Rate in Beverino?
Maximize your bookings by understanding the Beverino STR occupancy trends. Seasonal demand shifts significantly influence how often properties are booked. Typically, Augustsees the highest demand (peak season occupancy), while February experiences the lowest (low season). Effective strategies, like adjusting minimum stays or offering promotions, can boost occupancy during slower periods. Here's how different property tiers perform in Beverino:
- Best-in-class properties (Top 10%) achieve 47%+ occupancy, indicating high desirability and potentially optimized availability.
- Strong performing properties (Top 25%) maintain 34% or higher occupancy, suggesting good market fit and guest satisfaction.
- Typical properties (Median) have an occupancy rate around 17%.
- Entry-level properties (Bottom 25%) average 10% occupancy, potentially facing higher vacancy.
Average Monthly Occupancy Rate Trend in Beverino
What Is the Average Airbnb Nightly Rate in Beverino?
Effective short term rental pricing strategy in Beverino involves understanding monthly ADR fluctuations. The Average Daily Rate (ADR) for Airbnb in Beverino typically peaks in December and dips lowest during May. Leveraging Airbnb dynamic pricing tools or strategies based on this seasonality can significantly boost revenue. Here's a look at the typical nightly rates achieved:
- Best-in-class properties (Top 10%) command rates of $212+ per night, often due to premium features or locations.
- Strong performing properties (Top 25%) achieve nightly rates of $130 or more.
- Typical properties (Median) charge around $97 per night.
- Entry-level properties (Bottom 25%) earn around $85 per night.
Average Daily Rate (ADR) Trend by Month in Beverino
What Is the RevPAR for Airbnb in Beverino?
RevPAR in Beverino is currently $41. Because RevPAR combines nightly rates with realized occupancy, it is one of the cleanest ways to compare how efficiently listings turn demand into revenue across the market.
- Entry-level properties (Bottom 25%) see $12 RevPAR.
- Typical properties (Median) generate $29 RevPAR.
- Strong performers (Top 25%) earn $53 RevPAR.
- Best-in-class (Top 10%) achieve $117 RevPAR.
Average Monthly RevPAR Trend in Beverino
RevPAR Insights for Beverino
- The average RevPAR in Beverino is $41. This metric combines nightly rates with realized occupancy, making it one of the best single-number indicators of market efficiency.
- The gap between the top 10% ($117) and bottom 25% ($12) is $105, indicating significant performance disparity driven by property quality, pricing strategy, and location.
- RevPAR peaks in Aug and bottoms out in Feb, mirroring the broader seasonal demand pattern and suggesting opportunities for dynamic pricing.
Recommendations for Hosts
- Track your own RevPAR monthly against these Beverino benchmarks. If your RevPAR falls below the median of $29, examine whether low occupancy or low ADR is the primary drag.
- Top-quartile listings achieve $53+ RevPAR through a combination of competitive pricing, strong reviews, and strategic amenities. Target this tier through incremental improvements.
- Use RevPAR rather than revenue alone when comparing properties of different sizes — it normalizes for available nights and gives a more accurate picture of performance.
Get Live Beverino Market Intelligence 👇
Explore Real-time Analytics
When Is the Peak Season for Airbnb in Beverino?
Beverino's peak Airbnb season falls in August, July, September, while the softest stretch is January, February, December. Overall, the market shows highly seasonal trends requiring careful strategy, which should guide pricing, minimum stays, and cash-flow planning.
Peak Season (August, July, September)
- Revenue averages $1,841 per month
- Occupancy rates average 41.8%
- Daily rates average $124
Shoulder Season
- Revenue averages $940 per month
- Occupancy maintains around 24.0%
- Daily rates hold near $120
Low Season (January, February, December)
- Revenue drops to average $156 per month
- Occupancy decreases to average 4.3%
- Daily rates adjust to average $127
Seasonality Insights for Beverino
- Airbnb seasonality in Beverino is pronounced. Revenue swings sharply between peak and low months, which means pricing strategy, minimum-stay settings, and cash reserves all need to account for extended slower periods.
- During the high season, the absolute peak month showcases Beverino's highest earning potential, with monthly revenues climbing to $2,429, occupancy reaching 54.3%, and ADRs peaking at $131.
- Conversely, the slowest single month marks the market's lowest point — revenue may dip to $124, occupancy could drop to 3.6%, and ADRs may adjust to $111.
- Lower occupancy paired with meaningful seasonality means hosts in Beverino need to maximize every peak-season booking and seriously consider whether off-season pricing adjustments or minimum-stay changes can capture incremental revenue.
Seasonal Strategies for Maximizing Profit
- Peak Season: Maximize revenue through premium pricing. In a high-regulation market like Beverino, ensure your permit covers the number of nights you plan to book — some jurisdictions cap annual rental days.
- Low Season: Offer competitive pricing, extended-stay discounts, and flexible cancellation policies. Target off-season travelers like remote workers, budget-conscious guests, and travelers with flexible schedules.
- Shoulder Seasons: Implement dynamic pricing that bridges peak and low rates. Target weekend travelers, local events, and business visitors. Slightly more flexible terms than peak season can help maintain occupancy without deep discounting.
- In a highly seasonal market like Beverino, building a cash reserve during the top months is essential for covering fixed costs during the slow period. Automated pricing tools can help capture demand shifts in real time.
Do You Need a License for Airbnb in Beverino?
Yes, Beverino, Liguria, Italy enforces high STR regulations and 74% of active listings show registration evidence — indicating that enforcement is active and compliance is a prerequisite for operating legally. Hosts entering this market should budget for permit fees, inspections, and potential occupancy tax obligations as part of their startup costs. Always verify the latest short-term rental regulations and Airbnb license requirements directly with local government authorities for Beverino to ensure full compliance before hosting.
(Source: AirROI data, 2026, based on 74% licensed listings)
What Are the Best Neighborhoods for Airbnb in Beverino?
With a compact short-term rental market, Beverino gives early-mover hosts an advantage in the right neighborhoods. The areas listed below are where guest demand and local attractions converge — a useful lens for investors evaluating whether to enter this market and where to position their listing.
| Neighborhood / Area | Why Host Here? (Target Guests & Appeal) | Key Attractions & Landmarks |
|---|---|---|
| Beverino Center | The charming town center offers a blend of local culture and easy access to surrounding attractions in Levanto and Monterosso. Perfect for guests looking to experience the authentic Ligurian lifestyle. | Beverino Castle, Local markets, Church of San Giovanni Battista, Gastronomy tours |
| Cinque Terre National Park | A UNESCO World Heritage site known for its breathtaking coastal views, colorful villages, and hiking trails. Ideal for nature lovers and tourists seeking adventure. | Vernazza, Monterosso al Mare, Riomaggiore, Hiking trails, Beach access |
| Castello di Monteriggioni | A historic castle area that attracts tourists seeking history and beautiful landscapes. Serves as a great base for exploring the nearby Chianti region. | Monteriggioni Castle, Wine tasting, Local vineyards, Historical tours |
| Levanto | A popular seaside town known for its beautiful beaches and as the gateway to the Cinque Terre. Attracts beachgoers and outdoor enthusiasts. | Levanto Beach, Surfing spots, Cycling routes, Lungomare di Levanto |
| La Spezia | Larger city nearby offering excellent transport links to the Cinque Terre, great for travelers who prefer city amenities and close proximity to nature. | Marina di La Spezia, Museo Tecnico Navale, Castello di San Giorgio, Local seafood restaurants |
| Riomaggiore | One of the picturesque villages of Cinque Terre, famous for its colorful buildings and stunning sea views. Attracts tourists looking to immerse themselves in a unique coastal experience. | Via dell'Amore, Riomaggiore Beach, Local seafood dining, Historical architecture |
| Portovenere | A beautiful coastal village known for its stunning views and rich history. Ideal for tourists seeking a more tranquil setting with access to the Gulf of Poets. | Portovenere Church, Doria Castle, Palmaria Island, Scenic boat tours |
| Santo Stefano di Magra | A quieter area compared to the tourist hotspots, offering easy access to both the seaside and the countryside. Ideal for families and longer stays. | Local parks, Hiking trails, Proximity to La Spezia, Cultural festivals |
Because Beverino has a high regulation profile, confirming that short-term rental permits are available in your target neighborhood is a critical first step before committing to a property purchase. Regulation can vary at the neighborhood or district level even within the same city.
What Types of Properties Are on Airbnb in Beverino?
Room Type Distribution
Property Type Distribution
Market Composition Insights for Beverino
- The Beverino Airbnb market composition is heavily skewed towards Entire Home/Apt listings, which make up 63.2% of the 19 active rentals. This indicates strong guest preference for privacy and space.
- However, a notable 36.8% share for Private Rooms suggests opportunities for budget-conscious travelers or hosts renting out spare rooms.
- Looking at the property type distribution in Beverino, House properties are the most common (36.8%), reflecting the local real estate landscape.
- Houses represent a significant 36.8% portion, catering likely to families or larger groups.
- The presence of 26.3% Hotel/Boutique listings indicates integration with traditional hospitality.
Beverino Airbnb Room Capacity Analysis (2026): Bedroom Distribution
Distribution of Listings by Number of Bedrooms
Room Capacity Insights for Beverino
- The dominant room capacity in Beverino is 2 bedrooms listings, making up 31.6% of the market. This suggests a strong demand for properties suitable for couples or solo travelers.
- Together, 2 bedrooms and 1 bedroom properties represent 47.4% of the active Airbnb listings in Beverino, indicating a high concentration in these sizes.
Beverino Vacation Rental Guest Capacity Trends (2026)
Distribution of Listings by Guest Capacity
Guest Capacity Insights for Beverino
- The most common guest capacity trend in Beverino vacation rentals is listings accommodating 4 guests (31.6%). This suggests the primary traveler segment is likely small families or groups.
- Properties designed for 4 guests and 2 guests dominate the Beverino STR market, accounting for 42.1% of listings.
- 15.9% of properties accommodate 6+ guests, serving the market segment for larger families or group travel in Beverino.
- On average, properties in Beverino are equipped to host 2.8 guests.
How Do Listings in Beverino Compare on Quality?
Listing quality in Beverino can be approximated through presentation depth, bedroom count, and how often hosts disclose exact locations. These signals show how professionally the local supply base is merchandised.
Listing Quality Insights for Beverino
- At 33.1 photos per listing on average, Beverino hosts invest well in visual presentation. Listings with 20+ photos consistently outperform in search ranking and conversion.
- 21.1% of listings show their exact location. Lower disclosure rates can increase booking hesitation — guests want to know exactly where they are staying.
Recommendations for Hosts
- Enable exact location if possible — it removes a common source of guest uncertainty and can improve your listing's position in map-based searches.
- Use these quality indicators as a self-audit checklist. Listings that exceed the Beverino averages across all three metrics are better positioned for premium pricing.
What Amenities Do Airbnb Guests Expect in Beverino?
Amenity Prevalence
Amenity Insights for Beverino
- Popular amenities like Hot water, Heating, Hair dryer are common but not universal. Offering these can provide a competitive edge.
- Warning: Wifi is not universally provided but is considered essential globally. Ensure reliable Wifi is offered.
Recommendations for Hosts
- Consider adding popular differentiators like Hot water or Heating to increase appeal.
- Highlight unique or less common amenities you offer (e.g., hot tub, dedicated workspace, EV charger) in your listing description and photos.
- Regularly check competitor amenities in Beverino to stay competitive.
Which Airbnb Amenities Boost Revenue in Beverino?
Not every amenity matters equally. This table focuses on the amenities most associated with higher revenue in Beverino, which makes it more useful for prioritizing upgrades than a simple popularity list alone.
| Amenity | Prevalence | Revenue With | Revenue Without | Revenue Uplift |
|---|---|---|---|---|
Refrigerator | 57.9% | $10,137 | $2,654 | 282.0% |
Bed linens | 73.7% | $8,402 | $3,021 | 178.1% |
Bidet | 73.7% | $8,402 | $3,021 | 178.1% |
Hangers | 73.7% | $8,362 | $3,134 | 166.8% |
Wine glasses | 26.3% | $12,487 | $5,021 | 148.7% |
Pool | 26.3% | $12,212 | $5,120 | 138.5% |
Microwave | 31.6% | $11,397 | $4,950 | 130.2% |
Washer | 36.8% | $10,634 | $4,858 | 118.9% |
Patio or balcony | 57.9% | $8,950 | $4,285 | 108.9% |
Coffee maker | 52.6% | $9,131 | $4,602 | 98.4% |
Revenue Impact Insights for Beverino
- Refrigerator tops the revenue impact list with a 282.0% uplift — listings with this amenity earn $10,137 vs. $2,654 without it.
Recommendations for Hosts
- Focus your upgrade budget on amenities in the top half of this table. Below-median amenities may improve guest experience but contribute less to revenue growth.
- Highlight revenue-impacting amenities prominently in your listing title, photos, and description — guests can't value what they don't notice.
Dive Deeper: Advanced Beverino STR Market Data (2026)
Ready to unlock more insights? AirROI provides access to advanced metrics and comprehensive Airbnb data for Beverino. Explore detailed analytics beyond this report to refine your investment strategy, optimize pricing, and maximize your vacation rental profits.
Explore Advanced MetricsBeverino Airbnb Guest Demographics & Profile Analysis (2026)
Guest Profile Summary for Beverino
- The typical guest profile for Airbnb in Beverino consists of predominantly international visitors (91%), with top international origins including United Kingdom, typically belonging to the Post-2000s (Gen Z/Alpha) group (50%), primarily speaking English or French.
- Domestic travelers account for 9.1% of guests.
- Key international markets include France (30.3%) and United Kingdom (18.2%).
- Top languages spoken are English (36.4%) followed by French (18.2%).
- A significant demographic segment is the Post-2000s (Gen Z/Alpha) group, representing 50% of guests.
Recommendations for Hosts
- Focus marketing internationally, particularly towards travelers from United Kingdom.
- Tailor amenities and listing descriptions to appeal to the dominant Post-2000s (Gen Z/Alpha) demographic (e.g., highlight fast WiFi, smart home features, local guides).
- Highlight unique local experiences or amenities relevant to the primary guest profile.
- Consider seasonal promotions aligned with peak travel times for key origin markets.
What Are Airbnb Guest Ratings in Beverino?
Listings in Beverino average 4.85 out of 5 overall, with about 58.7 reviews per active listing and 15.8% of listings carrying the Guest Favorite badge.
Rating Breakdown by Category
Guest Rating Insights for Beverino
- With an overall rating of 4.85, Beverino listings meet an exceptionally high bar. Guests consistently report strong satisfaction, which drives repeat bookings and referral traffic.
- The strongest subcategory is Communication (4.92), while Location (4.67) trails behind — a useful signal for hosts looking to prioritize upgrades.
- 15.8% of listings carry the Guest Favorite badge, a strong trust signal that can meaningfully lift click-through and booking rates.
Recommendations for Hosts
- Focus improvement efforts on Location — even small gains in the weakest subcategory can lift overall ratings and search ranking.
- Encourage guests to leave reviews after checkout. Listings with more reviews rank higher in search results and convert browsers into bookers more effectively.
- With only 15.8% of listings earning Guest Favorite status, hosts who consistently exceed expectations have a clear competitive advantage.
Beverino Airbnb Booking Patterns (2026): Available vs. Booked Days
Available Days Distribution
Booked Days Distribution
Booking Pattern Insights for Beverino
- The most common availability pattern in Beverino falls within the 271-366 days range, representing 89.5% of listings. This suggests many properties have significant open periods on their calendars.
- Approximately 100.0% of listings show high availability (181+ days open annually), indicating potential for increased bookings or specific owner usage patterns.
- For booked days, the 1-30 days range is most frequent in Beverino (47.4%), reflecting common guest stay durations or potential owner blocking patterns.
How Far in Advance Do Guests Book Airbnb in Beverino?
Average Booking Lead Time by Month
Booking Lead Time Insights for Beverino
- The overall average booking lead time for vacation rentals in Beverino is 64 days.
- Guests book furthest in advance for stays during August (average 92 days), likely coinciding with peak travel demand or local events.
- The shortest booking windows occur for stays in November (average 1 days), indicating more last-minute travel plans during this time.
- Seasonally, Summer (63 days avg.) sees the longest lead times, while Winter (19 days avg.) has the shortest, reflecting typical travel planning cycles.
Recommendations for Hosts
- Use the overall average lead time (64 days) as a baseline for your pricing and availability strategy in Beverino.
- For August stays, consider implementing length-of-stay discounts or slightly higher rates for bookings made less than 92 days out to capitalize on advance planning.
- During November, focus on last-minute booking availability and promotions, as guests book with very short notice (1 days avg.).
- Target marketing efforts for the Summer season well in advance (at least 63 days) to capture early planners.
- Monitor your own booking lead times against these Beverino averages to identify opportunities for dynamic pricing adjustments.
What Is the Average Length of Stay for Airbnb in Beverino?
Guests in Beverino stay about 3.9 nights on average, generating roughly 201 reservations and 10.6 bookings per listing in the latest AirROI dataset. The most common check-in time is 5:00 PM and check-out is 10:00 AM.
Monthly Length of Stay in Beverino
Check-in Time Distribution
Check-out Time Distribution
Stay Pattern Insights for Beverino
- A mid-range stay length points to leisure-driven demand — weekend getaways and short vacations. Hosts should optimize for quick turnover efficiency while keeping the guest experience smooth.
- 10.6 bookings per listing is a manageable pace that balances revenue with operational overhead.
- Stay lengths peak in Mar (8 nights) and shorten in Feb (1 nights). Adjust minimum-night requirements seasonally to match.
Recommendations for Hosts
- With shorter average stays, focus on streamlining turnover. Self-check-in, reliable cleaning crews, and pre-staged amenities can reduce per-booking operational costs.
- Set your check-in time to match or beat the market standard of 5:00 PM. Offering early check-in flexibility can be a low-cost differentiator.
- Monitor length-of-stay seasonality to adjust minimum-night requirements — longer minimums during peak periods maximize revenue while shorter minimums fill gaps in shoulder seasons.
Beverino Airbnb Minimum Stay Requirements Analysis
Distribution of Listings by Minimum Night Requirement
1 Night
6 listings
31.6% of total
2 Nights
4 listings
21.1% of total
3 Nights
1 listings
5.3% of total
4-6 Nights
2 listings
10.5% of total
30+ Nights
6 listings
31.6% of total
Key Insights
- The most prevalent minimum stay requirement in Beverino is 1 Night, adopted by 31.6% of listings. This highlights the market's preference for shorter, flexible bookings.
- A significant segment (31.6%) caters to monthly stays (30+ nights) in Beverino, pointing to opportunities in the extended-stay market.
Recommendations
- Align with the market by considering a 1 Night minimum stay, as 31.6% of Beverino hosts use this setting.
- Explore offering discounts for stays of 30+ nights to attract the 31.6% of the market seeking extended stays.
- Adjust minimum nights based on seasonality – potentially shorter during low season and longer during peak demand periods in Beverino.
Beverino Airbnb Cancellation Policy Trends Analysis (2026)
Limited
1 listings
5.3% of total
Flexible
5 listings
26.3% of total
Moderate
12 listings
63.2% of total
Firm
1 listings
5.3% of total
Cancellation Policy Insights for Beverino
- The prevailing Airbnb cancellation policy trend in Beverino is Moderate, used by 63.2% of listings.
- The market strongly favors guest-friendly terms, with 89.5% of listings offering Flexible or Moderate policies. This suggests guests in Beverino may expect booking flexibility.
Recommendations for Hosts
- Consider adopting a Moderate policy to align with the 63.2% market standard in Beverino.
- Regularly review your cancellation policy against competitors and market demand shifts in Beverino.
How Much Are Airbnb Cleaning Fees in Beverino?
Cleaning fees in Beverino are meaningful operating levers, not just pass-through charges. What matters most is how often hosts charge them, how high they run relative to market norms, and how large a share of gross revenue they consume.
Cleaning Fee Insights for Beverino
- 73.7% of listings charge a cleaning fee, making it standard practice in Beverino. Guests expect it and factor it into their booking decisions.
- The gap between the average ($44) and median ($17) cleaning fee indicates some high-end properties are pulling the average up considerably.
- Cleaning fees represent 5.5% of gross revenue on average — a modest component of the overall booking price.
Recommendations for Hosts
- Price your cleaning fee competitively against the Beverino median of $17. Fees significantly above market norms can deter bookings, especially for shorter stays.
- Monitor competitor cleaning fees regularly. Airbnb's search algorithm factors in total price, so a well-calibrated cleaning fee can improve your listing's ranking.
What Do the Top Airbnb Listings in Beverino Look Like?
Benchmark your potential! Explore examples of top-performing Airbnb properties in Beverinobased on Trailing Twelve Month (TTM) revenue. Analyze their characteristics, revenue, occupancy rate, and ADR to understand what drives success in this market.
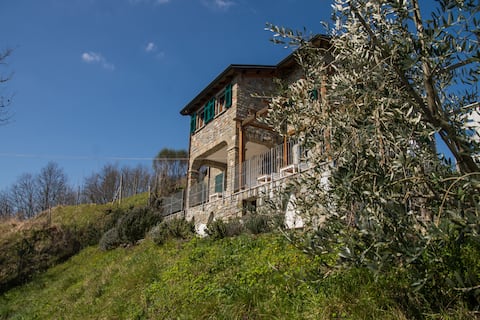
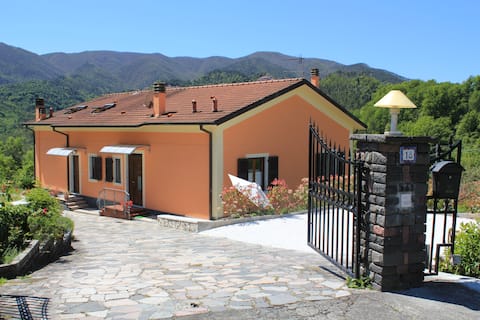
Angiò nel Cere' Farmhouse - 5 Terre
Entire Place • 4 bedrooms
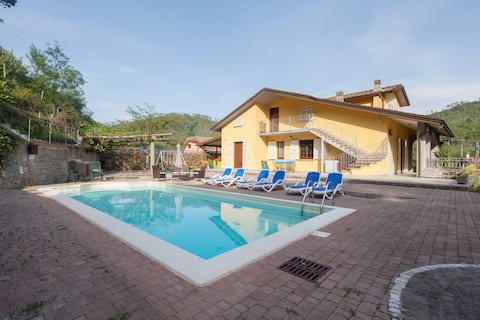
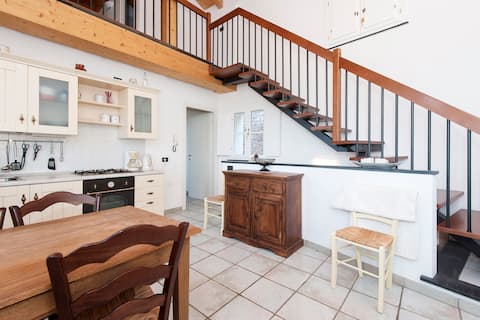
House with pool near 5 Terre-011003-AFF-0008
Entire Place • 3 bedrooms
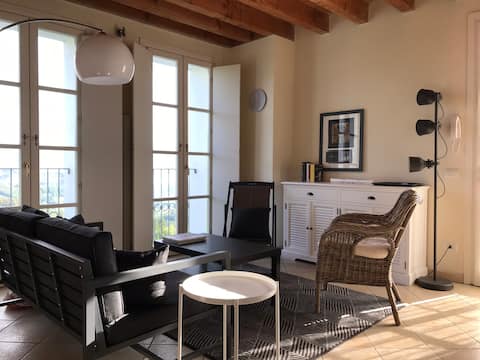
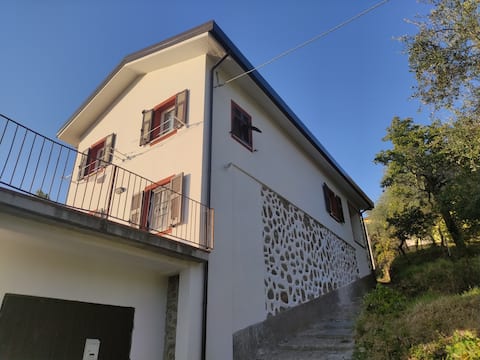
Il Poggio - A nest with a view, in Cinque Terre
Entire Place • 2 bedrooms
La CoLLina del Moro
Entire Place • 1 bedroom
Amazing house in "5 Terre" area!
Entire Place • 2 bedrooms
Vara House 1890, near 5 Terre
Entire Place • 2 bedrooms
Note: Performance varies based on location, size, amenities, seasonality, and management quality. Data reflects the past 12 months.
Who Are the Top Airbnb Hosts in Beverino?
Learn from the best! This table showcases top-performing Airbnb hosts in Beverino based on the number of properties managed and estimated total revenue over the past year. Analyze their scale and performance metrics.
| Host Name | Properties | Grossing Revenue | Stay Reviews | Avg Rating |
|---|---|---|---|---|
| Maria-Francesca | 4 | $36,343 | 103 | 4.94/5.0 |
| Laura | 1 | $17,932 | 101 | 4.73/5.0 |
| Antonella | 1 | $14,689 | 65 | 4.85/5.0 |
| Carla Morena | 1 | $14,523 | 39 | 4.97/5.0 |
| Sascha | 1 | $10,161 | 213 | 4.79/5.0 |
| Chiara | 1 | $10,072 | 5 | 4.80/5.0 |
| Francesco | 1 | $5,255 | 28 | 4.79/5.0 |
| Giuliana | 1 | $4,598 | 10 | 4.70/5.0 |
| Andrea | 2 | $4,440 | 9 | 4.86/5.0 |
| Ornella | 2 | $4,065 | 63 | 4.88/5.0 |
Analyzing the strategies of top hosts, such as their property selection, pricing, and guest communication, can offer valuable lessons for optimizing your own Airbnb operations in Beverino.
Who Are the Airbnb Hosts in Beverino?
Beverino has a relatively balanced host base.
Host Profile Insights for Beverino
- Only 10.5% of hosts hold Superhost status, suggesting a relatively young or casual market where quality improvements can pay outsized dividends.
- 10.5% of listings have Instant Book enabled. Lower Instant Book adoption means many guests must request approval, which can slow conversions.
- 47.4% of listings use Airbnb's simplified pricing (host-only fee), where the host pays the entire platform service fee and the guest sees one all-in price with no separate Airbnb service charge. Lower adoption suggests a market with more independent hosts managing listings directly through Airbnb.
Recommendations for Hosts
- Earning Superhost status can significantly improve search ranking and guest trust. Focus on maintaining high response rates, low cancellations, and strong reviews.
- Consider enabling Instant Book — it reduces booking friction and Airbnb's algorithm tends to favor Instant Book listings in search results.
- Benchmark your host metrics against these Beverino averages regularly and adjust your hosting strategy based on what top performers do differently.
How Does Beverino's Airbnb Market Compare to Nearby Cities?
How does the Beverino Airbnb market stack up against its neighbors? Compare key performance metrics like average monthly revenue, ADR, and occupancy rates in surrounding areas to understand the broader regional STR landscape.
Compared with Bellagio, Beverino has 17 percentage points lower occupancy and about $206 lower ADR. That helps frame whether this market is winning more on demand, pricing, or both.
| Market | Active Properties | Monthly Revenue | Daily Rate | Avg. Occupancy |
|---|---|---|---|---|
| Ranco | 12 | $4,816 | $544.88 | 37% |
| Laglio | 62 | $4,191 | $534.99 | 41% |
| Cossano Belbo | 15 | $3,668 | $344.28 | 40% |
| Castelfranco di Sotto | 46 | $3,602 | $389.09 | 37% |
| Portofino | 74 | $3,509 | $506.41 | 37% |
| Bellagio | 446 | $3,271 | $330.83 | 48% |
| Vico Morcote | 12 | $3,147 | $334.72 | 45% |
| Sala Comacina | 72 | $3,105 | $455.51 | 46% |
| Oliveto Lario | 98 | $3,104 | $410.56 | 46% |
| Torno | 59 | $3,082 | $462.83 | 37% |
Frequently Asked Questions About Airbnb in Beverino
These quick answers summarize the most common investor and operator questions using AirROI's latest market data for Beverino.
How much do Airbnb hosts make in Beverino?
Beverino hosts earn about $6,986 per year on average, with an average nightly rate of $125 and RevPAR of $41. Those figures describe the typical revenue environment for active listings in Beverino, Liguria, not the ceiling for the best operators. Source: AirROI 2026 data, Beverino market, May 2025 to April 2026.
What is the average Airbnb occupancy rate in Beverino?
The average Airbnb occupancy rate in Beverino is 30.6%. August is the strongest month and February is the softest, so hosts should expect demand to move meaningfully throughout the year rather than stay flat.
What is the average Airbnb daily rate in Beverino?
Listings in Beverino average $125 per night. The broader pricing spread also matters: lower-performing listings cluster closer to the lower quartiles, while premium homes can price materially above the city average when demand spikes or listing quality stands out.
How many Airbnb listings are active in Beverino?
Beverino currently has about 19 active Airbnb listings in AirROI's market dataset. That supply count helps explain how competitive the market is, how much depth there is for benchmarking, and whether the market behaves like a niche destination or a scaled urban market.
How strict are short-term rental regulations in Beverino?
AirROI currently classifies the short-term rental regulation level in Beverino as High. The dataset also shows about 73.7% of listings with registration evidence. That is a market signal, not legal advice, so hosts should still confirm current licensing and compliance rules locally before listing.
What is the RevPAR for Airbnb in Beverino?
RevPAR in Beverino is about $41. That metric combines pricing and occupancy into one efficiency number, so it is often a better quick benchmark than ADR alone when investors want to compare how well listings convert nightly rates into realized revenue.
Is Airbnb profitable in Beverino?
Occupancy of 30.6% means Beverino is a more selective market. Profitability is achievable but requires careful cost management, premium positioning, or targeting longer stays to reduce turnover. Average annual revenue is $6,986, but individual returns depend on property type, location within the city, and the host's operating efficiency.
How far in advance do guests book Airbnb in Beverino?
The average booking lead time in Beverino is about 64 days — a longer planning horizon typical of destination or vacation markets where travelers book well in advance. Hosts who understand their market's booking cadence can adjust minimum stays and pricing windows accordingly.
What are the best neighborhoods for Airbnb in Beverino?
Based on AirROI's analysis, some of the top neighborhoods for short-term rentals in Beverino include Beverino Center, Cinque Terre National Park, Castello di Monteriggioni. Each area attracts different guest profiles — from business travelers to leisure visitors — so the best location depends on the property type and target audience a host is aiming for. See the full neighborhood breakdown above.
What type of property performs best on Airbnb in Beverino?
entire_home listings make up 63.2% of the active supply in Beverino. The most common configuration does not always mean the most profitable — operators who identify underserved property types or bedroom counts can sometimes outperform the market average by filling a gap in local supply.
How does Beverino compare to nearby Airbnb markets?
Among neighboring markets, Ranco posts $57,793 in average annual revenue with 36.6% occupancy, compared to Beverino's $6,986 and 30.6%. Comparing nearby markets helps investors understand whether a destination's performance reflects local demand or broader regional trends.
What is the average length of stay in Beverino?
The average Airbnb stay length in Beverino is about 3.9 nights. That matters for turnover, cleaning operations, and pricing strategy because shorter stays increase changeovers while longer stays can smooth occupancy and reduce operational friction.
What is the average Airbnb guest rating in Beverino?
Airbnb listings in Beverino average 4.85 out of 5 overall. About 15.8% of listings carry the guest favorite badge, which suggests a meaningful share of inventory is competing on review quality rather than price alone.
Which amenities boost Airbnb revenue in Beverino?
Refrigerator and Bed linens are among the strongest revenue-linked amenities in Beverino. In AirROI's latest dataset, listings with these amenities outperform those without on average revenue, which makes amenities analysis useful for prioritizing investment and listing upgrades.
Do Airbnb hosts charge cleaning fees in Beverino?
Yes. About 73.7% of active Airbnb listings in Beverino charge a cleaning fee, and the average fee is $44. The more important operating benchmark is how much of gross revenue that fee consumes, not just the absolute dollar amount.
What percentage of Airbnb hosts are Superhosts in Beverino?
Only 10.5% of hosts hold Superhost status, suggesting the market has a large share of newer or less active operators — an opportunity for committed hosts to stand out.
About AirROI Market Data
AirROI tracks over 20 million properties across 190+ countries and maintains 15+ years of historical performance data, making it one of the deepest Airbnb and STR intelligence platforms available. The analytics pipeline aggregates listing-level data monthly — revenue, occupancy, nightly rates, RevPAR, guest demographics, booking patterns, and competitive supply — so investors and operators can benchmark any market against its own history and against neighboring destinations.
Real estate investors, property managers, financial institutions, hedge funds, tourism boards, hospitality consultants, tech platforms, and academic researchers rely on AirROI data to underwrite acquisitions, optimize pricing, model macro trends, and conduct peer-reviewed research. Data is available through in-depth market reports like this one and the Airbnb API with 22 endpoints and an Airbnb MCP Server for AI agents.
AirROI proprietary analytics as of 2026-04-30. Metrics reflect trailing twelve-month aggregates from active listings. Revenue figures are market averages, not projections. Neighborhood descriptions are AI-generated and reviewed for accuracy. For full methodology, see the data methodology page.